 Open Access Article
Creative Commons Attribution 3.0 Unported Licence
Life cycle assessment of polyols for polyurethane production using CO2 as feedstock: insights from an industrial case study†
Niklas
von der Assen
and
André
Bardow
*
Lehrstuhl für Technische Thermodynamik, RWTH Aachen University, 52062 Aachen, Germany. E-mail: andre.bardow@ltt.rwth-aachen.de; Fax: +49 241 8092255; Tel: +49 241 8095380
First published on 28th April 2014
Abstract
Polyethercarbonate polyols from carbon dioxide (CO2) are starting to be synthesized on industrial scale. These polyols can be further processed into polyurethanes enabling CO2 to be utilized in large amounts. Utilization of CO2 as alternative carbon feedstock for polyols is motivated from the potential to reduce greenhouse gas (GHG) emissions and fossil resource depletion. This article presents a life cycle assessment for production of CO2-based polyethercarbonate polyols in a real industrial pilot plant. The considered cradle-to-gate system boundaries include polyol production and all upstream processes such as provision of energy and feedstocks. In particular, provision of CO2 from a lignite power plant equipped with a pilot plant for CO2 capture is considered. Production of polyols with 20 wt% CO2 in the polymer chains causes GHG emissions of 2.65–2.86 kg CO2-eq kg−1 and thus, does not act as GHG sink. However, compared to production of conventional polyether polyols, production of polyols with 20 wt% CO2 allows for GHG reductions of 11–19%. Relating GHG emission reductions to the amount of CO2 incorporated, up to three kg CO2-eq emissions can be avoided per kg CO2 utilized. The use of fossil resources can be reduced by 13–16%. The impacts reductions increase with further increasing the CO2 content in the polyols. All other investigated environmental impacts such as eutrophication, ionizing radiation, ozone depletion, particulate matter formation, photochemical oxidant formation, and terrestrial acidification are also lowered. Therefore, synthesis of polyethercarbonate polyols from CO2 is clearly favorable compared to conventional polyether polyols from an environmental point of view.
1. Introduction
An environmentally promising measure to reduce greenhouse gas (GHG) emissions and fossil resource depletion is carbon dioxide capture and utilization (CCU). Carbon dioxide (CO2) can be utilized as carbon feedstock in a variety of applications.1–4 An already technologically viable option is the utilization of CO2 for polymers.5,6 The synthesis of alternating polypropylene carbonates (PPC) from propylene oxide (PO) and CO2 has already been commercialized.7 However, the glass transition temperature of PPC is about 37 °C which limits its application to specialty polymers.7,8 Recently, the successful synthesis of polyethercarbonate polyols by copolymerization of CO2 and epoxides has been reported (Scheme 1).8 Due to a favorable glass transition temperature and low viscosity, the polyethercarbonate polyols can readily be processed to polyurethane (PU) foams.8 Thus, polyethercarbonate polyols can substitute conventional polyether polyols of which the global production was 8 Mt a−1 in 2012.9 Theoretically, production of polyethercarbonate polyols could therefore utilize up to 1.6 Mt a−1 CO2 as feedstock (assuming an average CO2 content of 20 wt%). | ||
| Scheme 1 Polymerization of propylene oxide (PO) and carbon dioxide (CO2) to polyethercarbonate polyols using a DMC catalyst and a multifunctional alcohol (e.g. glycerol) as starter. Adapted from ref. 7 and 8. | ||
CO2 is a particularly promising feedstock since “CO2is an abundant, inexpensive and non-toxic renewable C1resource.”5 For polyethercarbonate polyols, in particular, CO2 can be inserted ‘as such’, i.e., as monomeric C1 building block, and the energy-intensive cleavage of C![[double bond, length as m-dash]](https://www.rsc.org/images/entities/char_e001.gif) O bonds can be avoided.10 Furthermore, CO2 partially substitutes energy- and emission-intensive epoxides. Still, energy requirements and GHG emissions are caused by provision of epoxides required as co-reactants as well as by provision of CO2 itself.11
O bonds can be avoided.10 Furthermore, CO2 partially substitutes energy- and emission-intensive epoxides. Still, energy requirements and GHG emissions are caused by provision of epoxides required as co-reactants as well as by provision of CO2 itself.11
Therefore, the environmental impacts of CO2-based polyol production should be determined in a detailed environmental assessment.11,12 As suitable tool for environmental assessment of CCU technologies, life cycle assessment (LCA) is often recommended.10,13,14 LCA is a methodology to evaluate environmental impacts of products and processes along their entire life cycles. However, LCA of CCU is not yet standard practice.11,12 In a recent book on CCU, Centi et al. explicitly state: “For the production of CO2-based polymers, correct LCA assessments also do not exist […].”15
In this work, we present an LCA study for production of polyethercarbonate polyols from PO and CO2. For this purpose, we employ a cradle-to-gate LCA scope: the analyzed product system comprises production and purification of CO2-based polyethercarbonate polyols as well as all processes for provision of energy and feedstocks. In particular, provision of the feedstock CO2 is included: CO2 is captured from a lignite power plant, compressed and transported to the polyol production plant. The major considered environmental impacts are global warming (CO2-equivalents) and fossil resource depletion (oil-equivalents). Regarding these impacts, the product system for CO2-based polyethercarbonate polyols is compared to an equivalent product system consisting of conventional polyols production and a lignite power plant without CO2 capture. Sensitivity analyses for PO production technologies and CO2 allocation options show that CO2-based polyols have reduced impacts with respect to global warming and fossil resource depletion of 11–19% and 13–16%, respectively.
In section 2, the LCA methodology and underlying process data are described. Section 3 contains LCA results and sensitivity analyses as well as the discussion thereof. In section 4, we draw conclusions for the environmental benefits of CO2-based polyols, and for the environmental assessment of CCU technologies in general.
2. Data and methodology
2.1 System boundaries and goal of LCA
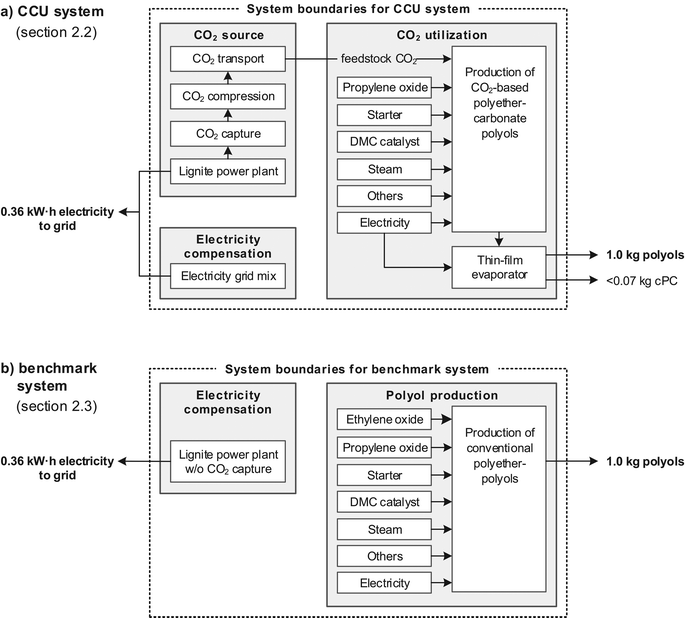
Life cycle assessment (LCA) is a methodology to evaluate environmental impacts of products and processes taking into account their entire life cycles. A life cycle covers all activities from cradle to grave, i.e., from extraction of raw materials, transport, production and product use to recycling and final disposal of wastes. However, a cradle-to-gate approach is often sufficient if products with identical downstream processes (gate-to-grave) are compared.12The primary goal of this LCA is to determine whether it is environmentally favorable to utilize CO2 as feedstock for polyols. For this purpose, we take into account the system-wide effects of CO2 utilization compared to conventional polyol production (Fig. 1). The product system for CO2-based polyethercarbonate polyols is compared to an equivalent product system for conventional polyether polyols. It is sufficient to consider only production of polyols (cradle to gate) since product properties are similar for CO2-based and conventional polyols, as well as for their subsequent polyurethanes.8 The downstream processes of polyurethane foaming, foam use and foam disposal are similar for CO2-based and conventional polyols and therefore neglected. Potential differences in downstream processes are discussed in the ESI.† Sections 2.2 and 2.3 contain a description for the cradle-to-gate product systems for CO2-based and conventional polyols.
Since the main environmental motivations for CCU are reducing CO2 emissions and establishing an alternative carbon source, this study compares the product systems for CO2-based and conventional polyols with respect to global warming and fossil resource depletion.12 The global warming impacts (GW) are calculated as cumulated GHG emissions in CO2-equivalents using 100-year global warming potentials (GWP100a). Fossil resource depletion (FD) is calculated as the energy content of used fossil resources in oil-equivalents. Results are computed using GaBi LCA software and ReCiPe 1.08 Midpoint (Hierarchist) impact categories.16,17 Results for the midpoint impact categories eutrophication, ionizing radiation, ozone depletion, particulate matter formation, photochemical oxidant formation, and terrestrial acidification as well as corresponding normalized values have also been analyzed and are given in the ESI.†
2.2 Product system for CO2-based polyols
The product system for CO2-based polyols includes the production of polyethercarbonate polyols as well as provision of required energy and feedstocks. In our earlier work on LCA of CCU,12 we highlighted the importance of including all upstream processes for feedstock production in LCA. In particular, the provision of feedstock CO2 should be included in the product system.11 The present LCA case study is conducted within the publicly funded research project “Dream Production”. In this project, CO2 is obtained from a lignite power plant with a pilot plant for CO2 capture. Due to a significant energy penalty from CO2 capture, the nominal net electricity output of the lignite power plant is reduced and must be compensated.18 Therefore, the product system for CO2-based polyols consists of the following three stages: CO2 source including CO2 capture, electricity compensation, and CO2 utilization for polyols production (Fig. 1a). We refer to this entire product system as CCU system. LCA data for the CCU system are taken from GaBi LCA database if not stated otherwise.17 A complete list of LCA data sources is given in the ESI.†The CO2 source in the project “Dream Production” is a lignite power plant in Niederaussem, Germany, operated by electricity supplier RWE.19 The plant unit provides a net power of 950 MW with an efficiency of 43%. The unit is equipped with a pilot plant for post-combustion CO2 capture, which separates 300 kg h−1 of CO2 from a flue gas bypass with a capture rate of 90%.20 We consider an amine-based solvent with a regeneration heat demand of 2760 MJth per ton CO2 captured which corresponds to an equivalent work loss of 123 (kW h)el per ton CO2 captured.20–22 After CO2 capture, the CO2 stream is fed into a pilot plant for CO2 cleaning, compression and filling in cylinders. Cleaning, compression to 17.5 bar and filling requires 142 kW h of electricity per ton CO2. Cleaned CO2 achieves EIGA standard (European Industrial Gases Association), complies with food grade quality23 and proved suitable for polyols synthesis. CO2 cylinder rags are transported to the 40 km distant polyol production plant by truck. Construction of the lignite power plant and facilities for CO2 capture and filling was shown to have a minor contribution to total life cycle impacts24 and is therefore not considered in this LCA.
Due to the electricity demand for CO2 cleaning, compression and filling, and the work loss from solvent regeneration, the power plant's electricity output to the grid is reduced by 265 kW h per ton CO2 captured. The power plant is limited by its boiler and cannot compensate for the reduced electricity. Consequently, the remaining electricity producers at the grid have to compensate for the reduced electricity with an increased electricity supply. Sathre et al. recommend accounting for electricity compensation in LCA.18 Following a simplified approach used by NETL,25 we model the compensated electricity based on average grid characteristics in Germany in 2010 (0.60 kg CO2-eq and 0.16 kg oil-eq per kW h).†
The main process of the CO2 utilization stage is the production of polyethercarbonate polyols from PO and CO2 using a multi-functional alcohol starter and a double metal cyanide (DMC) catalyst (cf.Scheme 1). For production of polyethercarbonate polyols within “Dream Production”, the chemical manufacturer Bayer set up a kg-scale pilot plant in Leverkusen, Germany. From this pilot plant, primary input data for feedstocks, catalyst and energy demand such as steam or electricity as well as output data for (by-) products were collected. By using a DMC catalyst, the formation of the by-product cyclic propylene carbonate (cPC) can be limited to 0.02–0.07 kg cPC per kg polyol, depending on the CO2 content in the final polyethercarbonate polyols. Suitable product properties are obtained for CO2 contents of up to 30 wt% in the polymer chains.8 In this study, three different CO2 contents in the polymer chains are evaluated: 10, 20 and 30 wt%. In the following, ‘wt% CO2’ always refers to the CO2 content in the polymer chains. Absolute mass fractions of CO2 in the entire polyol are between 10 and 29%. The by-product cPC is separated from the polyols by passing the reactor output through a thin-film evaporator.
A cradle-to-gate LCA considers all upstream processes such as provision of feedstocks, catalyst and energy. The major feedstock PO can be obtained by alternative production technologies. The goal of this LCA is not to assess a particular PO technology for feedstock supply, but rather to assess CO2-based polyol production in general. Therefore, a PO production mix with the following composition is used in the default scenario:26 43% chlorohydrin process (CHPO), 33% PO/SM process with styrene monomer as co-product, 16% PO/TBA with t-butyl alcohol as co-product (also called PO/MTBE), 5% hydrogen peroxide process (HPPO), and 4% Sumitomo process with cumene hydroperoxide as oxidant. The impact of replacing this mix by the individual PO technologies is assessed in a scenario analysis (section 3.2). LCA data for CHPO and PO/TBA are taken from GaBi LCA database.17 LCA data for PO/SM and HPPO processes were modeled according to material and energy flows from HIS Chemical PEP Yearbook.27 The Sumitomo process is not considered due to missing LCA data and the other PO processes are rescaled accordingly. Glycerol is used as starter. A detailed sub-LCA for the production of DMC catalyst28 was performed using data on material and energy flows provided by Bayer. Construction of the pilot plant or of any other components is not included for two reasons: first, production plants for CO2-based and conventional polyols are similar and largely cancel each other out in a comparison; second, the share of environmental impacts from plant construction is typically found to be small in the chemical industry.29
2.3 Product system for conventional polyols
The product system for conventional polyols serves as benchmark and is divided into electricity generation and conventional polyol production (Fig. 1b). For production of conventional polyether polyols, only fossil-based feedstocks PO and ethylene oxide (EO) are consumed. The same PO, starter, and DMC catalyst as in the CCU system are used in the LCA inventory. Since no by-products are formed, purification of polyols is not required. Conventional polyol production does not utilize CO2 and is therefore not linked to a CO2 source. However, electricity generation is added to the product system to account for the electricity generated in the CCU system (cf.Fig. 1 and section 2.4). Electricity in the benchmark system is generated in an equivalent lignite power plant without CO2 capture and a net efficiency of 43% (0.96 kg CO2-eq and 0.26 kg oil-eq per kW h).LCA data sources for the benchmark system are identical to the CCU system for all energy sources and feedstocks except EO.† EO is mainly produced by direct oxidation of ethylene with oxygen.30 For this process, LCA data are taken from GaBi.†
2.4 Functional unit for system-wide assessment
The functional unit in LCA quantifies the functions of the investigated product systems and serves as basis for comparison.12 The main functions of the CCU system (Fig. 1a) and the benchmark system (Fig. 1b) are production of polyols for polyurethane production, and supply of electricity to the German electricity grid. Production of cPC is not considered as main function (see below).To quantify the main functions, we choose 1.0 kg of polyol as reference for the function ‘polyol production’. The second function ‘electricity supply’ can be quantified through the amount of CO2 that is captured to produce 1.0 kg of polyol. However, the CO2 content and thus the amount of captured CO2 are varied in our study. Since the amount of CO2 captured determines the energy need for CO2 capture, the second function ‘electricity supply’ would be different for each case. In order to still use one functional unit for all cases studied, we define the electricity supply as follows:
We consider the maximum amount of CO2 used for production of polyethercarbonate polyol, i.e., the case with 30 wt% CO2. For 1.0 kg of polyol with 30 wt% CO2 content, 0.31 kg CO2 is captured from the flue gas. The difference of 0.01 kg between captured CO2 and CO2 incorporated into in the polyol is due to unused CO2 deposits in the CO2 cylinders. While capturing 0.31 kg CO2, the lignite power plant with CO2 capture generates net electricity of 0.28 kW h. Using the same lignite input, net electricity of 0.36 kW h would be produced by an equivalent conventional lignite power plant without CO2 capture since it does suffer from the energy penalty from CO2 capture. The lower electricity supply of 0.08 kW h of the power plant with CO2 capture, i.e., the energy demand of CO2 capture, is assumed to be compensated by the grid mix (bottom left box in Fig. 1a). This approach to account for the so-called make-up power is commonly applied for LCA of CCS systems.18,25
Thus, for each 1.0 kg polyols with 30 wt% CO2, a total generation of 0.36 kW h of electricity (0.28 kW h from the lignite power plant and 0.08 kW h make-up power) is supplied to the grid. For production of 1.0 kg of conventional polyether polyols (0 wt% CO2), no CO2 is captured from the flue gas and the conventional lignite power plant directly supplies 0.36 kW h electricity to the grid. For production of 1.0 kg polyols with CO2 contents between 0 and 30 wt%, the make-up power is between 0 and 0.08 kW h; the electricity by the lignite power plant is between 0.28 and 0.36 kW h, whereby both always total to 0.36 kW h.
Thus, we define the functional unit as production of 1.0 kg polyols for polyurethane production, and supply of 0.36 kW h electricity to the electricity grid (short: 1.0 kg polyols and 0.36 kW h grid electricity).
The formation of by-product cPC should be considered in LCA since cPC is a valuable chemical. CPC is used as aprotic polar solvent, electrolyte for batteries, cleaning solvent, plasticizer, precursor for linear (poly-) carbonates and additive for cosmetics and adhesives.5,31,32 Since only small amounts of less than 7 wt% cPC are formed, environmental impacts from CO2 utilization processes (cf.Fig. 1a) are allocated to polyols and cPC. Feedstocks (PO, CO2 and glycerin) are allocated according to the feedstock masses incorporated in polyols and cPC, respectively. The catalyst is fully assigned to the polyols. Other inputs are allocated according to polyol and cPC masses. The minor influence of alternative allocation options for cPC is illustrated in the ESI.†
2.5 Functional unit for product-specific assessment
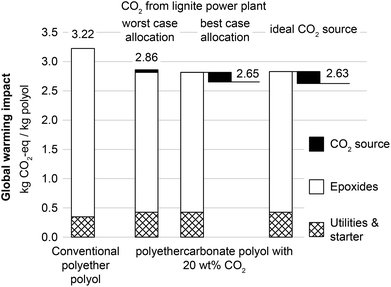
A second functional unit is defined as solely 1.0 kg polyols to obtain product-specific LCA results for polyols. However, this approach requires ambiguous choices for allocation of impacts to polyol production and grid electricity supply as discussed in detail by von der Assen et al.11 To illustrate the effect of alternative allocation options, two options are considered.The first allocation option assigns all impacts of the entire CCU system fully to polyols whereas grid electricity is not assigned with any impacts at all. This option represents a worst-case allocation scenario for polyols. In the second allocation option, polyethercarbonate polyols in the CCU system are assigned with a credit for the supply of grid electricity. Grid electricity supplied in the CCU system is assumed to substitute electricity from the conventional power plant without CO2 capture. This option assigns environmental benefits fully to CO2-based polyol production and represents a best-case allocation scenario for CO2 supply from lignite power plants.
In addition to these extreme allocation options, we assess an alternative ideal CO2 source. The ideal, though hypothetical CO2 source requires no energy for CO2 capture and does not cause any indirect GHG emissions. Therefore, the ideal CO2 source has a global warming impact of GW(CO2,feed,ideal) = −1 kg CO2-eq per kg feed stock CO2.12
3. LCA results and discussion
3.1 System-wide LCA results for polyols and grid electricity
The cradle-to-gate impacts on global warming and fossil resource depletion are assessed for the functional unit of 1.0 kg polyols and 0.36 kW h of grid electricity. Fig. 2 shows the global warming impacts for the benchmark system with conventional polyether polyols, and for the CCU system with polyethercarbonate polyols containing 20 wt% CO2. In both systems, the largest contributor to total GHG emissions is the production of epoxides (81 and 80%). By utilizing CO2 as feedstock for polyols, the system-wide GHG emissions can be reduced by 15% (−0.54 kg CO2-eq per functional unit). About 28% of the total GHG emission reductions originate from CO2 capture effects (−0.15 kg CO2-eq per functional unit) as result from emission reductions at the CO2 source and additional emissions for electricity compensation. Major GHG emission reductions of about 72% originate from CO2 utilization in the polyol production (−0.39 kg CO2-eq per functional unit) which can be explained by substitution of emission-intensive epoxides with CO2. The contributions in Fig. 2 only show in which processes emissions (reductions) occur. These emissions cannot directly be assigned to the processes’ functions and products. For example, emissions from electricity compensation (0.04 kg CO2-eq for the CCU system) cannot be assigned to either 0.36 kW h grid electricity or 1.0 kg polyols. Instead, product-specific impacts require a more detailed allocation approach (cf. section 3.3).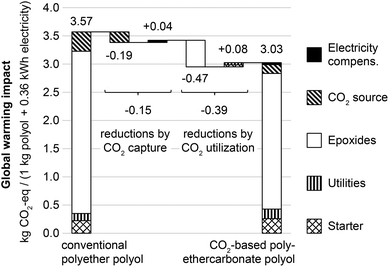 | ||
| Fig. 2 Global warming impacts in kg CO2-equivalents for product system of conventional polyether polyols (left) and CO2-based polyethercarbonate polyols (right, 20 wt% CO2 content). The CO2 source includes the lignite power plant, CO2 capture, CO2 compression and CO2 transport, if applicable. Utilities include DMC catalyst, steam, electricity, thin-film evaporator and others; cf.Fig. 1. Major reductions of GHG emissions originate from CO2 capture (−0.15 kg CO2-eq) and substitution of epoxides with CO2 (−0.47 kg CO2-eq). Changes in the polyol process do not add significantly to overall GHG emissions (+0.08 kg CO2-eq). | ||
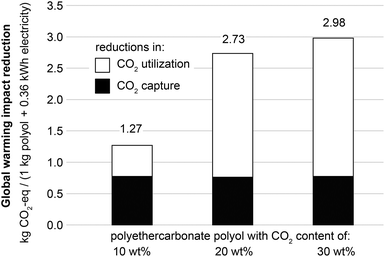
Recent CCU literature clearly distinguishes the amount of CO2 used from the avoided CO2-eq emissions.1Fig. 3 illustrates the amount of avoided CO2-eq emissions per amount of CO2 incorporated into polyethercarbonate polyols for CO2 contents of 10, 20 and 30 wt%. For all CO2 contents, the amount of avoided CO2-eq emissions is greater than the amount of CO2 incorporated into polyols. The main reason for this effect is the much larger global warming impact of PO (1.74–4.5 kg CO2-eq kg−1) and EO (1.6 kg CO2-eq kg−1) compared to CO2 (below 0.2 kg CO2-eq kg−1, cf. section 3.3). For 10 wt% CO2 content, mainly EO is replaced. For higher CO2 contents, the additional CO2 incorporated substitutes PO allowing for larger reductions than EO substitution.
Fig. 4 shows the fossil resource depletion caused by the benchmark system with polyether polyols, and by the CCU system with polyethercarbonate polyols containing 10, 20 and 30 wt% CO2. For fossil resource depletion, the utilization of CO2 for polyols shows a similar behavior as for global warming impacts. The main impact source is epoxide production and a substitution of these fossil-based epoxides reduces overall fossil resource depletion. It is well known from LCA for CCS that the fossil resource demand of power plants increases due to the energy required for CO2 capture.24 However, the increased fossil resource demand from CO2 capture is much smaller than the fossil resource reduction due to epoxide substitution. Therefore, the CCU system reduces overall fossil resource depletion by up to 22% for a 30 wt% CO2 content compared to the benchmark system.
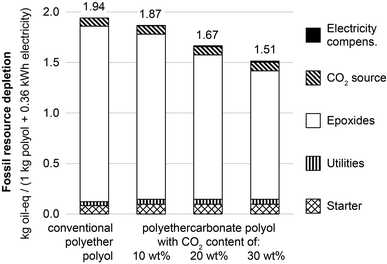 | ||
| Fig. 4 Fossil resource depletion in kg oil-equivalents for product system of conventional polyether polyols (left) and CO2-based polyethercarbonate polyols with 10, 20 and 30 wt% CO2 content (second left to right). The CO2 source includes the lignite power plant, CO2 capture, CO2 compression and CO2 transport, if applicable. Utilities include DMC catalyst, steam, electricity, thin-film evaporator and others; cf.Fig. 1. Major reductions of fossil resource depletion originate from substitution of epoxides with CO2 (−0.10, −0.31, and −0.47 kg oil-eq for 10, 20, and 30 wt% CO2 content, respectively). Additional impacts from the CO2 source, electricity compensation, and changes in the polyol process are small (between 0.03 and 0.04 kg oil-eq). | ||
In addition to impact reductions for global warming and fossil resource depletion, the CCU system also lowers impacts for eutrophication, ionizing radiation, ozone depletion, particulate matter formation, photochemical oxidant formation, and terrestrial acidification as shown in the ESI.† For all impact categories, normalized values have also been calculated:† normalized values for fossil resource depletion are much larger than other environmental impacts indicating the importance of fossil resource depletion for polyol production.
3.2 Variation of propylene oxide production technologies
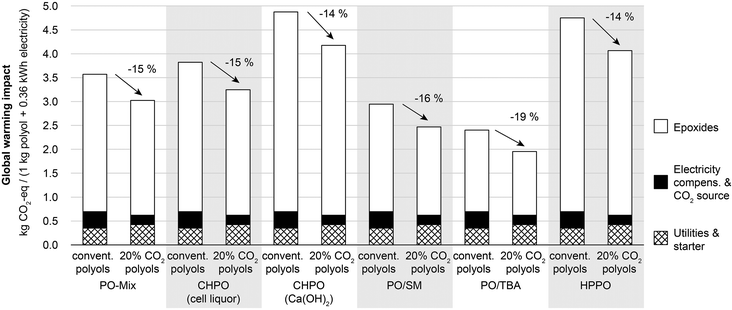
The results for the system-wide LCA illustrated in Fig. 2 and 4 show that the main source of impacts on global warming and fossil resource depletion is production of PO. This also holds for other environmental impact categories as shown in the ESI.† Thus, alternative production technologies for PO can significantly affect LCA results. Fig. 5 therefore shows the global warming impact for the benchmark and the CCU system using alternative PO production technologies. The global warming impact varies substantially between PO production technologies, from 2.40 to 4.88 kg CO2-eq per functional unit for the benchmark system, and from 1.95 to 4.18 kg CO2-eq per functional unit for the CCU system. However, when comparing the CCU system to the benchmark based on the same PO production technology, the CCU system always leads to reduced GHG emissions regardless of the considered PO production technology. These GHG emission reductions vary only between 14 and 19%.3.3 Product-specific global warming impact for polyols
The previous sections show global warming impacts of the entire CCU system including supply of grid electricity. In Fig. 6, product-specific global warming impacts are shown solely for 1.0 kg of polyols. Conventional polyether polyols cause GHG emissions of 3.22 kg CO2-eq kg−1. For polyethercarbonate polyols with 20 wt% CO2 content, the global warming impact is between 2.65 and 2.86 kg CO2-eq kg−1 depending on the allocation approach. Thus, the global warming impact of CO2-based polyols is between 11 and 18% lower than for conventional polyols. For an ideal CO2 source with no energy demand for CO2 capture (right bar in Fig. 6), the maximum global warming impact reduction is 18% compared to conventional polyols. This implies that switching to environmentally favorable CO2 sources does not lead to major additional reductions in the total global warming impact for CO2-based polyols.For the different functional units and product systems, the results for the global warming impact and fossil resource depletion are summarized in Table 1.
| Conventional polyether polyol | CO2-based polyethercarbonate polyol | |||||||
|---|---|---|---|---|---|---|---|---|
| 10 wt% CO2 | 20 wt% CO2 | 30 wt% CO2 | ||||||
| a Lowest PO for GW and FD is PO/TBA. b Highest PO for GW is CHPO (Ca(OH)2). c Highest PO for FD is HPPO. d Lower bound obtained with ideal CO2 source. e Upper bound obtained with 100% allocation to polyols (worst case allocation). | ||||||||
| Functional unit: 1 kg polyols and 0.36 kW h grid electricity | ||||||||
| GW | PO-Mix | 3.57 | 3.45 | (−3%) | 3.03 | (−15%) | 2.68 | (−25%) |
| GW | Lowest POa | 2.40 | 2.22 | (−6%) | 1.95 | (−19%) | 1.72 | (−27%) |
| GW | Highest POb | 4.88 | 4.76 | (−2%) | 4.18 | (−14%) | 3.70 | (−24%) |
| FD | PO-Mix | 1.94 | 1.87 | (−4%) | 1.67 | (−14%) | 1.51 | (−22%) |
| FD | Lowest POa | 1.43 | 1.35 | (−6%) | 1.22 | (−15%) | 1.11 | (−22%) |
| FD | Highest POc | 2.53 | 2.46 | (−2%) | 2.19 | (−13%) | 1.98 | (−22%) |
| Functional unit: 1 kg polyols | ||||||||
| GW | Lower boundd | 3.22 | 3.07 | (−5%) | 2.63 | (−18%) | 2.26 | (−30%) |
| GW | Upper bounde | 3.22 | 3.20 | (−1%) | 2.86 | (−11%) | 2.63 | (−18%) |
| FD | Lower boundd | 1.87 | 1.78 | (−5%) | 1.58 | (−16%) | 1.42 | (−24%) |
| FD | Upper bounde | 1.87 | 1.81 | (−3%) | 1.63 | (−13%) | 1.50 | (−20%) |
4. Conclusions
To the best of our knowledge, this work can be considered the first published LCA for CO2-based polymers. LCA results show that the environmental impacts caused by polyol production mainly originate from PO production. Therefore, an environmentally favorable PO source should be chosen for PO supply. For further reductions of the environmental impacts of polyols, PO should be substituted by CO2 as carbon feedstock. The resulting CO2-based polyols cannot be considered as net GHG sink, i.e., it is still better for climate protection not to produce polyols in the first place. However, if polyol production is desirable, the utilization of CO2 allows for significant impact reductions: compared to conventional polyether polyols, polyethercarbonate polyols with 20 wt% CO2 reduce GHG emissions by 11–19%, and save fossil resources by 13–16%. CO2-based polyols can also lower impacts on eutrophication, ionizing radiation, ozone depletion, particulate matter formation, photochemical oxidant formation, and terrestrial acidification. Overall, CO2-based polyols are an excellent option for CO2 utilization: up to three kg CO2-eq GHG emissions can be reduced per kg CO2 incorporated. Furthermore, CO2-based polyols can be readily processed to polyurethanes enabling utilization of large amounts of CO2 and significant reductions of environmental impacts.Acknowledgements
This work has been carried out within the project “Dream Production – CO2as building block for polymers” (033RC1005B) funded by the German Federal Ministry of Education and Research (BMBF). The authors thank all project partners for many helpful discussions. In particular, we thank RWE Power AG, Bayer Technology Services and Bayer Material Science for providing relevant inventory data.References
- M. Aresta, A. Dibenedetto and A. Angelini, Chem. Rev., 2014, 114, 1709–1742 CrossRef CAS PubMed.
- W. Leitner, Coord. Chem. Rev., 1996, 153, 257–284 CrossRef CAS.
- P. Markewitz, W. Kuckshinrichs, W. Leitner, J. Linssen, P. Zapp, R. Bongartz, A. Schreiber and T. E. Müller, Energy Environ. Sci., 2012, 5, 7281–7305 CAS.
- M. Peters, B. Köhler, W. Kuckshinrichs, W. Leitner, P. Markewitz and T. E. Müller, ChemSusChem, 2011, 4, 1216–1240 CrossRef CAS PubMed.
- X.-B. Lu and D. J. Darensbourg, Chem. Soc. Rev., 2012, 41, 1462–1484 RSC.
- J. Langanke, A. Wolf and M. Peters, Polymers from CO2 – An Industrial Perspective, in Carbon Dioxide Utilization – Closing the Carbon Cycle, ed. P. Styring and A. Quadrelli, Elsevier, 2014, in print Search PubMed.
- D. J. Darensbourg and S. J. Wilson, Green Chem., 2012, 14, 2665–2671 RSC.
- J. Langanke, A. Wolf, J. Hofmann, K. Böhm, M. A. Subhani, T. E. Müller, W. Leitner and C. Gürtler, Green Chem., 2014, 16, 1865–1870 RSC.
- Bayer Material Science, Personal communication, 2014.
- E. A. Quadrelli, G. Centi, J.-L. Duplan and S. Perathoner, ChemSusChem, 2011, 4, 1194–1215 CrossRef CAS PubMed.
- N. von der Assen, J. Jung and A. Bardow, Energy Environ. Sci., 2013, 6, 2721–2734 CAS.
- N. von der Assen, P. Voll, M. Peters and A. Bardow, Chem. Soc. Rev., 2014 10.1039/C3CS60373C.
- M. Aresta and A. Dibenedetto, Dalton Trans., 2007, 2975–2992 RSC.
- G. Centi and S. Perathoner, Greenhouse Gases: Sci. Technol., 2011, 1, 21–35 CrossRef CAS.
- G. Centi and S. Perathoner, Perspectives and State of the Art in Producing Solar Fuels and Chemicals from CO2, in Green Carbon Dioxide: Advances in CO2 Utilization, ed. G. Centi and S. Perathoner, WILEY-VCH, Hoboken, NJ, USA, 2014, p. 4 Search PubMed.
- M. Goedkoop, R. Heijungs, M. Huijbregts, A. D. Schryver, J. Struijs and R. V. Zelm, ReCiPe 2008, A life cycle impact assessment method which comprises harmonised category indicators at the midpoint and the endpoint level; First edition (version 1.08) Report I: Characterisation, 2013, http://www.lcia-recipe.net Search PubMed.
- PE International, GaBi LCA Software and LCA Databases, 2012, http://www.gabi-software.com/databases/gabi-databases/ Search PubMed.
- R. Sathre, M. Chester, J. Cain and E. Masanet, Energy, 2012, 37, 540–548 CrossRef CAS PubMed.
- RWE Power AG, Niederaussem Power Plant, 2014, http://www.rwe.com/web/cms/en/60132/rwe-power-ag/locations/lignite/niederaussem-power-plant/ Search PubMed.
- P. Moser, S. Schmidt, G. Sieder, H. Garcia, I. Ciattaglia and H. Klein, Energy Procedia, 2009, 1, 807–814 CrossRef CAS PubMed.
- M. E. Boot-Handford, J. C. Abanades, E. J. Anthony, M. J. Blunt, S. Brandani, N. Mac Dowell, J. R. Fernandez, M.-C. Ferrari, R. Gross, J. P. Hallett, R. S. Haszeldine, P. Heptonstall, A. Lyngfelt, Z. Makuch, E. Mangano, R. T. J. Porter, M. Pourkashanian, G. T. Rochelle, N. Shah, J. G. Yao and P. S. Fennell, Energy Environ. Sci., 2014, 7, 130–189 CAS.
- P. Moser, S. Schmidt, G. Sieder, H. Garcia, T. Stoffregen and V. Stamatov, Energy Procedia, 2011, 4, 1310–1316 CrossRef PubMed.
- European Industrial Gases Association (EIGA), Carbon Dioxide Source Qualification Quality Standards And Verification, IGC Doc 70/08/E, Appendix A, Table 1, 2008 Search PubMed.
- A. Schreiber, P. Zapp and J. Marx, J. Ind. Ecol., 2012, 16, S155–S168 CrossRef CAS.
- National Energy Technology Laboratory, Life Cycle Analysis: Existing Pulverized Coal (EXPC) Power Plant, DOE/NETL-403-110809, 2010, http://www.netl.doe.gov/energy-analyses/pubs/EXPC_LCA_Report_093010.pdf Search PubMed.
- ChemSystems, PERP Report Abstract PERP07/08-6, Propylene Oxide, 2009.
- IHS Chemical, Process Economics Program (PEP) Yearbook, pp. 1089 (PO/SM Lyondell process), 1091 (PO/SM Shell process) and 1094 (HPPO BASF process), 2010, http://www.ihs.com/products/chemical/technology/pep/ Search PubMed.
- J. Hofmann, S. Ehlers, B. Klinksiek, T. Fechtel, M. Ruhland, J. Scholz, F. Föhles and U. Esser, PCT Int. Appl, WO-A-01/80994, 2001 Search PubMed.
- R. Frischknecht, Int. J. Life Cycle Assess., 2007, Special (1), 7–17 Search PubMed.
- S. Rebsdat and D. Mayer, Ethylene Oxide, in Ullmann's Encyclopedia of Industrial Chemistry, Wiley-VCH, Weinheim, 2001, vol. 13, pp. 547–572 Search PubMed.
- A.-A. G. Shaikh and S. Sivaram, Chem. Rev., 1996, 96, 951–976 CrossRef CAS PubMed.
- J. Sun, S. Fujita and M. Arai, J. Organomet. Chem., 2005, 690, 3490–3497 CrossRef CAS PubMed.
Footnote |
| † Electronic supplementary information (ESI) available: Discussion of system boundaries, list of LCA data sources; allocation details; LCA results for additional environmental impact categories. See DOI: 10.1039/c4gc00513a |
| This journal is © The Royal Society of Chemistry 2014 |

