 Open Access Article
Creative Commons Attribution 3.0 Unported Licence
Coherent dynamics of the charge density wave gap in tritellurides
L.
Rettig†
a,
J.-H.
Chu‡
b,
I. R.
Fisher
bc,
U.
Bovensiepen
a and
M.
Wolf
*d
aFakultät für Physik, Universität Duisburg-Essen, Lotharstr. 1, 47048 Duisburg, Germany
bGeballe Laboratory for Advanced Materials and Department of Applied Physics, Stanford University, CA 94305, USA
cStanford Institute for Materials and Energy Sciences, SLAC National Accelerator Laboratory, 2575 Sand Hill Road, Menlo Park, CA 94025, USA
dAbteilung Physikalische Chemie, Fritz-Haber-Institut der MPG, Faradayweg 4-6, 14195 Berlin, Germany. E-mail: wolf@fhi-berlin.mpg.de
First published on 17th April 2014
Abstract
The dynamics of the transient electronic structure in the charge density wave (CDW) system RTe3 (R = rare-earth element) is studied using time- and angle-resolved photoemission spectroscopy (trARPES). Employing a three-pulse pump–probe scheme we investigate the effect of the amplitude mode oscillations on the electronic band structure and, in particular, on the CDW energy gap. We observe coherent oscillations in both lower and upper CDW band with opposite phases, whereby two dominating frequencies are modulating the CDW order parameter. This demonstrates the existence of more than one collective amplitude mode, in contrast to a simple Peierls model. Coherent control experiments of the two amplitude modes, which are strongly coupled in equilibrium, demonstrate independent control of the modes suggesting a decoupling of both modes in the transient photoexcited state.
1 Introduction
Cooperative effects in low-dimensional materials represent a fascinating topic of condensed matter research. Various interactions of the electronic, orbital, spin and lattice degrees of freedom can lead to instabilities and broken-symmetry ground states leading to new emergent properties, which are of both fundamental and technological interest. Examples for such low-temperature broken-symmetry phases are superconducting, charge density wave (CDW) or magnetically ordered states, which are connected to other typically lower symmetry states by phase transitions as function of temperature, pressure, external fields, or are induced by optical excitation.As a model system for emergent order, the formation of a CDW ground state found in many materials of reduced dimensionality is one of the well-established and intensely studied examples at the heart of quantum many-body physics.1 CDW formation refers to a periodic modulation of the charge density (with wave vector q) which is accompanied by a periodic lattice distortion. A predominant mechanism for CDW formation is the Peierls scenario,2 which is most pronounced in a one-dimensional (1D) system or in systems where nesting (q = 2kF) across the Fermi surface occurs. In this mechanism a key ingredient is a high density of states at the Fermi level together with strong, anisotropic electron–phonon coupling giving rise to the opening of an energy gap Δ(k) at the Fermi surface along the nesting direction.1 The energy gap Δ(k) is a direct measure of the order parameter of the CDW phase and can be determined by appropriate spectroscopic tools from the occupied and unoccupied single-particle band structure.
Fluctuations or impulsive (e.g. optical) excitations can lead to collective excitations of the amplitude or phase of the complex order parameter Δ = |Δ|exp(iϕ). While for the phase mode the magnitude of Δ remains constant, the so-called amplitude mode directly modulates the magnitude of the gap leading to oscillations of | Δ | (t) in the free energy potential with a frequency associated to the phonon mode driving the Fermi surface nesting1 (Fig. 1(a)). A sketch of a simple linear band model shown in Fig. 1(b) illustrates the effect of the amplitude mode on the electronic band structure: The linear dispersing band (dashed black line) is modified by the opening of a CDW gap of magnitude ΔCDW at EF, which is proportional to the CDW order parameter, and is split into a lower and upper band (solid blue and red lines). The effect of the amplitude mode results in a modification of the magnitude of the gap, leading to a shift of both lower and upper CDW bands towards EF (dashed lines) and to a transient modulation of the gap size Δ(t).
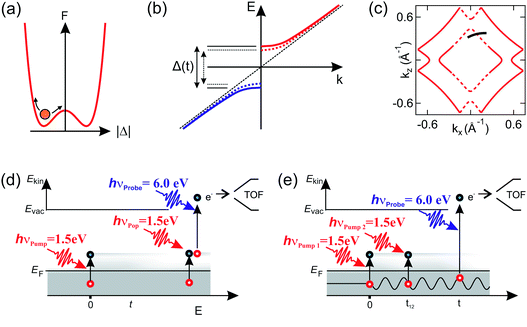 | ||
| Fig. 1 (a) Schematic of the free energy surface as a function of the order parameter | Δ |, and the motion of the amplitude mode. (b) Effect of the amplitude mode on the gapped dispersion of the CDW state, which transiently modulates the gap size Δ(t). (c) Normal state Fermi surface of RTe3. The dashed lines indicate the gapped part of the Fermi surface. The black line marks the k-space cut shown in Fig. 2. (d) Sketch of the three-pulse experiment for the investigation of the unoccupied CDW band dynamics. The second population pulse hνPop was kept at fixed delay before the probe pulse. (e) Sketch of the pulse sequence for the coherent control of the amplitude mode. Here, the separation of the two pump pulses, t12 was set fixed for each experiment. | ||
As the formation of broken symmetry ground states and emergent properties in general depends on a complex interplay of various elementary interactions, which occur on intrinsically different energy- and time scales, studies of the non-equilibrium dynamics of complex materials can reveal new insights into the underlying mechanisms and strengths of interaction between the various degrees of freedom.3,4 Ultrafast time-resolved spectroscopy provides direct access to these dynamics because the relevant elementary scattering and relaxation processes in solids occur typically on femto- to picosecond time scales. In the case of CDW formation the most direct measurement would be the complete mapping of the band structure to extract the order parameter Δ and to study the interaction of the electronic system with other (phonon) degrees of freedom. In the experiment this is achieved by time- and angle-resolved photoemission spectroscopy (trARPES). Thereby, an ultrashort optical pump pulse excites the system inducing e.g. the melting and subsequent recovery of the CDW phase and time evolution of the electronic structure changes are probed as snapshots by ARPES using a time-delayed ultrashort UV probe pulse (see e.g.ref. 4–8).
The material family of Tritellurides, RTe3 (R = rare-earth element), represents a quasi-1D model system, well suited to study the Fermi surface nesting driven CDW formation.9–13 Angle-resolved photoemission spectroscopy (ARPES) has revealed a great deal of information about the electronic structure in RTe3. The Fermi surface is modified by large energy gaps of several 100 meV in the CDW phase, making RTe3 an ideal candidate to study the dynamics intrinsically linked to the CDW state. Substitution of various lanthanides allows direct tuning of the CDW transition temperature TCDW by chemical pressure, whereby for the heavier elements (e.g. DyTe3, HoTe3), a second, perpendicular CDW transition at a lower transition temperature occurs.13,14
In previous trARPES studies on TbTe3 a transition into a transient metallic state together with a coherent oscillation at ∼2.3 THz of the CDW band was observed after ultrafast optical excitation.6,15 The analysis was based on the changes of the transient dispersion of the gapped CDW band close to EF and the coherent oscillation was attributed to the CDW amplitude mode due to its exclusive occurrence close to kF and in the gapped region of the Brillouin zone of the CDW phase below TCDW. In particular, the observed oscillation modulates the peak position of the occupied CDW band, as well as its amplitude and spectral width. In addition to the dynamics of the occupied band, a strong downshift of the unoccupied band was observed in the first ∼300 fs, leading to an initial suppression of the gap size.15 However, this previous work was lacking a direct measurement of the order parameter Δ(t) and its temporal evolution over an extended range of time delays to extract detailed information about the coupling of various phonon modes to the band structure and, in particular, to the CDW gap. Therefore, a novel approach is necessary to investigate the coherent dynamics of the full CDW energy gap, as will be presented below.
In this work we study the complete dynamics of the CDW order parameter and investigate the occupied and unoccupied band structure in the gapped region as well as the influence of the amplitude mode oscillations on the position and size of the CDW gap in full detail. We employ a novel three-pulse excitation scheme to repopulate and probe the population in the upper (normally unoccupied) CDW band over extended periods of time (see Fig. 1(d)). From a detailed analysis of the frequencies of the modes modulating the gap size we obtain two dominating contributions at 2.2 THz and 1.75 THz, which demonstrates the existence of more than one amplitude mode, in contrast to a simple Peierls picture. Furthermore, by employing coherent control of the amplitude modes by a two pulse excitation scheme, we demonstrate a transient decoupling of the amplitude modes, which show strong coupling in thermal equilibrium.16
2 Experimental methods
The experimental setup for trARPES has been described in detail elsewhere.15,17 Single crystals of RTe3 (R = Tb, Dy) grown by slow cooling of a binary melt14 were mounted on a 45° slanted sample holder. The samples where cleaved in ultrahigh vacuum (p < 5E − 11 mbar) at T = 30 K, where also the trARPES measurements were performed. For the three-pulse experiments, the output of a Ti:Sa regenerative amplifier (Coherent RegA) operating at a repetition rate of 300 kHz was frequency quadrupled using two successive β-bariumborate (BBO) crystals to yield hνprobe = 6.0 eV used as probe pulses. The rest of the fundamental beam at hνpump = 1.5 eV was split into two parts and delayed separately using two individual optical delay stages in a Mach-Zehnder interferometer configuration, used as the two pump pulses. For the momentum- and energy-resolved detection of photoelectrons emitted by the probe pulses, the sample was rotated in front of a time-of-flight (TOF) spectrometer with an effective opening angle of ±3.5°. The overall time and momentum resolution was 100 fs and 50 meV, respectively.3 Results
The occupied and unoccupied band structure of TbTe3 in the gapped region probed 50 fs after excitation is shown in Fig. 2 in a false color representation, along the Brillouin zone (BZ) cut indicated in Fig. 1(c). Here, a single weak pump pulse with a fluence of FPop ∼ 90 μJ cm−2 (population pulse), set at tPop = 50 fs before the probe pulse was used to transiently populate the normally unoccupied states at E > EF. Both lower and upper CDW bands are visible below and above the Fermi level, respectively, separated by the CDW energy gap of ΔCDW ∼ 400 meV. The delay tPop was carefully chosen such that the transient population of the unoccupied states was maximal.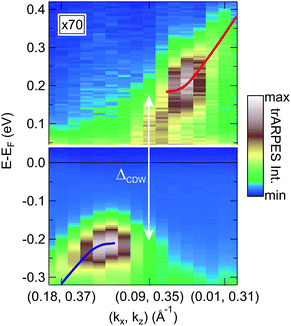 | ||
| Fig. 2 trARPES intensity of TbTe3 at an equilibrium temperature of 30 K recorded at 50 fs after excitation with a single pump pulse as a function of energy and momentum along the cut through the Brillouin zone shown in Fig. 1(c) in a false color representation. The upper color scale is enhanced by a factor of 70. Red and blue lines are guides to the eye to highlight the dispersion of the upper and lower CDW band, respectively, which are separated by the CDW energy gap ΔCDW (see Fig. 1(b)). | ||
In order to investigate the influence of the amplitude mode oscillation on the size and position of the gap, the three-pulse excitation scheme in Fig. 1(d) was employed. A first pump pulse (hνPump) with a fluence of FPump = 240 μJ cm−2 arriving at a variable time delay t with respect to the probe pulse is used to excite the coherent amplitude mode oscillations. The weaker population pulse is kept at the fixed delay tPop with respect to the probe pulse to transiently repopulate the unoccupied states. The subsequent probe pulse hνProbe then monitors both occupied and unoccupied bands. The much weaker fluence FPop ≪ FPump ensures minimizing the influence of the population pulse on the amplitude mode oscillation.
3.1 Coherent modulation of the CDW gap size
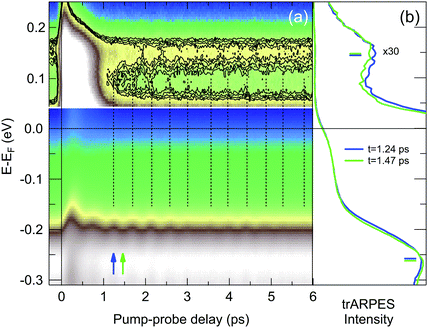
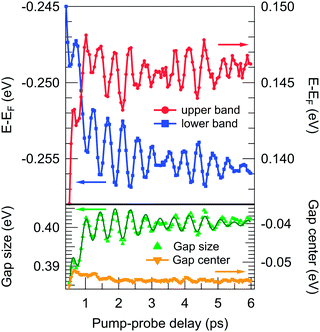
Fig. 3(a) depicts the transient three-pulse trARPES intensity as a function of pump–probe delay and energy E − EF, below and above EF, at a k-position corresponding to the normal state Fermi momentum (white arrow in Fig. 2). For better visibility, the intensity scale for energies above EF is enhanced by 30 times. After excitation at t = 0, we find the characteristic oscillations of the amplitude mode in position and intensity of the occupied peak,6,15 where the dashed lines are guides to the eye to highlight the oscillation period. In the unoccupied band, also a weak intensity modulation by the amplitude mode is observed, which is highlighted by the contour lines. The transient trARPES spectra shown in Fig. 3(b) at a maximum (blue) and a minimum (green) of the oscillations in the position of the lower band reveal a shift in the band position also in the unoccupied band, which exhibits an opposite sign with respect to the occupied band.For further analysis, the peak positions of the occupied and unoccupied band are determined by Lorentzian line fits and the results are depicted in the upper panel of Fig. 4. We clearly find oscillations of the same magnitude in the position of both bands with a frequency of f ∼ 2.2 THz, which, however, show a beating pattern with a period of t ∼ 3 ps, indicating the presence of more than one mode. Most remarkably, the oscillations are clearly anti-correlated, where a maximum in the lower band corresponds to a minimum in the upper band and vice versa. This behavior corresponds to a transient oscillation of the gap size ΔCDW = Eupper − Elower, as depicted in the lower panel (green). In contrast, the gap center Ecenter = (Eupper + Elower)/2 (yellow) shows virtually no oscillations.
This is indeed the expected behavior for the influence of the amplitude mode of the CDW order parameter, which modulates the amplitude of the complex order parameter and hence the CDW gap size (see Fig. 1(b)). The observation of the coherent oscillations of the CDW gap size as demonstrated by our experiments thus provides an unambiguous and direct proof that the oscillations previously only observed in the lower CDW band6,15 indeed correspond to amplitude mode excitations of the system.
The main frequencies of the oscillations are analyzed by fitting the transient gap size with two damped oscillators and an exponential background function, depicted as dark green line in Fig. 4. The fit, which shows a good agreement with the oscillations and in particular with the beating pattern, yields central frequencies of f1 = 2.230(6) THz (2.2 THz mode) and f2 = 1.77(2) THz (1.75 THz mode). The initial phases of both modes are found to be cosine-like, in agreement with a displacive excitation of the modes. A fast Fourier transformation (FFT) of the residual data show indications of additional frequencies around 2.6 THz and 3.5 THz, which are however too weak in amplitude to be unambiguously fitted. Both the observed frequencies and the ratio of amplitudes, A1/A2 ∼ 6 agree very well with the coherent phonon modes observed for TbTe3 with transient optical reflectivity.18
The observation of multiple frequencies that couple to the magnitude of the order parameter is remarkable, as in the mean-field description of the Peierls transition, only one specific phonon mode at the CDW wave vector q couples to the electronic degrees of freedom and shows a critical softening at the phase transition.1 In TbTe3, this mode has been identified with the 2.2 THz mode, that shows sizable softening close to the phase transition.18,19 However, this previous work also demonstrated that there exists a complex interplay between the 1.75 THz mode and 2.2 THz mode, suggesting a strong coupling between both modes§. Our results show that the amplitude of the CDW order parameter ΔCDW is modulated by both modes, demonstrating the existence of more than one amplitude mode. This can be understood from the quasi-1D nature of RTe3, which exhibits more than one phonon branch at the CDW wave vector. These additional phonon branches can also linearly couple to the modulated electronic charge density and exhibit the characteristic features of amplitude modes, as explained in the time-dependent Ginzburg-Landau model.21,22
3.2 Coherent control of the amplitude mode
The observation of both the 2.2 THz and the 1.75 THz mode in the transient oscillations of the order parameter raises the question, how far these modes are mutually coupled and influence each other or whether they independently modulate the CDW gap. The mode crossing of the two modes observed as a function of temperature in transient reflectivity measurements18 and Raman scattering19 indeed suggests a substantial coupling, especially near the crossing point of the modes. Additional insight into this coupling can be gained from time-resolved coherent control experiments. Here, a second time-delayed pump pulse is employed to control the oscillation of a coherent phonon launched by the first pump pulse. Such control of coherent phonon oscillations in the time domain has been demonstrated in a number of materials,23–27 including selective excitation of certain vibrational modes28,29 and asymmetric control schemes exploring collective dynamics in correlated material systems.30,31For the coherent control experiments, two excitation pulses hνPump1 and hνPump2 of equal fluence F ∼ 250 μJ cm−2 separated by the pump-pump delay t12 were used employing the scheme in Fig. 1(e). Here, the first pump pulse triggers the amplitude mode oscillation at t0, and the second pump pulse is used for coherent control of the oscillations, by coherently enhancing or suppressing the oscillations depending on t12. The resulting oscillations are observed by the probe pulse after the pump1-probe delay t. For each scan of t, t12 was held fix, and multiple scans for various t12 spanning a whole period of the amplitude mode were performed.
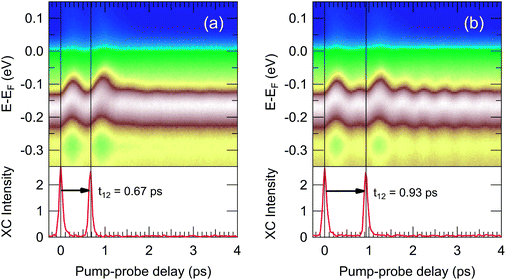
The resulting trARPES intensities of DyTe3 for a pump-pump delay of t12 = 0.67 ps and t12 = 0.93 ps are shown in Fig. 5(a) and (b), corresponding to a coherent suppression or enhancement of the amplitude mode oscillation, respectively. The cross-correlation (XC) of the two pump pulses with the probe pulse are depicted in the lower panels, showing the arrival times and equal excitation amplitudes of both pump pulses. Clearly observed is the efficient suppression of the coherent oscillation for out-of-phase excitation in Fig. 5(a), whereas the oscillation is enhanced for in-phase excitation in Fig. 5(b).
The transient peak position of the lower CDW band determined by line fits is shown for various pump-pump delays t12 in Fig. 6(a), where the arrival of the control pulse is indicated by the red markers. After the initial shift of the peak position associated with the arrival of each pump pulse, the coherent oscillations are well resolved in all cases. Traces of out-of-phase and in-phase excitation, corresponding to Fig. 5(a) and (b) are highlighted by thick orange and green lines, respectively.
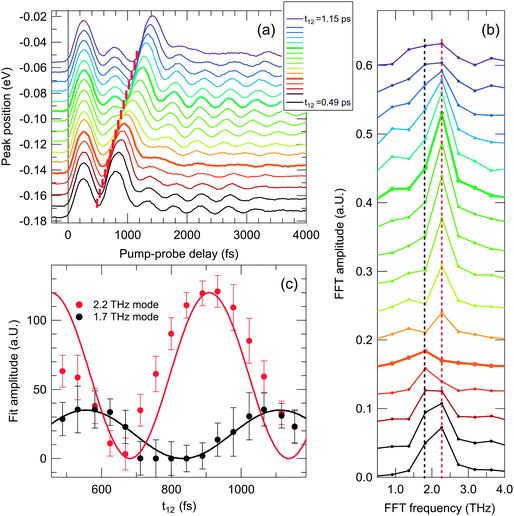 | ||
| Fig. 6 (a) Transient peak position of the lower CDW peak in DyTe3 as a function of pump–probe delay for various pump-pulse separations t12, indicated by red markers. The data corresponding to the situation in Fig. 5(a) and (b) are highlighted by thick orange and green lines, respectively. Traces are vertically offset for clarity. (b) FFT amplitudes for various t12. Positions of the 1.75 THz and 2.2 THz mode are marked with black and red vertical lines, respectively. (c) Fitted FFT amplitude of the 1.75 THz (black) and 2.2 THz (red) mode as a function of pump-pulse separation t12. Solid lines are fits to eqn (1). | ||
In order to quantify the coherent control of the amplitude mode, fast FFT traces obtained from the transient peak position after background subtraction for t > 2 ps are shown in Fig. 6(b). The position of the two modes at f = 2.2 THz and f = 1.75 THz are marked by red and black dashed lines, respectively. While both peaks are present at t12 = 0.49 ps (bottommost curve), at t12 = 0.68 ps (orange curve), the intensity of the 2.2 THz mode is almost completely suppressed, and only the weak mode at 1.75 THz remains. Similarly, at t12 = 0.93 ps, only the enhanced oscillation of the 2.2 THz mode is observed and the 1.75 THz mode is absent. A fit of two Lorentzian line shapes centered at f = 1.75 THz and f = 2.2 THz to the FFT spectra is used to determine the oscillation amplitudes, which are shown in Fig. 6(c) as a function of pump-pump delay t12 as black and red symbols, respectively.
From the response of the spectral weight of the two modes to the control pulse, information on the coupling of the two modes can be gained. Neglecting the decay of the coherent oscillations between the two pump pulses, the coherent oscillation amplitude A(t12) of independent modes can be described by25
 | (1) |
4 Discussion
The simple model captures the general behavior of the oscillation amplitudes as a function of t12 of both modes remarkably well and especially perfectly reproduces their different periods with t12. Slight deviations in the extracted amplitudes from the model could be explained due to the phase shift occurring to the oscillations when crossing the resonance condition, which leads to a deviation of the FFT spectra from Lorentzian line shapes, or nonlinearities in the fluence dependence of the oscillation amplitudes, which could result in a saturation of the oscillation amplitude. The good agreement of the coherent oscillation amplitude control to the simple model of independent oscillators indicates weak coupling of the different amplitude modes. Especially the fact that we can selectively control the amplitude of each mode, in particular that we can completely suppress the 2.2 THz mode with almost maximal amplitude of the 1.75 THz mode at t12 = 0.68 ps, and the absence of the 1.75 THz mode at t12 ≈ 0.8 ps, underlines the independent nature of the two amplitude modes in the coherent control experiment.The observation of weak coupling of the amplitude modes in the photoexcited phase is surprising, as both modes couple to the same electronic order parameter and modulate similar coordinates of the same atoms.16 Our observation is in contrast to temperature-dependent studies of the amplitude modes in RTe3 observed by time-resolved optical spectroscopy18 and Raman spectroscopy.19 These works demonstrated a mixing and avoided crossing of the two modes at 1.75 THz and 2.2 THz due to strong coupling during the softening of the modes with increasing temperature. In the time-dependent Ginzburg-Landau model this behavior arises due to the coupling of the lattice degrees of freedoms, described as structural order parameters, to the electronic part of the order parameter, which leads to an indirect coupling of the different phonon modes in the system.22 Thus, the observation of weakly coupled amplitude modes in the coherent control experiments suggests a transient decoupling of the lattice degrees of freedom in the photoexcited state, which is not observed in the static case. A more complete description of the transient order parameter dynamics would require a proper description in the framework of the time-dependent Ginzburg-Landau model,22 which is however beyond the scope of the current manuscript.
5 Summary
In summary, using a three-pulse pump–probe scheme in time- and angle-resolved photoemission experiments we demonstrated the effect of the amplitude mode oscillations on the electronic band structure in the prototypical charge-density wave compounds RT33. We observe coherent oscillations in both lower and upper CDW band with opposite phases, which result in a modulation of the CDW energy gap. The observation of two dominating frequencies modulating the CDW order parameter demonstrates the existence of more than one collective amplitude mode, which is in contrast to the simple Peierls model. This can be understood from the quasi-1D nature of RTe3, which allows more than one phonon branch at the CDW wave vector q to couple to the order parameter. Coherent control experiments of the two amplitude modes, which are strongly coupled in equilibrium, allow independent control of the modes and demonstrate a transient decoupling of the amplitude modes in the photoexcited state.Acknowledgements
The authors acknowledge financial support from the Deutsche Forschungsgemeinschaft through BO 1823/2 and FOR 1700, the Mercator Research Center Ruhr through Grant No. PR-2011-0003, and the US Department of Energy, Office of Basic Energy Sciences under contract DE-AC02-76SF00515.References
- G. Grüner, Density Waves in Solids, Addison-Wesley, 1994, vol. 89 Search PubMed.
- R. E. Peierls, Quantum Theory of Solids, Oxford University Press, New York, 1955 Search PubMed.
- Dynamics at Solid State Surfaces and Interfaces, Vol. 1, ed. U. Bovensiepen, H. Petek and M. Wolf, Wiley-VCH Weinheim, Germany, 2010 Search PubMed.
- S. Hellmann, T. Rohwer, M. Kalläne, K. Hanff, C. Sohrt, A. Stange, A. Carr, M. Murnane, H. Kapteyn, L. Kipp, M. Bauer and K. Rossnagel, Nat. Commun., 2012, 3, 1069 CrossRef CAS PubMed.
- L. Perfetti, P. A. Loukakos, M. Lisowski, U. Bovensiepen, H. Berger, S. Biermann, P. S. Cornaglia, A. Georges and M. Wolf, Phys. Rev. Lett., 2006, 97, 067402 CrossRef CAS.
- F. Schmitt, P. S. Kirchmann, U. Bovensiepen, R. G. Moore, L. Rettig, M. Krenz, J. H. Chu, N. Ru, L. Perfetti, D. H. Lu, M. Wolf, I. R. Fisher and Z. X. Shen, Science, 2008, 321, 1649–1652 CrossRef CAS PubMed.
- T. Rohwer, S. Hellmann, M. Wiesenmayer, C. Sohrt, A. Stange, B. Slomski, A. Carr, Y. Liu, L. M. Avila, M. Kalläne, S. Mathias, L. Kipp, K. Rossnagel and M. Bauer, Nature, 2011, 471, 490 CrossRef CAS PubMed.
- J. C. Petersen, S. Kaiser, N. Dean, A. Simoncig, H. Y. Liu, A. L. Cavalieri, C. Cacho, I. C. E. Turcu, E. Springate, F. Frassetto, L. Poletto, S. S. Dhesi, H. Berger and A. Cavalleri, Phys. Rev. Lett., 2011, 107, 177402 CrossRef CAS.
- E. DiMasi, M. C. Aronson, J. F. Mansfield, B. Foran and S. Lee, Phys. Rev. B, 1995, 52, 14516–14525 CrossRef CAS.
- G.-H. Gweon, J. D. Denlinger, J. A. Clack, J. W. Allen, C. G. Olson, E. DiMasi, M. C. Aronson, B. Foran and S. Lee, Phys. Rev. Lett., 1998, 81, 886–889 CrossRef CAS.
- V. Brouet, W. L. Yang, X. J. Zhou, Z. Hussain, N. Ru, K. Y. Shin, I. R. Fisher and Z.-X. Shen, Phys. Rev. Lett., 2004, 93, 126405 CrossRef CAS.
- V. Brouet, W. L. Yang, X. J. Zhou, Z. Hussain, R. G. Moore, R. He, D. H. Lu, Z.-X. Shen, J. Laverock, S. B. Dugdale, N. Ru and I. R. Fisher, Phys. Rev. B: Condens. Matter Mater. Phys., 2008, 77, 235104 CrossRef.
- R. G. Moore, V. Brouet, R. He, D. H. Lu, N. Ru, J.-H. Chu, I. R. Fisher and Z.-X. Shen, Phys. Rev. B: Condens. Matter Mater. Phys., 2010, 81, 073102 CrossRef.
- N. Ru, C. L. Condron, G. Y. Margulis, K. Y. Shin, J. Laverock, S. B. Dugdale, M. F. Toney and I. R. Fisher, Phys. Rev. B: Condens. Matter Mater. Phys., 2008, 77, 035114 CrossRef.
- F. Schmitt, P. S. Kirchmann, U. Bovensiepen, R. G. Moore, J.-H. Chu, D. H. Lu, L. Rettig, M. Wolf, I. R. Fisher and Z.-X. Shen, New J. Phys., 2011, 13, 063022 CrossRef.
- M. Lavagnini, M. Baldini, A. Sacchetti, D. Di Castro, B. Delley, R. Monnier, J.-H. Chu, N. Ru, I. R. Fisher, P. Postorino and L. Degiorgi, Phys. Rev. B: Condens. Matter Mater. Phys., 2008, 78, 201101 CrossRef.
- M. Lisowski, P. Loukakos, U. Bovensiepen, J. Stähler, C. Gahl and M. Wolf, Appl. Phys. A: Mater. Sci. Process., 2004, 78, 165–176 CrossRef CAS PubMed.
- R. V. Yusupov, T. Mertelj, J.-H. Chu, I. R. Fisher and D. Mihailovic, Phys. Rev. Lett., 2008, 101, 246402 CrossRef CAS.
- M. Lavagnini, H.-M. Eiter, L. Tassini, B. Muschler, R. Hackl, R. Monnier, J.-H. Chu, I. R. Fisher and L. Degiorgi, Phys. Rev. B: Condens. Matter Mater. Phys., 2010, 81, 081101 CrossRef.
- A. Banerjee, Y. Feng, D. M. Silevitch, J. Wang, J. C. Lang, H.-H. Kuo, I. R. Fisher and T. F. Rosenbaum, Phys. Rev. B: Condens. Matter Mater. Phys., 2013, 87, 155131 CrossRef.
- H. Schäfer, V. V. Kabanov, M. Beyer, K. Biljakovic and J. Demsar, Phys. Rev. Lett., 2010, 105, 066402 CrossRef.
- H. Schäfer, V. V. Kabanov and J. Demsar, Phys. Rev. B: Condens. Matter Mater. Phys., 2014, 89, 045106 CrossRef.
- T. Dekorsy, W. Kütt, T. Pfeifer and H. Kurz, Europhys. Lett., 1993, 23, 223 CrossRef.
- M. Hase, K. Mizoguchi, H. Harima, S. Nakashima, M. Tani, K. Sakai and M. Hangyo, Appl. Phys. Lett., 1996, 69, 2474 CrossRef CAS PubMed.
- T. Onozaki, Y. Toda, S. Tanda and R. Morita, Jpn. J. Appl. Phys., 2007, 46, 870–872 CrossRef CAS.
- O. V. Misochko, R. Lu, M. Hase and M. Kitajima, J. Exp. Theor. Phys., 2007, 104, 245–253 CrossRef CAS.
- S. Wall, D. Wegkamp, L. Foglia, K. Appavoo, J. Nag, R. Haglund, J. Stähler and M. Wolf, Nat. Commun., 2012, 3, 721 CrossRef CAS PubMed.
- H. Takahashi, K. Kato, H. Nakano, M. Kitajima, K. Ohmori and K. G. Nakamura, Solid State Commun., 2009, 149, 1955–1957 CrossRef CAS PubMed.
- Y. Okano, H. Katsuki, Y. Nakagawa, H. Takahashi, K. G. Nakamura and K. Ohmori, Faraday Discuss., 2011, 153, 375–382 RSC.
- R. Yusupov, T. Mertelj, V. V. Kabanov, S. Brazovskii, P. Kusar, J.-H. Chu, I. R. Fisher and D. Mihailovic, Nat. Phys., 2010, 6, 681–684 CrossRef CAS.
- P. Kusar, T. Mertelj, V. V. Kabanov, J.-H. Chu, I. R. Fisher, H. Berger, L. Forró and D. Mihailovic, Phys. Rev. B: Condens. Matter Mater. Phys., 2011, 83, 035104 CrossRef.
Footnotes |
| † Current address: Swiss Light Source, Paul Scherrer Institut, 5232 Villigen PSI, Switzerland. |
| ‡ Current address: Department of Physics, UC Berkeley, USA. |
| § An assignment of the 1.75 THz and 2.2 THz modes to two different (perpendicular) CDW vectors appears unlikely as both modes are observed far above a potential second low temperature CDW transition20 and modulate the previously observed k-dependent CDW gap in TbTe3 along c*. |
| This journal is © The Royal Society of Chemistry 2014 |

