 Open Access Article
Creative Commons Attribution 3.0 Unported Licence
Nanoparticle emissions from traditional pottery manufacturing
Aristeidis
Voliotis
a,
Spyros
Bezantakos
ab,
Maria
Giamarelou
a,
Marco
Valenti
b,
Prashant
Kumar
cd and
George
Biskos
*ab
aDepartment of Environment, University of the Aegean, Mytilene 81100, Greece. E-mail: biskos@aegean.gr
bFaculty of Applied Sciences, Delft University of Technology, Delft 2628-BL, The Netherlands. E-mail: g.biskos@tudelft.nl
cDepartment of Civil and Environmental Engineering, Faculty of Engineering and Physical Sciences (FEPS), University of Surrey, Guildford GU2 7XH, UK
dEnvironmental Flow (EnFlo) Research Centre, FEPS, University of Surrey, Guildford GU2 7XH, UK
First published on 19th March 2014
Abstract
Traditional pottery manufacturing involves firing of the ceramics in kilns, a process that leads to high concentrations of airborne particles that are harmful to human health. In order to assess the associated exposure levels and the involved risks, here, for the first time, we investigate the size, the concentration and the elemental composition of the particles emitted during the different stages of the ceramic firing process. Number size distributions of the emitted particles, having diameters in the range from 10 nm to 20 μm, were measured in a traditional small-sized pottery studio using a Scanning Mobility Particle Sizer (SMPS) and an Optical Particle Counter (OPC). The measurements showed dominance of the nanoparticle mode (i.e., particles smaller than 100 nm) when the kiln reached temperatures above 600 °C. The mean size of the particles ranged from 30 to 70 nm and their peak number concentration was 6.5 × 105 cm−3 during the first stage of the firing process where the ceramics were unpainted and unglazed. During the second stage of the firing process, where the ceramics were painted and glazed, the mean particle size ranged from 15 to 40 nm and their number concentration peaked at 1.2 × 106 cm−3. Elemental analysis of individual particles collected during the two firing stages and studied by Energy-Dispersive X-ray (EDX) spectroscopy showed that the emitted nanoparticles contain significant amounts of lead. These findings provide new information for understanding the health impacts of traditional pottery manufacturing, and underline the need for adopting adequate measures to control nanoparticle emissions at the source.
Environmental impactTraditional manufacturing of ceramic tableware and ornamental ware is a widely dispersed occupation, which in many countries is linked to local tradition. During the manufacturing process, the ceramics are fired before and after paints and glazing are applied on their surface. In both cases, the process can lead to high concentrations of airborne nanoparticles that can be harmful to human health. Here, for the first time, we provide systematic measurements of the size distributions and the elemental composition of the particles emitted during the different stages of the ceramic firing process. |
Introduction
Exposure to airborne nanoparticles (i.e., particles having diameters smaller than 100 nm) produced by human activities can have significant adverse effects on human health.1–3 This is supported by an increasing number of epidemiological studies that show a strong correlation of human exposure to airborne nanoparticles with respiratory and cardiovascular diseases.4–7 Despite the fact that the mechanisms causing these diseases are not yet fully understood,8 it is commonly agreed that the smaller particles have stronger effects mainly because (1) they can travel deeper into the respiratory system, and (2) they are typically more toxic compared to their large-particle counterparts.9–11A wide range of industrial and manufacturing processes involving combustion and/or high temperatures can produce significant concentrations of airborne nanoparticles containing toxic elements and compounds that pose a threat to human health.12–17 For instance, industrial processes such as metal casting or welding emit hazardous particles that contain heavy metals into the breathing air.18–20 A number of manufacturing processes, such as machining of materials, wood processing and asphalt roofing, also have high temperature stages that emit a high number of toxic particles.21–23
Pottery is another industry where high temperature processes are required. Manufacturing of ceramic tableware and ornamental ware is a widely dispersed occupation, which in many countries is linked to local tradition. The turnover of this industry in the EU alone was €1.8 billion in 2006, occupying ∼31![[thin space (1/6-em)]](https://www.rsc.org/images/entities/char_2009.gif) 000 workers in Small and Medium Enterprises (SMEs).24 The respective figures in the US in 2007 were $2.8 billion and ∼21
000 workers in Small and Medium Enterprises (SMEs).24 The respective figures in the US in 2007 were $2.8 billion and ∼21![[thin space (1/6-em)]](https://www.rsc.org/images/entities/char_2009.gif) 000 workers.25
000 workers.25
Traditional pottery manufacturing involves a two stage firing process for producing the final products. At the first stage, referred to as bisque firing, the ceramics are gradually heated in order to stabilize their shape and structure. At the second stage, referred to as glaze firing, the ceramics are fired again after paints and glazing are applied on their surface. This stage is needed in order to stabilize the surface artwork and to make the pots watertight and durable. In both firing stages, the ceramics are heated at temperatures that reach up to ∼1000 °C for a period of 8 to 16 h.
Evidence accumulated since the late 80s suggests that hazardous airborne contaminants are emitted from the firing of ceramics.26–28 Hirtle et al. (1998)29 have reported that significant amounts of metals are present in the total suspended particulate matter emitted during the firing of ceramics. These measurements can explain the findings of Hibbert et al. (1999)30 and later of Jones et al. (2013)31 who showed that significant amounts of heavy metals are present in the blood of artisanal pottery workers. Albeit the importance of these findings, to the best of our knowledge, no information on the size distribution or the size-resolved composition of the emitted particles is available.
In order to fill this gap, here we present systematic characterisation of the particles emitted during the manufacturing of ceramics in a traditional small-sized pottery studio. The size distributions of the particles (having diameters from 10 nm to 20 μm) emitted by the kiln during the two different firing stages were measured by electrical mobility and optical techniques. In addition, the elemental composition of particles collected during the two firing stages was determined by Energy-Dispersive X-ray (EDX) spectroscopy.
Experimental
Experimental setup and procedure
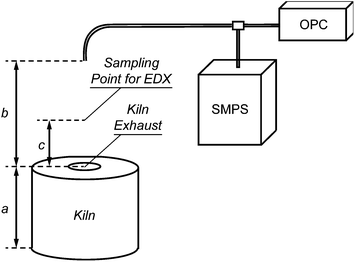
The measurements were conducted over a period of one month in a traditional small-sized pottery studio. The studio occupies two and occasionally three workers, and produces ceramic tableware and ornamental ware pieces. The raw materials used for the manufacturing of the ceramics were clay, glaze and pigments. Clay and glaze mainly consisted of kaolin and oxides of silicon and iron, whereas the pigments contained oxides of aluminium, chromium, cobalt, copper, iron, lead, nickel and tin.The studio was equipped with an electrical kiln (Skutt, Model BC 1277) that was fired almost once every other day. The kiln had a cylindrical shape with a volume of 0.29 m3, and a 4 cm hole located at the top that served as an exhaust. During the firings, the temperature of the kiln was gradually increased from ambient to 980 °C over a period of 11 h. After this period the kiln was switched off and its door remained closed until it reached room temperature. In all our measurements the kiln was loaded with the same number of ceramics.
Instrumentation
The size distributions of the particles emitted from the exhaust during the firings were measured by a Scanning Mobility Particle Sizer (SMPS; TSI Model 3034) and an Optical Particle Counter (OPC; Grimm Model 1.108). The SMPS measured the mobility diameter dm of the particles having sizes from 10 to 487 nm, whereas the OPC measured their optical diameter dp in the range of 0.3 to 20 μm. The sample flow rate and the sampling time interval of the SMPS was 1.0 Litre per minute (Lpm) and 3 min, respectively. The respective values for the OPC were 1.2 Lpm and 1 min. Both instruments sampled particles emitted by the kiln through a 6 m long copper tube (ID = 6.35 mm), the inlet of which was at 1.7 m above ground level (breathing height) or 1 m above the exhaust of the kiln (cf.Fig. 1). The resulting distance of 0.7 m between the inlet and the exhaust of the kiln was necessary for dilution of the plume produced during the firing and growth of the resulting particles to a stable size. The two instruments sampled continuously over the period of our study, providing measurements also when the kiln was not operational.The SMPS consisted of a cyclone, a 85Kr bipolar neutralizer,32 a Differential Mobility Analyzer (DMA),33 and a Condensation Particle Counter (CPC).34 The sampled air was first passed through the cyclone that removed particles larger than 500 nm. The smaller particles that remained in the sample stream were passed through the 85Kr neutralizer to bring the particle charge distribution into Boltzmann equilibrium, and then through the DMA where they were classified based on their electrical mobility. The concentration of the monodisperse particles downstream of the DMA was then measured by the CPC. By scanning the operating conditions of the DMA (i.e., the strength of the electric field used to classify the particles), particles having different electrical mobilities, and therefore sizes, were directed to the CPC. The time needed to scan the electric field of the DMA, and thus to measure the size distribution of the particles having diameters from 10 to 487 nm in our experiments was 3 min. The Aerosol Instrument Manager software (AIM, TSI version 6.0) was used to run the SMPS, as well as to record and invert the raw data. The SPMS was calibrated before the measurements, resulting in a precision of 3–3.5% in particle diameter and 10% in number concentration.
The OPC measured the light scattered by the particles in order to determine their size and concentration. The instrument consisted of a laser diode (λ = 780 nm), and a photodetector.35,36 In brief, the sample stream was drawn through a perpendicular condensed light beam emitted by the laser source, and the light scattered by individual particles was measured by a detector. The number concentration of the particles was then estimated by the count rate of the pulses, whereas the pulse height was used to determine their size. The particles were classified into 15 channels according to their optical diameter.37
Particle collection and elemental analysis
The elemental composition of the particles emitted during both firing stages was determined by Energy-Dispersive X-ray (EDX) spectroscopy. The EDX measurements were performed on individual particles collected on Quantifoil® copper microgrids covered with a carbon-polymer support. The grids were placed 20 cm above the kiln exhaust (cf.Fig. 1) during the entire firing process so that the emitted particles were deposited on them by diffusion and thermophoresis. A total of three samples were collected for each of the two firing stages.The EDX spectra were obtained with an Analytical Scanning Electron Microscope (ASEM; JEOL Model JSM-6010LA). The samples were first inspected with a 20 kV beam having a diameter of 20 nm. Subsequently, EDX spectra from several individual nanoparticles were obtained using a beam that was 70 nm in diameter. EDX spectra were also obtained directly from the microgrid surface in order to quantify and subtract the contribution of the grid to the measurements.
Results and discussion
Particle number concentrations
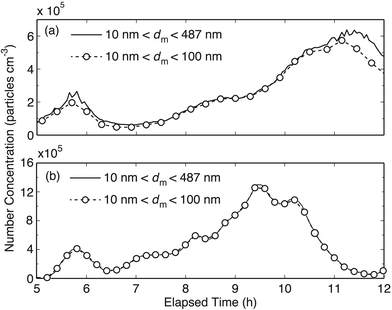
Fig. 2a and b show time series of the particle number concentrations (PNCs) emitted during bisque and glaze firing, respectively. Two time series are provided for each firing process: one corresponding to particles having diameters from 10 to 100 nm (dashed lines with circles), and one to particles from 10 to 487 nm (solid lines). When the time series overlap, all the particles have diameters <100 nm, whereas when they deviate from one another, a fraction of the emitted particles have diameters >100 nm. In the first four hours of both firing processes the PNCs were very similar to those of the background (data not shown). Only after the 5th hour, when the kiln reached temperatures of ∼600 °C, did the PNC start to increase and exhibit a first peak (cf.Fig. 2a and b). The highest PNC during bisque firing, observed after the 11th hour of the firing process when the kiln temperature was between 950 and 980 °C, was 6.5 × 105 cm−3. During glaze firing, the highest PNCs were about two times higher (12 × 105 cm−3) than those noted during bisque firing. The highest concentration during glaze firing was reached after the 9th hour when the kiln temperature was between 780 and 820 °C.Table 1 shows the average and the maximum PNCs measured during bisque and glaze firing processes, in comparison with measurements when the kiln was not operational (i.e., background particle concentration). Compared to the background, the PNCs during bisque firing was ∼8 times higher (1.6 × 105 cm−3), and during glaze firing ∼12 times higher (2.5 × 105 cm−3). The majority of the particles (85–90%) during bisque firing had diameters <100 nm, whereas all the emitted particles during glaze firing had diameters in the sub-100 nm range.
| Total | d p < 100 nm | d p > 100 nm | ||||
|---|---|---|---|---|---|---|
| Average (× 105) | Max. (× 105) | Average (× 105) | Max. (× 105) | Average (× 103) | Max. (× 104) | |
| Bisque firing | 1.6 | 6.5 | 1.4 | 5.8 | 16.0 | 10.0 |
| Glaze firing | 2.5 | 12.0 | 2.5 | 12.0 | 3.0 | 1.8 |
| Background | 0.2 | 0.9 | 0.09 | 0.8 | 3.0 | 1.3 |
Fig. 3 shows PNCs of particles having diameters >300 nm as measured by the OPC. For these particles, the concentration was higher during bisque firing (average value of 1.6 × 102 cm−3) than during glaze firing (average value of 70 cm−3). Considering that the average concentration of the background particles in this size range was ∼65 cm−3, the mean increase during glaze firing was in fact negligible. The concentration of the super-300 nm particles started to increase after the 6th hour in both firing processes, exhibiting a peak after the 11th hour (peak value of 4.5 × 102 cm−3) during bisque firing and after the 9th hour (peak value of 1.6 × 102 cm−3) during glaze firing. In both cases the evolution of the PNCs measured by the OPC coincided with that measured by the SMPS (cf.Fig. 2).
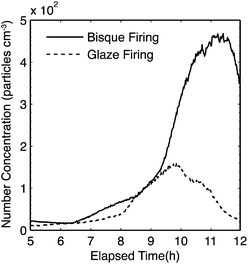 | ||
| Fig. 3 Particle number concentration measured by OPC during bisque (solid line) and glaze firing (dashed line). | ||
Particle size distributions
Fig. 4 shows the evolution of the particle size distributions measured by the SMPS during (a) bisque and (b) glaze firing, respectively. In both cases, the size distributions were very similar to those of the background during the first five hours (data not shown). After the 5th hour of the bisque firing process, a population of particles having diameters from 40 to 100 nm appeared for approximately an hour, after which the particle concentration dropped back to background levels (cf.Fig. 4a). The size (and concentration) of the emitted particles started increasing again after the 8th hour, reaching a highest value of 70 nm after the 11th hour and until the end of the firing process. The increase in the mean particle size during the bisque firing follows well with the increase of the temperature in the kiln from ∼600 to 980 °C, causing a progressively increasing amount of material being evaporated from the ceramics. These vapours subsequently nucleate to form nanoparticles upon cooling in the exhaust stream during the course of the firing process.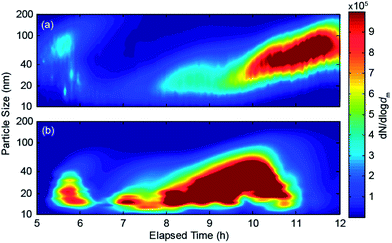 | ||
| Fig. 4 Evolution of the size distributions of the particles having diameters from 10 to 200 nm emitted by the kiln during (a) bisque and (b) glaze firing. | ||
The evolution of the particle size distributions during glaze firing (Fig. 4b) exhibits a different pattern. In this case, the first peak in the concentration of particles having diameters from 15 to 30 nm is observed for ∼30 minutes after the 5th hour of the process. The size and concentration of the particles started increasing again after the 7th hour, reaching highest values (∼70 nm and 12 × 105 cm−3) 9–10 hours after the initiation of the process. Interestingly, both the concentration and the size of the particles started decreasing significantly after the 10th hour of the process, reaching background levels, despite the fact that the temperature of the kiln kept increasing. An explanation of this decrease is that most of the material forming the particles during glaze firing is coming from the paints and the glaze applied on the surface of the ceramics, both of which are in small amounts and therefore get depleted before the end of the firing process.
Fig. 5 shows the evolution of the particle size distributions measured by the OPC (i.e., particles >300 nm in diameter) during bisque and glaze firing. In both cases, the concentration and the size of the emitted particles in this size range started to increase after the 8th hour of the firing process. In bisque firing the particles were produced until the end (as also observed in the SMPS measurements; cf.Fig. 2 and 4), whereas in glaze firing until the 10th hour of the firing process. Although in both cases the size of the emitted particles had diameters smaller than 500 nm, the particles emitted by glaze firing were significantly smaller.
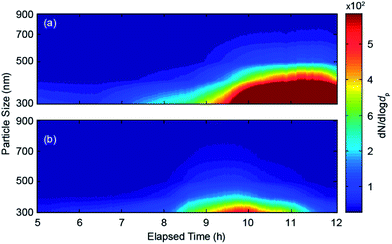 | ||
| Fig. 5 Evolution of the size distributions of the particles having diameters from 300 to 900 nm emitted by the kiln during (a) bisque and (b) glaze firing. | ||
The differences in the temporal evolution and the individual size distribution observed during the two firing processes can be explained by differences in the composition of the fumes produced in each case. During bisque firing, where only unpainted/unglazed ceramics are inserted into the kiln, the most dominant source of vapours leading to particle formation is the clay. During glaze firing on the other hand, the most dominant sources are the compounds of the glaze and the pigments. Considering that the number of ceramics in the kiln is the same in both firings but the amount of paints/glazing is significantly smaller compared to that of the clay, the systematic difference in the size of the emitted particles between the two stages can also be attributed to the different sources of the vapours.
Elemental analysis
The EDX spectra of nanoparticles collected during bisque and glaze firing are shown in Fig. 6a and b, respectively. The peaks of the spectra corresponding to C, O and Cu are characteristic of the type of microgrids employed. If we exclude those, the rest of the peaks indicate that in both firing stages the particles contain significant amounts of Si, resulting from the clay and/or the glazing. A peak corresponding to Pb, which originates from the pigments applied on the ceramics, was always observed on the particles collected during glaze firing. These samples also exhibited higher relative peaks of Cu and C, which apart from the microgrid could also originate from the pigments and the glazing material, respectively.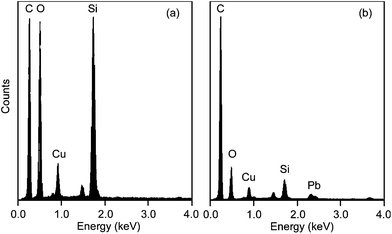 | ||
| Fig. 6 EDX spectra on individual particles collected during the two firing stages: (a) bisque and (b) glaze firing. | ||
Conclusions
The size distribution and the elemental composition of particles emitted by the kiln of a traditional small-sized pottery studio during the firing process of the ceramics were measured systematically. Significant differences in the concentration and size distributions were observed when the fired ceramics were painted/glazed (glaze firing) or not (bisque firing). The average PNC during bisque firing was 1.6 × 105 cm−3, whereas the respective value during glaze firing was 2.5 × 105 cm−3. The respective concentrations of particles having diameters smaller than 100 nm were 1.4 × 10⁵ and 2.5 × 105 cm−3. Considering that the average PNC of background nanoparticles in the studio was ca. 9 × 103 cm−3, both firing processes increased their concentration by more than an order of magnitude. The mean size of the nanoparticles varied from 30 to 70 nm during bisque firing and from 15 to 40 nm during glaze firing, indicating that the composition of the fumes leading to new particle formation is different in each case.The elemental composition of the particles collected during both firing stages showed that they consisted mainly of Si, which is emitted by the clay. Particles collected during glaze firing also contained significant amounts of Pb, which together with a fraction of Cu and possibly C observed in all the samples can be attributed to the materials used in the pigments and the glazing applied on the surface of the ceramics. The results from this study are especially important for understanding the systematic exposure of potters and the incidental exposure of the public to airborne nanoparticles emitted from the traditional manufacturing process of ceramics.
Acknowledgements
AV thanks Ms. Olessia Marinova for providing access to her pottery studio. MG acknowledges funding of the Heracleitus II programme by the EU (ESF) and Greece (NSRF).References
- C. Chang, J. Autoimmun., 2010, 34, J234–J246 CrossRef CAS PubMed.
- W. G. Kreyling, M. Semmler-Behnke and W. Moller, J. Nanopart. Res., 2006, 8, 543–562 CrossRef CAS.
- A. Seaton, L. Tran, R. Aitken and K. Donaldson, J. R. Soc., Interface, 2010, 7, S119–S129 CrossRef CAS PubMed.
- J. A. Araujo, B. Barajas, M. Kleinman, X. P. Wang, B. J. Bennett, K. W. Gong, M. Navab, J. Harkema, C. Sioutas, A. J. Lusis and A. E. Nel, Circ. Res., 2008, 102, 589–596 CrossRef CAS PubMed.
- F. Frostier, V. Belled, A. Faustino, M. Stafoggia, G. Cattani and A. Marconi, Epidemiology, 2007, 18, S112–S112 CrossRef PubMed.
- A. Ibald-Mulli, H. E. Wichmann, W. Kreyling and A. Peters, J. Aerosol Med., 2002, 15, 189–201 CrossRef CAS PubMed.
- A. Peters, H. E. Wichmann, T. Tuch, J. Heinrich and J. Heyder, Am. J. Respir. Crit. Care Med., 1997, 155, 1376–1383 CrossRef CAS PubMed.
- M. R. Heal, P. Kumar and R. M. Harrison, Chem. Soc. Rev., 2012, 41, 6606–6630 RSC.
- A. Nel, T. Xia, L. Madler and N. Li, Science, 2006, 311, 622–627 CrossRef CAS PubMed.
- G. Oberdorster, Philos. Trans. R. Soc., A, 2000, 358, 2719–2739 CrossRef CAS.
- O. Schmid, W. Moller, M. Semmler-Behnke, G. A. Ferron, E. Karg, J. Lipka, H. Schulz, W. G. Kreyling and T. Stoeger, Biomarkers, 2009, 14, 67–73 CrossRef CAS PubMed.
- D. H. Brouwer, J. H. J. Gijsbers and M. W. M. Lurvink, Ann. Occup. Hyg., 2004, 48, 439–453 CrossRef CAS PubMed.
- E. Demou, P. Peter and S. Hellweg, Ann. Occup. Hyg., 2008, 52, 695–706 CrossRef PubMed.
- A. Miller, P. L. Drake, P. Hintz and M. Habjan, Ann. Occup. Hyg., 2010, 54, 504–513 CrossRef CAS PubMed.
- P. van Broekhuizen, F. van Broekhuizen, R. Cornelissen and L. Reijnders, J. Nanopart. Res., 2012, 14, 1–25 Search PubMed.
- J. H. Vincent and C. F. Clement, Philos. Trans. R. Soc., A, 2000, 358, 2673–2682 CrossRef CAS.
- D. Wake, D. Mark and C. Northage, Ann. Occup. Hyg., 2002, 46, 235–238 CrossRef.
- M. H. Lee, W. J. McClellan, J. Candela, D. Andrews and P. Biswas, J. Nanopart. Res., 2007, 9, 127–136 CrossRef CAS.
- M. Lehnert, B. Pesch, A. Lotz, J. Pelzer, B. Kendzia, K. Gawrych, E. Heinze, R. Van Gelder, E. Punkenburg, T. Weiss, M. Mattenklott, J. U. Hahn, C. Mohlmann, M. Berges, A. Hartwig, T. Bruning and W. S. Grp, Ann. Occup. Hyg., 2012, 56, 557–567 CAS.
- F. E. Pfefferkorn, D. Bello, G. Haddad, J. Y. Park, M. Powell, J. McCarthy, K. L. Bunker, A. Fehrenbacher, Y. Jeon, M. A. Virji, G. Gruetzmacher and M. D. Hoover, Ann. Occup. Hyg., 2010, 54, 486–503 CrossRef CAS PubMed.
- D. Bello, B. Wardle, N. Yamamoto, R. Guzman deVilloria, E. Garcia, A. Hart, K. Ahn, M. Ellenbecker and M. Hallock, J. Nanopart. Res., 2009, 11, 231–249 CrossRef CAS.
- H. Ikegiwa and S. Harima, Mokuzai Gakkaishi, 1999, 45, 324–327 Search PubMed.
- D. Trumbore, A. Jankousky, E. L. Hockman, R. Sanders, J. Calkin, S. Szczepanik and R. Owens, Environ. Prog., 2005, 24, 268–278 CrossRef CAS.
- ECORYS Nederland BV, FWC Sector Competitiveness Studies - Competitiveness of the Ceramics Sector, European Commission, The Netherlands, 2008 Search PubMed.
- US Department of Commerce, Statistics of U.S. Businesses, 2010, available at http://www.census.gov/econ/subs/ (last accesssed Nov. 2013) Search PubMed.
- C. A. Bache, D. J. Lisk, J. M. Scarlett and L. G. Carbone, J. Toxicol. Environ. Health, 1991, 34, 423–431 CrossRef CAS PubMed.
- L. J. Fuortes, Postgrad. Med., 1989, 85, 133–136 CAS.
- J. Cooreman, F. Neukirch, M. Korobaeff and R. Pariente, Arch. Environ. Health, 1994, 49, 459–464 CrossRef PubMed.
- B. Hirtle, K. Teschke, C. v. Netten and M. Brauer, Am. Ind. Hyg. Assoc. J., 1998, 59, 706–714 CrossRef CAS PubMed.
- R. Hibbert, Z. P. Bai, J. Navia, D. M. Kammen and J. F. Zhang, J. Exposure Anal. Environ. Epidemiol., 1999, 9, 343–351 CAS.
- E. D. Jones, M. C. Pérez, B. Ericson, D. E. Sánchez, S. Gualtero, A. Smith-Jones and J. Caravanos, Journal of Health and Pollution, 2013, 3, 23–29 Search PubMed.
- B. Y. H. Liu and D. Y. H. Pui, J. Aerosol Sci., 1974, 5, 465–472 CrossRef.
- E. O. Knutson and K. T. Whitby, J. Aerosol Sci., 1975, 6, 443–451 CrossRef.
- J. K. Agarwal and G. J. Sem, J. Aerosol Sci., 1980, 11, 343–357 CrossRef CAS.
- J. Burkat, G. Steiner, H. Moshammer, M. Neuberger and R. Hitzenberger, J. Aerosol Sci., 2010, 41, 953–962 CrossRef PubMed.
- M. Heim, B. J. Mullins, H. Umhauer and G. Kasper, J. Aerosol Sci., 2008, 39, 1019–1031 CrossRef CAS PubMed.
- W. W. Szymanski, A. Nagy and A. Czitrovszky, J. Quant. Spectrosc. Radiat. Transfer, 2009, 110, 918–929 CrossRef CAS PubMed.
| This journal is © The Royal Society of Chemistry 2014 |

