Full ceramic micro solid oxide fuel cells: towards more reliable MEMS power generators operating at high temperatures†
I.
Garbayo
*ab,
D.
Pla
a,
A.
Morata
a,
L.
Fonseca
b,
N.
Sabaté
b and
A.
Tarancón
*a
aIREC, Catalonia Institute for Energy Research, Dept of Advanced Materials for Energy Applications. Jardí de les Dones de Negre 1, 2nd Floor, 08930, Sant Adrià del Besòs, Barcelona, Spain. E-mail: atarancon@irec.cat; inigo.garbayo@gmail.com
bIMB-CNM (CSIC), Institute of Microelectronics of Barcelona, National Microelectronics Center, CSIC. Campus UAB, 08193 Bellaterra, Barcelona, Spain
First published on 24th July 2014
Abstract
Batteries, with a limited capacity, have dominated the power supply of portable devices for decades. Recently, the emergence of new types of highly efficient miniaturized power generators like micro fuel cells has opened up alternatives for continuous operation on the basis of unlimited fuel feeding. This work addresses for the first time the development of a full ceramic micro solid oxide fuel cell fabricated in silicon technology. This full-ceramic device represents a new generation of miniaturized power generators able to operate at high temperatures, and therefore able to work with a hydrocarbon fuel supply. Dense yttria-stabilized zirconia free-standing large-area membranes on micromachined silicon were used as the electrolyte. Thin-film porous electrodes of La0.6Sr0.4CoO3−δ and gadolinia-doped ceria were employed as cathode and anode materials, respectively. The electrochemical performance of all the components was evaluated by partial characterization using symmetrical cells, yielding excellent performance for the electrolyte (area specific resistance of 0.15 Ω cm2 at temperatures as low as 450 °C) and the electrodes (area specific resistance of the cathode and anode below 0.3 Ω cm2 at 700 °C). A micro solid oxide fuel cell with an active area of 2 mm2 and less than 1 micrometer in thickness was characterized under fuel cell conditions, using hydrogen as a fuel and air as an oxidant. A maximum power density of 100 mW cm−2 and 2 mW per single membrane was generated at 750 °C, having an open circuit voltage of 1.05 V. Impedance spectroscopy of the all-ceramic membrane showed a total area-specific resistance of ∼3.5 Ω cm2.
Broader contextSolid Oxide Fuel Cells (SOFCs) are efficient electrochemical devices that convert chemical energy (in the form of fuel) into electricity. They are traditionally used for stationary power generation, but recent advances in their miniaturization have shown them as a promising alternative to current batteries for portable power supplies. Micro SOFCs (μSOFCs) have high energy density (up to 4× compared to Li-ion batteries) and instant refill capability, which will allow increasing the limited out-of-grid autonomy of current high performance devices. Moreover, μSOFC capability of working with hydrocarbon fuels is an advantage, due to their availability, easy handling, high specific energy and well-established regulations. Hydrocarbon reforming typically requires high temperatures above 600 °C. Imposing such temperatures on a μSOFC is feasible with low power consumption, by integrating its functional layers onto low thermal mass nanometric free-standing membranes. However, fast degradation of the state-of-the-art metallic electrodes takes place at those temperatures. Here, a full ceramic μSOFC is presented for the first time as a thermally stable system, up to 750 °C. Porous La0.6Sr0.4CoO3−δ is used as a cathode, dense yttria-stabilized zirconia as an electrolyte and porous Ce0.8Gd0.2O1.9−δ as an anode. This work opens new insights for the development of a new generation of more reliable full ceramic μSOFCs. |
Introduction
The energy gap between the capacity of the current battery technology and the power requirements of mobile devices is increasing year by year.1 This energy divergence brings a new challenge of unlimited portable power generation that opens new opportunities for technologies beyond Li-ion batteries. In this new scenario, novel developments on the miniaturization of efficient power generators able to operate continuously (by using a fuel) are receiving renewed attention. There is increasing interest in micro Solid Oxide Fuel Cells (μSOFCs) fully integrated in silicon, especially after recent advances that make this disruptive technology a serious candidate to power next generations of portable devices.2In the last decade, several groups have presented promising results on Si-integrated μSOFC systems. Evans et al.3 reviewed in 2009 the main achievements of the different groups dealing with μSOFCs, i.e. ETH Zurich,4,5 Stanford University,6–8 EPF Lausanne9 and KIST.10 Power outputs listed there ranged from values below 1 mW cm−2![[thin space (1/6-em)]](https://www.rsc.org/images/entities/char_2009.gif) 9 to a maximum of 861 mW cm−2 at 450 °C using corrugated membranes.8 Since then, main achievements prior to this work were made mainly by Prof. Ramanathan and co-workers at Harvard University,2,11–24 who published several articles showing power densities up to 1177 mW cm−2 at 520 °C.21Table 1 updates and extends Evans' review by summarizing the complete series of power outputs (and corresponding fabrication parameters) published until now on μSOFC devices based on functional free-standing membranes integrated in silicon.25–37
9 to a maximum of 861 mW cm−2 at 450 °C using corrugated membranes.8 Since then, main achievements prior to this work were made mainly by Prof. Ramanathan and co-workers at Harvard University,2,11–24 who published several articles showing power densities up to 1177 mW cm−2 at 520 °C.21Table 1 updates and extends Evans' review by summarizing the complete series of power outputs (and corresponding fabrication parameters) published until now on μSOFC devices based on functional free-standing membranes integrated in silicon.25–37
| Group | Pub. year | Anode (dep. tech.) | Electrolyte (dep. tech.) | Cathode (dep. tech.) | PEN total thickness (nm) | Max. active area (mm2) | OCV (V) | Power output (mW cm−2) | Total power (mW) | Temp. (°C) | Power stability | Ref. |
|---|---|---|---|---|---|---|---|---|---|---|---|---|
| Stanford Univ. (Prinz et al.) | 2007 | Pt (sp) | YSZ (sp) | Pt (sp) | 80 + 50 + 80 | 0.01 | 1.05 | 130 | 0.013 | 350 | — | 6 |
| Pt (sp) | YSZ/GDC (sp) | Pt (sp) | 80 + 100 + 80 | 1.10 | 200 | 0.020 | ||||||
| 2007 | Pt (sp) | YSZ (ALD) | Pt (sp) | 80 + 60 + 80 | 0.01 | 1.10 | 270 | 0.027 | 350 | — | 7 | |
| 2008 | Pt (sp) | YSZ (ALD) | Pt (sp) | 120 + 70 + 120 | 0.3* | 1.09 | 861* | 2.44 | 450 | — | 8 | |
| 2009 | Pt (sp) | BYZ (ALD) | Pt (sp) | 80 + 110 + 80 | 0.01 | 1.09 | 136 | 0.014 | 400 | — | 25 | |
| Pt (sp) | BYZ (PLD) | Pt (sp) | 80 + 130 + 80 | 1.12 | 120 | 0.012 | 450 | |||||
| 2011 | Pt (sp) | YSZ (ALD) | Pt (sp) | 60 + 80 + 60 | 0.01* | 1.11 | 560 | 0.056 | 450 | — | 27 | |
| 820* | 0.082 | |||||||||||
| 2011 | Pt (sp) | YSZ (ALD) | Pt (sp) | 120 + 70 + 120 | 4 (58.9%) | 1.12 | 198 | 2.98 | 450 | — | 29 | |
| 2012 | Pt (sp) | YSZ-YDC (ALD) | Pt (sp) | 80 + 70 + 80 | 0.003 | ∼1 | 1040 | 0.034 | 500 | — | 32 | |
| 2013 | Pt (sp) | YSZ-YDC (ALD) | Pt (sp) | 80 + 60 + 80 | 0.002* | 1.05 | 1300* | 0.024 | 450 | 70% Pmax ∼ 1 h | 33 | |
| ETH Zurich (Gauckler et al.) | 2008 | Pt (sp) | YSZ (PLD) | Pt (sp) | 50 + 550 + 50 | 0.77 | 26 | 0.008 | 500 | — | 4 | |
| Pt (sp) | YSZ (PLD) | LSCF (s.pyr) | 50 + 550 + 200 | 0.03 | 0.55 | 10 | 0.003 | |||||
| Pt (sp) | YSZ (PLD)/YSZ (s.pyr) | Pt (paste) | 50 + 750 + 104 | 1.06 | 150 | 0.045 | ||||||
| 2012 | Pt (sp) | YSZ (PLD)/YSZ (s.pyr) | Pt (sp) | 80 + 500 + 80 | 0.03 | 0.57 | 209 | 0.063 | 550 | — | 30 | |
| 2013 | Pt (sp) | 3YSZ (PLD) | LSC (s.pyr) | 80 + 300 + 250 | 0.15 | 1.02 | 12 | 0.018 | 500 | — | 31 | |
| 2014 | Pt (sp) | 3YSZ (PLD) | Pt (sp) | 60 + 300 + 60 | 0.15 | 1.07 | 47 | 0.070 | 565 | — | 36 | |
| ETH Zurich (Prestat et al.) | 2013 | Pt (sp) | YSZ (CVD) | Pt (sp) | 80 + 100 + 80 | 0.13 | 0.84 | 166 | 0.22 | 410 | 34 | |
| YSZ/CGO (CVD) | 80 + 110 + 80 | 1.05 | 175 | 0.23 | 448 | |||||||
| EPFLausanne (Muralt et al.) | 2008 | Pt (sp) | YSZ (sp) | Pt (sp) | 25 + 750 + 25 | 20 (with Ni grid) | 0.28 | — | — | 400 | — | 9 |
| 2010 | Pt (sp) | YSZ (sp) | Pt (sp) | 100 + 400 + 100 | 0.8 (with Ni grid) | 0.85 | 0.02 | 0.0002 | 500 | — | 26 | |
| Harvard Univ. (Ramanathan et al.) | 2010 | Pt (sp) | YSZ (sp) | LSCF (sp) | 120 + 60 + 67 | 0.06 | 0.60 | 120 | 0.072 | 560 | — | 11 |
| 2011 | Pt (sp) | YSZ (sp) | Pt (sp) | 80 + 100 + 80 | 0.03 | 0.97 | 1037 | 0.31 | 500 | 75% Pmax < 1 h | 12 | |
| 50% Pmax < 10 h | ||||||||||||
| 2011 | Pt (sp) | YSZ (sp) | BSCF (sp) | 80 + 100 + 100 | 0.03 | 1.08 | 35 | 0.011 | 520 | — | 13 | |
| 2011 | LSCF (sp) | YSZ (sp) | LSCF (sp) | 65 + 60 + 65 | 0.03 | 0.18 | 0.21 | 0.00006 | 500 | — | 14 | |
| 2011 | Pt (sp) | YSZ (sp) | LSCF (sp) | 30 + 54 + 47 | 25 (with Ni grid) | 0.75 | 155 | 21.1 | 510 | 86% Pmax < 1 h | 2 | |
| 50% Pmax < 10 h | ||||||||||||
| 2011 | Pd (sp) | YSZ (sp) | Pt (sp) | 50 + 100 + 70 | 0.03 | 1.03 | 145 | 0.044 | 400 | — | 15 | |
| Pd (sp) | YSZ (sp) | Pt (sp) | 0.77 | 385 (with CH4) | 0.12 | 550 | ||||||
| 2011 | Ru (sp) | YSZ (sp) | Pt (sp) | 30 + 80 + 70 | 0.03 | 0.71 | 450 (with CH4) | 0.14 | 500 | — | 16 | |
| 2012 | Pt (sp) | YSZ–CGO (sp) | Pt (sp) | 80 + 100 + 80 | 0.03 | 0.41 | 1025 | 0.31 | 510 | Stable OCV for >50 h | 17 | |
| Pt (sp) | YSZ/YSZ–CGO (sp) | Pt (sp) | 80 + 120 + 80 | 0.73 | 930 | 0.28 | ||||||
| 2012 | Pt (sp) | ZrO2 (sp) | Pt (sp) | 55 + 50 + 55 | 0.03 | 0.91 | 33 | 0.010 | 450 | — | 18 | |
| 2012 | Ru–CGO (sp) | YSZ (sp) | Pt (sp) | 30 + 100 + 40 | 0.04 | 0.99 | 275 (with CH4) | 0.11 | 485 | 62% Pmax in 3 h | 19 | |
| 2012 | Pt (sp) | YSZ (sp) | Pt (sp) | 25 + 95 + 25 | 0.02 | ∼1 | ∼10 | 0.002 | 360 | — | 20 | |
| VOx/Pt (sp) | ∼1 | 6.6 | 0.001 | |||||||||
| VOx (sp) | ∼0.75 | ∼1 | 0.0002 | |||||||||
| 2012 | Pt (sp) | CGO/YSZ (sp) | Pt (sp) | n/a + 85 + n/a | 0.03 | 0.6 | 1177 | 0.30 | 520 | — | 21 | |
| Pt (sp) | 0.95 | 412 | 0.11 | |||||||||
| Ru (sp) | 0.85 | 665 (with CH4) | 0.17 | |||||||||
| 2013 | Ru (sp) | YSZ (sp) | Pt (sp) | 50 + 110 + 70 | 0.04 | 0.92 | 440 (with CH4) | 0.18 | 500 | — | 22 | |
| Ru (sp) | YSZ (sp) | Pt (sp) | 0.96 | 410 (with nat. gas) | 0.16 | |||||||
| 2013 | Pt (sp) | YSZ (sp) | Pt (sp) | n/a + 100 + n/a | 0.03 | ∼1 | 108 (with CH4) | 0.028 | 405 | — | 23 | |
| 2013 | Pt (sp) | YDC (sp) | Pt (sp) | n/a + 100 + n/a | 0.03 | ∼1 | 125 | 0.032 | 500 | — | 24 | |
| 2014 | Pt (sp) | YSZ (sp) | Pt (sp) | n/a + 100 + n/a | 3.14 | 0.87 | 75 | ∼3 | 500 | — | 37 | |
| KIST (Son et al.) | 2011 | Pt (sp) | YSZ (PLD) | Pt (sp) | 80 + 200 + 80 | 0.01 | 1.06 | — | — | 400 | — | 28 |
| Pt on AAO (sp) | YSZ (PLD) | Pt (sp) | 80 + 900 + 80 | 1.02 | 350 | 0.035 | 500 | |||||
| 2014 | Pt (sp) | BCY/BZY (PLD) | Pt (sp) | 100 + 200 + 100 | 0.02 | 0.98 | 145 | 0.029 | 400 | Abrupt decrease in OCV | 35 | |
| This work | 2014 | CGO (PLD) | YSZ (PLD) | LSC (PLD) | 250 + 300 + 200 | 1.90 | 1.10 | 100 | 1.90 | 750 | — | — |
The μSOFC operation temperatures covered in the literature are below T < 560 °C (see Table 1 – temp.). These low operation temperatures are beneficial from the materials point of view38 but do not allow the integration of the cells into real systems fuelled with hydrocarbons, i.e. including a reformer unit (operation under pure hydrogen is out of consideration for portable applications for safety and practical reasons). Typical reforming reactors with the required high conversion and selectivity rates usually work at temperatures of ca. 700 °C.39–41 Alternative conversion pathways, based on partial oxidation of hydrocarbons, have been recently proposed by Santis-Alvarez et al.36,42,43 to reduce this high conversion temperature to T < 600 °C. However, this promising route still requires a significant catalyst optimization to reach competitive performance compared to classical steam or dry reformers. The operation of a μSOFC at T > 600 °C introduces new thermal stability needs for the self-supported electrolyte membranes and thin film electrodes.
About the membranes, the authors have recently reported the fabrication of thermo-mechanically resistant and defect-free large-area yttria-stabilized zirconia (YSZ) electrolyte membranes44–46 stable up to 750 °C overcoming historically reported issues.47–49 On the other hand, although poor stability of thin film metals like Pt above 400 °C has been extensively proved in bulky substrates,50–53 Pt continues to be the material of choice for all the reported results for at least one of the electrodes of the μSOFC (see Table 1 – anode and cathode). The quick degradation associated with dewetting processes and subsequent loss of performance have been even reported for μSOFCs,2,12,19 showing a rapid drop in the maximum power density after a few hours of operation at temperatures as low as 500 °C (see Table 1 – power stability). Presumably, this metal instability is also the origin of the variability of the maximum power reported for analogous devices (see Table 1 – power output). For example, Prinz et al. reported power values of 270 mW cm−2 in 2007, 120 mW cm−2 in 2009, 520 mW cm−2 in 2011 and finally 198 mW cm−2 in 2012, always using the same Pt/YSZ/Pt structure. A similar variability can be observed in Ramanathan et al.'s work (from ca. 30 mW cm−2 in 2011 and 2012 to more than 1000 mW cm−2 in 2012, although in this case the functional materials were slightly varied for each case) or Gauckler et al.'s publications (from 10 mW cm−2 in 2008 to values above 150 mW cm−2 in 2008 and 2012).
In order to address this big issue, more reliable electrodes are required (in fact, also for μSOFCs operating at temperatures below 500 °C). By direct analogy with bulk SOFCs, ceramic-based electrodes would be the first choice. Several reports have been recently published devoted to the development of pure oxide-based thin film cathodes;54–62 however, only a few have focused on their implementation in μSOFC configurations (i.e. in free-standing membrane configurations).13,14,31,63 Among them, the authors have recently published the fabrication and integration of thin and porous La0.6Sr0.4CoO3−δ (LSC) films into μSOFC devices showing area specific resistances of 0.3 Ω cm2 at 700 °C.64 In contrast to this series of publications devoted to thin film cathodes, there is an alarming lack of studies devoted to the development of thin film anodes, Pt being the only material tested until now in μSOFCs (with the only exception of Ramanathan and co-workers' work on the use of alternative metals Pd and Ru, see Table 1 – anode).
Two main strategies appear to be the most suitable for fabricating more reliable thin film anodes for μSOFCs, namely (i) the implementation of cermets based on stable ceramic scaffolds or (ii) the use of more stable fully ceramic anode materials. Only a few studies dealing with thin film cermet anodes (below 1 μm) have been published until now,19,65–69 and among them, there is only one report on their implementation on μSOFC membranes.19 Müller et al. prepared Ni–CGO by sol–gel chemistry observing quick conductivity degradation above 400 °C (see ESI of ref. 69). Takagi et al.19 fabricated a Ru–CGO composite observing a quite fast degradation of the so-fabricated μSOFC with time (62% of the initial power density within 3 h). From these results, it is clear that direct transferability of bulk SOFC state-of-the-art anode materials is still a challenge for the thin film μSOFC community. On the other hand, it is well-known that pure ceramic electrodes typically used in bulk SOFCs do not present dewetting, thus being a promising alternative to metals for the anode side too (at higher operating temperatures). A recent publication by Jung et al.65 has already shown the superior performance of columnar porous samarium-doped ceria (SDC) films for hydrogen electro-oxidation. This suggests columnar doped ceria as an excellent ceramic anode in the intermediate temperature regime, with no need of extra metallic components due to its high electronic conductivity under reducing conditions.
In this work, large-area self-supported membranes of YSZ ((Y2O3)0.08(ZrO2)0.92) have been integrated in silicon microtechnology. Thin film porous electrodes were deposited on both sides of the membranes by using pulsed laser deposition (PLD). In particular, LSC was employed as a cathode and Ce0.8Gd0.2O1.9−δ (CGO) as an anode. Microstructural characterization, in-plane conductivity measurements and electrochemical performance studies on both electrodes tested in symmetrical configuration have been carried out in order to determine their suitability for μSOFC integration. As an outcome, first results on device performance of a fully-ceramic based μSOFC are presented. The cell was evaluated under a pure H2 atmosphere at temperatures up to 750 °C.
Experimental
Large-area self-supported electrolyte membranes integrated in silicon microtechnology
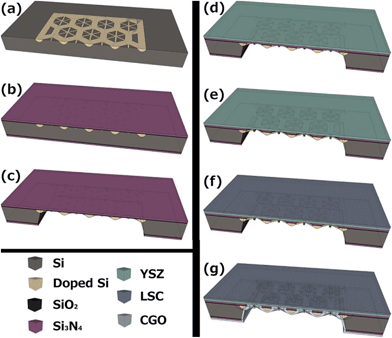
The fabrication of free-standing low-thermal mass large-area membranes is described in detail in ref. 70–72, and is briefly summarized in Fig. 1. In order to increase the active free-standing area of the device, the total area was enlarged by using a grid of doped-silicon slabs as the mechanical support. A photolithographic step in the first stage of the microfabrication flow was used to define certain zones to be doped on the initial silicon wafer (see Fig. 1a). Since heavily p-doped silicon is not affected by anisotropic etchants used in silicon micromachining,73 these regions define the future supporting slabs. After doping, a SiO2/Si3N4 dielectric bilayer was deposited on both sides of the wafers (Fig. 1b). Then, by selectively etching the Si substrate from the backside, large area Si3N4 free-standing membranes were released on the topside of the Si wafer (reinforced by the non-etched doped silicon slabs). These membranes were then used as substrates for the electrolyte deposition, carried out by means of PLD using previously reported conditions44,45 (Fig. 1c and d). Afterwards, the electrolyte free-standing membranes were released by removing the remaining silicon nitride layer from the backside using reactive ion etching (RIE) (Fig. 1e). Once the free-standing electrolyte membrane was obtained, the electrodes were deposited on both sides (cathode topside, Fig. 1f, and anode backside, Fig. 1g). For the final measurements, patterned metallic dense films were additionally implemented on both sides of the tri-layer ceramic membrane by nanosphere lithography,64,72 serving as current collectors.Thin film functional layer deposition and characterization
Porous CGO and LSC thin film electrodes (anode and cathode, respectively) were deposited by PLD on top of previously deposited dense YSZ thin electrolyte films. The whole series of depositions were carried out on PLD5000 equipment from PVD products, which allows the deposition of functional layers at a wafer level (4′′ substrates). Deposition conditions for YSZ and LSC were adapted from previous reports already published by the authors on the development and optimization of these materials for the μSOFC electrolyte44–46 and cathode,64 respectively. Meanwhile, the fabrication and characterization of ceria-based anode films for μSOFCs are specifically developed in this work.Electrode/electrolyte bilayers were first deposited on Si3N4/SiO2/Si bulk substrates for their microstructural and in-plane electrochemical characterization (this particular study is presented as ESI†). Porosity control (from full density in the electrolyte to high porosity in the electrodes) was accomplished by changing the background pressure on the deposition chamber, from 0.025 mbar for the YSZ to 0.13 mbar for either CGO or LSC. The deposition temperature employed for YSZ was 600 °C while 100 °C for the electrode films. The growing rates for the different functional layers were found to be ∼2.5 nm YSZ per min (wafer level deposition, laser energy 0.75 J cm−2 at 10 Hz), ∼10 nm CGO per min (small area deposition, laser energy 0.5 J cm−2 at 10 Hz) and ∼3.2 nm LSC per min (small area deposition, laser energy 0.3 J cm−2 at 20 Hz). Scanning electron microscopy (SEM, Zeiss Auriga) was used for the study of the microstructure of all the deposited films. Cross-sectional images were always taken from fractured samples.
The performance of the CGO anode developed here was tested under real μSOFC operating conditions by fabricating symmetrical CGO/YSZ/CGO free-standing membranes. Optical microscopy (Nikon Eclipse ME600) was used to check the membrane state during the fabrication process. Half-cell measurements were performed under single 5% H2–95% Ar reducing atmospheres and the electrochemical response of the thin film anode was characterized by impedance spectroscopy (EIS). The electrochemical characterization was carried out on a Probostat cell inside a high temperature furnace. Pt current collectors were deposited by sputtering (Alcatel A610 sputtering equipment at pAr = 0.01 mbar, P = 100 W and νRF = 13.6 MHz). EIS across the membrane was performed by applying small AC voltages of 50 mV in order to keep the linear regime in the measurement temperature range, in the frequency range from 30 MHz to 0.1 Hz (Novocontrol Alpha-A frequency analyzer with ZG4 test interface). Measurements were performed at temperatures between 150 °C and 700 °C using heating/cooling rates of 5 °C min−1, in order to properly separate the contribution of each component of the cell from the total resistance.
Fabrication and characterization of full ceramic μSOFC membranes
Full ceramic-based free-standing membranes were fabricated by using the materials previously developed and studied as either the electrolyte (dense YSZ), anode (porous CGO) or cathode (porous LSC) thin films. Pt-based current collectors were also added onto both sides of the membrane. The size of the silicon chips containing single large-area membranes was 10 × 10 mm2. The final μSOFC structure was Pt/LSC/YSZ/CGO/Pt and Table 2 summarizes the main fabrication parameters used for each functional layer in this work.| Material | Deposition technique | Deposition temperature | Microstructure | Film thickness | |
|---|---|---|---|---|---|
| Curr. collector | Pt | Sputtering | RT | Dense patterned | 150 nm |
| Cathode | La0.6Sr0.4CoO3−δ | PLD | 100 °C | Porous | 200 nm |
| Electrolyte | (Y2O3)0.08(ZrO2)0.92 | PLD | 600 °C | Dense | 300 nm |
| Anode | Ce0.8Gd0.2O1.9−δ | PLD | 100 °C | Porous | 250 nm |
In order to measure the fuel cell performance, samples were sealed to an alumina tube by using an Ag O-ring and heated up to 750 °C (5 °C min−1). Pure Ar was fed to the anode for sealing, while synthetic air was employed at the cathode side. Once the sample was properly sealed, pure H2 was introduced on the anode side. The open circuit voltage (OCV) of the cell was measured in galvanostatic mode by applying a negligible current flow between the electrodes and measuring the generated voltage using a Keithley 2400 sourcemeter. Once an OCV close to the theoretical one was obtained, intensity–voltage (I–V) curves were performed in galvanostatic mode, again by means of a Keithley 2400 sourcemeter. Finally, EIS experiments were complementarily carried out on the measured membranes in order to evaluate the associated resistance to each component of the fully ceramic-based μSOFCs (frequency range from 30 MHz to 0.1 Hz (Novocontrol Alpha-A frequency analyzer with a ZG4 test interface)).
Results and discussion
Fabrication and characterization of large-area self-supported YSZ membranes as μSOFC electrolytes
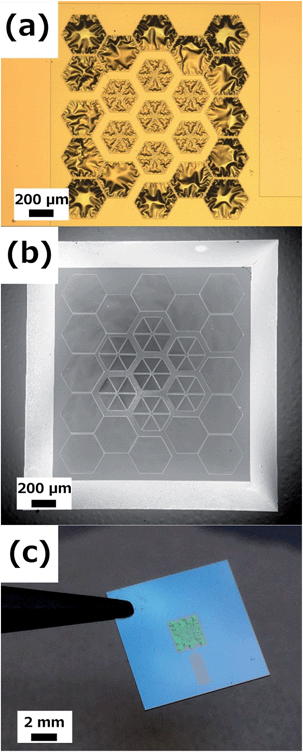
Self-supported membranes of Si3N4 were successfully fabricated by silicon micromachining. PLD deposition of YSZ and subsequent RIE etching of the Si3N4 layer were carried out to fabricate and release the YSZ membranes. Fig. 2 shows top and bottom views of the typically obtained self-supported large-area electrolyte membranes, and a real image of the fabricated Si-based devices. Although other membrane sizes were fabricated in the same wafer (with a total area ranging from 2.20 mm2 up to 11.30 mm2), in this work, the evaluated membranes have a total area of 2.50 mm2 for an active area (only YSZ free-standing area) of 1.90 mm2. This represents an enhancement of ca. 20× over previously reported basic squared free-standing membrane configurations.3 The buckling patterns observed in the free-standing part of the membranes (see Fig. 2a) correspond to a compressive strain introduced by atomic impingement during the PLD deposition together with the TEC difference between the YSZ layer and the silicon substrate. This strain field is required for avoiding membrane break during thermomechanical cycling since the silicon substrate tightens the membrane during the heating step. Further details on the origin and thermomechanical response of the so-strained membranes can be found in ref. 44 and 45. This capability of fabricating thermally stable YSZ membranes at intermediate-to-high operation temperatures (up to 800 °C) is the cornerstone for the integration of ceramic electrodes presented here for the first time.As shown in Fig. 3, large-area membranes exhibited values of conductivity similar to those previously reported for basic square membranes (where the maximum area achievable was limited to ca. 0.5 mm2)45 and also for bulk YSZ.74 These results confirm the reproducibility of the fabrication of large-area YSZ membranes, maintaining the exceptional electrochemical performance achieved with smaller membranes. The typically ascribed target value for the area specific resistance of SOFC electrolytes (ASR = 0.15 Ω cm2,75) was reached at temperatures as low as 450 °C (for <300 nm-thick YSZ films), proving the fabricated YSZ membranes as an excellent electrolyte in the whole range of intermediate temperatures (450 °C < T< 800 °C).
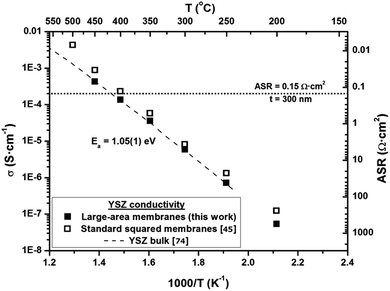 | ||
| Fig. 3 Arrhenius plot of cross-plane electrical conductivity of large-area YSZ membranes. Previously reported values for YSZ conductivity measured on standard squared membranes45 and bulk YSZ conductivity74 are also included for comparison. Values of area specific resistance (ASR) plotted on the right Y axis are calculated for 300 nm-thick YSZ films. | ||
Electrochemical characterization of thin film porous electrodes
The CGO thin film anodes were then implemented on free-standing membranes and tested under real μSOFC conditions. Fig. 4 shows the as-fabricated CGO/YSZ/CGO symmetrical free-standing membranes including patterned dense Pt current collectors. Cross-sectional SEM images with different magnifications of the same membrane are presented in the figure. A similar microstructure to the one obtained on bulk substrates was observed (i.e. porous and columnar CGO films and highly dense and columnar YSZ films, see Fig. S3†). The film homogeneity was excellent along the whole free-standing membrane. YSZ films of 300 nm and CGO of 250 nm are complemented with dense patterned 150 nm-thick Pt films on both sides of the membrane for a total thickness of ca. 1 μm. The obtained membranes showed the same typical buckling pattern already observed on the YSZ membranes (see Fig. 2a) indicating a negligible strain contribution of the porous anode film to the field of strains from the YSZ membrane itself. Therefore, the overall mechanical behaviour will be still controlled by the electrolyte.
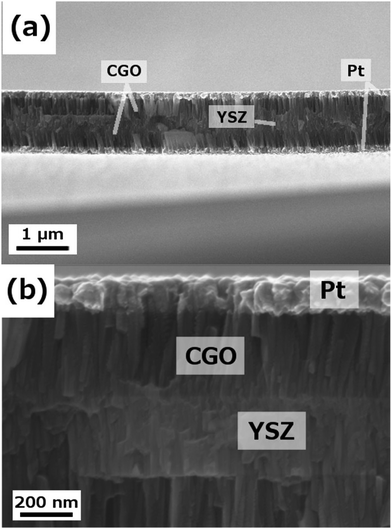 | ||
| Fig. 4 Different magnification cross-sectional SEM images of a Pt/CGO/YSZ/CGO/Pt free-standing membrane, after thermal treatment at 700 °C. | ||
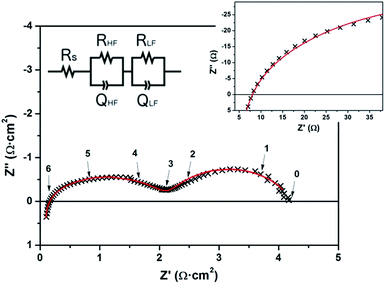
Fig. 5 depicts a Nyquist plot corresponding to the impedance spectrum obtained for a symmetrical membrane at 650 °C, under a reducing atmosphere (5% H2–95% Ar). Two separated arcs were clearly observed with resistance values of the same order of magnitude, but clearly separated due to the difference on their associated capacitance, i.e. time constant. The data were fitted according to the equivalent circuit depicted in the inset of Fig. 5 (Rs corresponds to a series resistance; RHFQHF and RLFQLF correspond to the in-parallel resistor–capacitor elements associated with the high frequency and low frequency arcs, respectively). Resistance and capacitance values calculated for each artefact appeared on the Nyquist plots are collected in Table 3. Values from the high frequency and low frequency arcs are normalized to the membrane active area. True capacitances are calculated from the constant phase elements used for fitting according to ref. 78.
| T (°C) | R s (Ω) | High frequency (HF) arc | Low frequency (LF) arc | ||||||
|---|---|---|---|---|---|---|---|---|---|
| ASR (Ω cm2) | Q (F cm−2) | n | C (F cm−2) | ASR (Ω cm2) | Q (F cm−2) | n | C (F cm−2) | ||
| 650 | 23 | 0.50 | 3.5 × 10⁻⁶ | 0.88 | 6.6 × 10⁻⁷ | 1.0 | 1.2 × 10⁻³ | 0.73 | 1.3 × 10⁻⁴ |
| 600 | 23 | 1.1 | 3.8 × 10⁻⁶ | 0.84 | 4.1 × 10⁻⁷ | 1.6 | 5.9 × 10⁻⁴ | 0.78 | 1.1 × 10⁻⁴ |
| 550 | 29 | 1.7 | 2.7 × 10⁻⁶ | 0.85 | 3.4 × 10⁻⁷ | 4.6 | 8.4 × 10⁻⁴ | 0.72 | 1.2 × 10⁻⁴ |
| 500 | 27 | 2.8 | 2.3 × 10⁻⁶ | 0.85 | 3.1 × 10⁻⁷ | 18 | 1.3 × 10⁻³ | 0.61 | 2.0 × 10⁻⁴ |
| 450 | 25 | 6.6 | 1.9 × 10⁻⁶ | 0.86 | 3.4 × 10⁻⁷ | 130 | 8.6 × 10⁻⁴ | 0.59 | 3.0 × 10⁻⁴ |
| 400 | 30 | 19 | 1.2 × 10⁻⁶ | 0.89 | 3.5 × 10⁻⁷ | 370 | 4.0 × 10⁻⁴ | 0.58 | 1.7 × 10⁻⁴ |
It is important to notice here that the contribution from the dense YSZ electrolyte is expected to be negligible at such temperatures, as shown in previous studies on the same type of substrates45 and in Fig. 3. Therefore, the series resistance is totally associated with the current collection and cable resistances. The two arcs observed in the spectrum can be associated with the CGO electrode. True capacitances measured for the high frequency (CHF = 10−6 F cm−2) and low frequency (CLF = 10−4 F cm−2) arcs suggest a correspondence between (i) the HF-arc and the oxygen transport/diffusion in the CGO electrode; and (ii) the LF-arc and the electrochemical reaction for the oxidation of hydrogen at the ceria surface. The appearance of high frequency arcs with resistances associated with the transport of ions across grain boundaries has been extensively reported for composite electrodes based on CGO with characteristic capacitances of the order of magnitude here reported, i.e. C = 10−6 F cm−2.79,80 Since similar values of capacitance are also expected for a double-layer capacitance formed between CGO and YSZ,81 the resistance associated with the HF-arc could be alternatively associated with the oxygen transport through the electrode–electrolyte interface. Coming back to the low-frequency arc, the obtained large capacitance exceeding the typical values for electrochemical reactions at planar surfaces (C = 10−3 F cm−2) reinforces the idea of a CGO working as a MIEC, i.e. extending the active surface to the bulk. A simple calculation of the surface extension achieved by using a columnar CGO like the one presented here yields a 20- to 50-fold increase of the active area. Therefore, the larger values of capacitance obtained seem reasonable and are in good agreement with previously reported columnar samaria-doped ceria.65 The MIEC behaviour observed in the impedance spectra also illustrates that Pt layers deposited on top simply act as current collectors, while the CGO plays the electrode role.
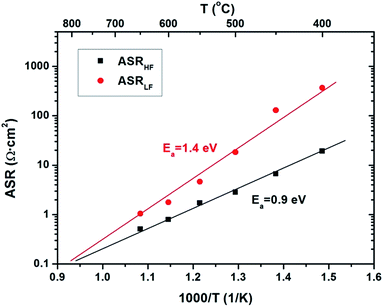
Fig. 6 shows an Arrhenius plot of the area specific resistance corresponding to the high frequency (ASRHF) and low frequency (ASRLF) arcs as a function of the temperature. In both cases, the ASR dependence on temperature follows an Arrhenius-type law, with activation energies of Ea = 0.9 eV and Ea = 1.4 eV, respectively. Activation energies around 0.8–1.0 eV were previously reported for oxide-ion conduction on CGO films82 while activation energies of the order of 1.4 eV or higher were reported for thin film MIECs in the literature.38,57,66,83–85 This correlation reinforces the association proposed on the basis of the impedance spectrum analysis indicating that the CGO is fully acting as the electrode in the symmetrical cells.
As shown in Fig. 6, polarization resistances are in good agreement with the ones reported by Jung et al.65 for similar SDC films at the same temperature (ASR = 5.73 Ω cm2 at 650 °C for Jung's 220 nm thick layers) indicating the possibility of integrating the CGO as an anode in a real μSOFC structure without performance loses. In particular, target values of ASR for anode–electrolyte interfaces in SOFCs (ASR = 0.30 Ω cm2,75) were attained at temperatures of ca. 700 °C. Since this temperature is similar to the one obtained for the target ASR in LSC/YSZ,64 a full ceramic μSOFC based on CGO as the anode, YSZ as the electrolyte and LSC as the cathode is shown to be totally feasible.
Fabrication and characterization of full ceramic-based μSOFCs
Highly buckled membranes were obtained after cathode and anode deposition (see Fig. 2a) due to the clearly dominating compressive strain of the YSZ free-standing films.44,45 No change in the buckling pattern was observed suggesting a negligible stress contribution of the two porous electrodes. Fig. 7 shows cross-sectional view images of the fabricated large-area μSOFC. The different microstructure of each layer can be distinguished in the cross-sectional SEM image. High porosity was observed on both LSC (top) and CGO (bottom) electrodes, while high density and packed columnar grain arrangements were evident for the YSZ electrolyte. Pt current collectors were implemented at both sides of the functional tri-layer. The μSOFC membranes were found to be stable under operating conditions since no cracks appeared after thermal cycling up to 750 °C. Similar microstructures to those observed on post-annealed thin films deposited over bulk substrates (see Fig. S1 and S3(c and d) in the ESI† file) and half-cell measurements (see Fig. 4 for the anode and ref. 64 for the cathode) were observed on the final full ceramic μSOFC after testing at 750 °C. Even ultra-rapid thermal cycling was successfully applied, as shown in the video file included in the ESI.†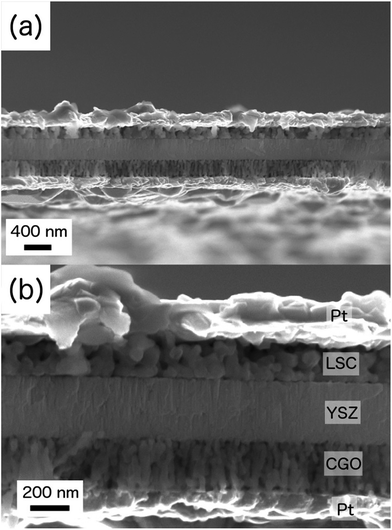 | ||
| Fig. 7 Different magnification cross-sectional SEM images of a Pt/LSC/YSZ/CGO/Pt free-standing membrane, after measuring at 750 °C. | ||
As shown in Fig. 7, the free-standing μSOFC was ca. 1 μm thick (including the Pt current collectors). The functional cathode/electrolyte/anode ceramic tri-layer showed a total thickness of ca. 750 nm, with an electrolyte layer of 300 nm thickness. Despite the fact that thinner electrolyte layers were commonly employed in the past, even by the authors,45 in this work the thickness of the YSZ layer was increased. An electrolyte thickness of several hundreds of nanometres enhances its reliability without affecting the electrochemical performance. Thicker electrolyte layers (deposited in two stages with a cleaning step in between) reduce the formation of through-pinholes and increase the thermomechanical stability of the membrane while keeping a negligible associated resistance at the operation temperature. For an electrolyte of 300 nm the area specific resistance can be as low as 0.15 Ω cm2 at temperatures below 450 °C (see Fig. 3). Considering electrodes operating at 700 °C like in this case, even thicker electrolyte layers than the one employed here will not limit the μSOFC performance.
Fig. 8 shows I–V curves obtained for one of the measured Pt/LSC/YSZ/CGO/Pt free-standing membranes at different temperatures, up to 800 °C.‡ An Open Circuit Voltage (OCV) close to the theoretical value was obtained once sealed (OCV = 1.05 V), using synthetic air as the oxidizing atmosphere (cathode side) and pure H2 as the reducing atmosphere (anode side). Although specific long-term tests have to be done, these values of OCV together with stable power densities were maintained for more than 5 h at the operating temperatures (T = 700–750 °C, see Fig. S7†), thus ensuring the reliability of the membranes from an electrochemical point of view, i.e. no pinholes or cracks appeared on the membranes during heating up, sealing and measuring. The importance of sealing problems and leakages due to pinhole formation can be clearly observed in the wide range of reported OCVs for different μSOFCs (see Table 1 – OCV), some of them far away from the theoretical value (∼1.1 V).2,4,9,11,14,17,30 The power density output was calculated as a function of the current density, showing a maximum value of 100 mW cm−2 at 750 °C and 65 mW cm−2 at 700 °C. The total power output extracted from a single cell was ca. 2 mW at 750 °C, which is in the upper range of power per cell previously reported for μSOFCs (see Table 1 – total power). These power output values are in the typical range for bulk SOFC and metal-based μSOFCs (see Table 1 – power output) being a clear proof-of-concept of the feasibility of a full-ceramic μSOFC operating at the required high temperatures.
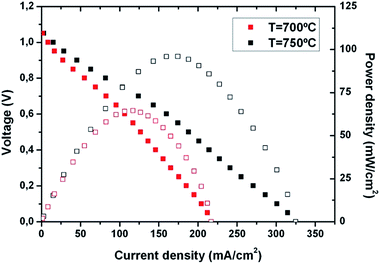 | ||
| Fig. 8 I–V curve (closed symbols) and power density output (open symbols) obtained from a Pt/LSC/YSZ/CGO/Pt free-standing membrane at 700 °C and 750 °C. | ||
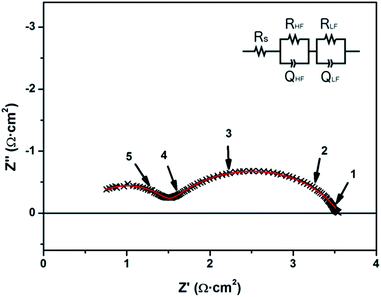
Fig. 9 shows a Nyquist plot corresponding to a Pt/LSC/YSZ/CGO/Pt free-standing membrane at 750 °C under a high power output (applied bias of 0.7 V). Since, at least, two separated arcs can be identified in the plot, an equivalent circuit Rs(RHFQHF)(RLFQLF) was proposed. The series resistance Rs includes the resistances associated with the YSZ electrolyte, the Pt current collectors and the cables and contacts. Values of Rs of several ohms were measured (see details of the high frequency range in the inset of Fig. 9) mainly corresponding to the current collector and cable resistances (as commented before and according to previous studies,45 a 300 nm-thick YSZ film at T > 700 °C presents a negligible resistance of ca. 10−6 Ω cm2). The arcs observed in the plot can be associated with the two electrodes of the μSOFC. High frequency and low frequency arcs present resistance values of the same order of magnitude (see listed values in Table 4) with associated capacitances of CHF = 10−6 F cm−2 and CLF = 10−3 F cm−2. These values of capacitance suggest a double contribution from the different phenomena involved in both electrodes, i.e. capacitances associated with oxide ion transport (likely in the CGO anode) and non-charge transfer phenomena typical of high surface active areas of a MIEC (in the CGO anode and the LSC cathode). It is important to notice here that no significant effect of Si diffusion in the electrolyte or electrode films was observed in this work (see Fig. S8†), neither LSC–YSZ interdiffusion reactions.64 Since the series resistance contribution is negligible in comparison with the total resistance of the cell, the thin film ceramic electrodes represent the main source of resistance loses in the cell. The high frequency arc associated with the oxide-ion transport inside the CGO electrode and the low frequency arc corresponding to the electrochemical reactions represent almost half–half of the total resistance (ASR = 1.5 Ω cm2 and 2.0 Ω cm2, respectively). These values of ASR are one order of magnitude higher than those expected from symmetrical cell measurements (either for CGO or LSC films) indicating that the integration of both ceramic electrodes in the μSOFC requires further optimization. On-going work is being devoted to exploring different alternatives to reduce the anode and cathode polarization resistances, and especially the resistance associated with the oxide-ion transport through the porous CGO film.
| BIAS: 0.7 V | ||
|---|---|---|
| ASR (Ω cm2) | C (F cm−2) | |
| High frequency arc | 1.5 | 1 × 10⁻⁶ |
| Low frequency arc | 2.0 | 3 × 10⁻³ |
| Electrolyte + c.c. | <0.02 | — |
Summing up, the goal of fabricating reliable large-area μSOFCs able to operate at temperatures above 700 °C is addressed here for the first time on the basis of durable ceramic electrodes and robust self-suspended YSZ membranes. Fig. 10 shows a plot of the total power per single μSOFC versus power density and operating temperature published by different authors, compared to this work (based on Table 1). The novel strategy for increasing the active area above 2 mm2, i.e. high power per unit cell (>2 mW), overcomes the limits presented by most of the published devices (with total power below 100 μW) while operating at temperatures higher than 200 °C. Since the stability of the employed ceramic electrodes is out of discussion (stability tests of the independent electrodes in thin film form carried out in the past, i.e.ref. 64 and 65; see also Fig. S9 in the ESI†), the realization of this full ceramic μSOFC reinforces the feasibility of this technology and opens a new avenue in the implementation of novel strategies for improving the power density to competitive values above 500 mW cm−2. Also, although the reproducibility and thermomechanical stability of the whole ceramic membrane is ensured, specific long-term tests will be carried out as the ultimate study of reliability of the here-reported full ceramic μSOFC.
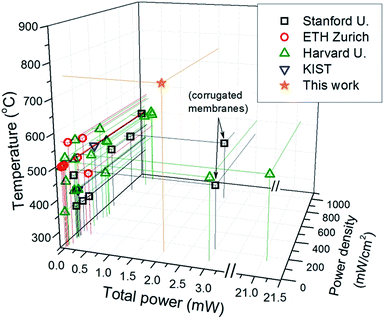 | ||
| Fig. 10 Representation of the state-of-the-art in μSOFCs in terms of total power per single device, power density obtained and operating temperature. | ||
Conclusions
A full ceramic-based μSOFC has been presented here for the first time, opening a new family of robust μSOFCs able to operate at high temperatures (where hydrocarbon reforming can be considered for fuelling). Large-area (>2 mm2) free-standing μSOFCs were fabricated using a porous LSC thin film as the cathode, a dense membrane of YSZ as the electrolyte and a porous CGO thin film as the anode. The thermo-mechanical stability of the μSOFC membrane was proved up to 750 °C, thus extending the up-to-now reported operating temperatures of μSOFCs (<550 °C). Pure ceramic cathode and anode films showed good electrochemical performance in real μSOFC configurations at temperatures of 700 °C (ASR < 0.30 Ω cm2). Measurements of the fuel cell performance of the device were carried out at 700–750 °C. A maximum power density of 100 mW cm−2 was measured at 750 °C, under pure H2 as a fuel and synthetic air as an oxidant, for a total power per cell of 2 mW. Therefore, a new generation of more reliable μSOFCs, based on ceramics, is presented in this work as a promising candidate for real implementation of these miniaturized MEMS power generators in portable devices.Acknowledgements
This investigation has been supported by the Spanish Ministry of Economy and Competitiveness (Consolider MULTICAT CDS-2009-00050, POWER PACK ENE2010-14833, MAT-2008-04931 and TEC-2009-14660-C02-01 projects), the “Generalitat de Catalunya” (Advanced Materials for Energy Network, XaRMAE, 2009-SGR-00050). Part of this study was funded by the European Institute of Innovation and Technology (KIC Innoenergy, Electric Energy and Storage Project). The research was also supported by European Regional Development Funds (ERDF, FEDER Programa Competitivitat de Catalunya 2007e2013). AT and NS would like to thank the financial support of the Ramon y Cajal postdoctoral program. The authors would like to particularly thank Dr Mónica Burriel and Prof. John Kilner for SIMS measurements presented in the ESI file.†Notes and references
- S. B. Schaevitz, in Proc. of SPIE, 2012, p. 824802 Search PubMed.
- M. Tsuchiya, B.-K. Lai and S. Ramanathan, Nat. Nanotechnol., 2011, 6, 282–286 CrossRef CAS PubMed.
- A. Evans, A. Bieberle-Hütter, J. L. M. Rupp and L. J. Gauckler, J. Power Sources, 2009, 194, 119–129 CrossRef CAS.
- U. P. Muecke, D. Beckel, A. Bernard, A. Bieberle-Hütter, S. Graf, A. Infortuna, P. Müller, J. L. M. Rupp, J. Schneider and L. J. Gauckler, Adv. Funct. Mater., 2008, 18, 3158–3168 CrossRef CAS.
- A. Bieberle-Hütter, D. Beckel, A. Infortuna, U. P. Muecke, J. L. M. Rupp, L. J. Gauckler, S. Rey-Mermet, P. Muralt, N. R. Bieri, N. Hotz, M. J. Stutz, D. Poulikakos, P. Heeb, P. Müller, A. Bernard, R. Gmür and T. Hocker, J. Power Sources, 2008, 177, 123–130 CrossRef.
- H. Huang, M. Nakamura, P. Su, R. Fasching, Y. Saito and F. B. Prinz, J. Electrochem. Soc., 2007, 154, B20–B24 CrossRef CAS.
- J. H. Shim, C.-C. Chao, H. Huang and F. B. Prinz, Chem. Mater., 2007, 19, 3850–3854 CrossRef CAS.
- P.-C. Su, C.-C. Chao, J. H. Shim, R. Fasching and F. B. Prinz, Nano Lett., 2008, 8, 2289–2292 CrossRef CAS PubMed.
- S. Rey-Mermet and P. Muralt, Solid State Ionics, 2008, 179, 1497–1500 CrossRef CAS.
- C.-W. Kwon, J.-W. Son, D.-J. Lee, K.-B. Kim, J.-H. Lee and H.-W. Lee, in European Fuel Cell Forum, Lucerne, 2008, p. B0519 Search PubMed.
- B.-K. Lai, K. Kerman and S. Ramanathan, J. Power Sources, 2010, 195, 5185–5196 CrossRef CAS.
- K. Kerman, B.-K. Lai and S. Ramanathan, J. Power Sources, 2011, 196, 2608–2614 CrossRef CAS.
- K. Kerman, B.-K. Lai and S. Ramanathan, J. Power Sources, 2011, 196, 6214–6218 CrossRef CAS.
- B.-K. Lai, K. Kerman and S. Ramanathan, J. Power Sources, 2011, 196, 1826–1832 CrossRef CAS.
- B.-K. Lai, K. Kerman and S. Ramanathan, J. Power Sources, 2011, 196, 6299–6304 CrossRef CAS.
- Y. Takagi, B.-K. Lai, K. Kerman and S. Ramanathan, Energy Environ. Sci., 2011, 4, 3473–3478 CAS.
- K. Kerman, B.-K. Lai and S. Ramanathan, J. Power Sources, 2012, 202, 120–125 CrossRef CAS.
- C. Ko, K. Kerman and S. Ramanathan, J. Power Sources, 2012, 213, 343–349 CrossRef CAS.
- Y. Takagi, S. Adam and S. Ramanathan, J. Power Sources, 2012, 217, 543–553 CrossRef CAS.
- Q. Van Overmeere, K. Kerman and S. Ramanathan, Nano Lett., 2012, 12, 3756–3760 CrossRef CAS PubMed.
- K. Kerman, B.-K. Lai and S. Ramanathan, Adv. Energy Mater., 2012, 2, 656–661 CrossRef CAS.
- Y. Takagi, K. Kerman, C. Ko and S. Ramanathan, J. Power Sources, 2013, 243, 1–9 CrossRef CAS.
- K. Kerman, T. Tallinen, S. Ramanathan and L. Mahadevan, J. Power Sources, 2013, 222, 359–366 CrossRef CAS.
- K. Kerman, Q. Van Overmeere, M. Karpelson, R. J. Wood and S. Ramanathan, ACS Nano, 2013, 7, 10895–10903 CrossRef CAS PubMed.
- J. H. Shim, J. S. Park, J. An, T. M. Gür, S. Kang and F. B. Prinz, Chem. Mater., 2009, 21, 3290–3296 CrossRef CAS.
- S. Rey-Mermet, Y. Yan, C. Sandu, G. Deng and P. Muralt, Thin Solid Films, 2010, 518, 4743–4746 CrossRef CAS.
- C.-C. Chao, C.-M. Hsu, Y. Cui and F. B. Prinz, ACS Nano, 2011, 5, 5692–5696 CrossRef CAS PubMed.
- C.-W. Kwon, J.-W. Son, J.-H. Lee, H.-M. Kim, H.-W. Lee and K.-B. Kim, Adv. Funct. Mater., 2011, 21, 1154–1159 CrossRef CAS.
- P.-C. Su and F. B. Prinz, Electrochem. Commun., 2012, 16, 77–79 CrossRef CAS.
- R. Tölke, A. Bieberle-Hütter, A. Evans, J. L. M. Rupp and L. J. Gauckler, J. Eur. Ceram. Soc., 2012, 32, 3229–3238 CrossRef.
- A. Evans, C. Benel, A. J. Darbandi, H. Hahn, J. Martynczuk, L. J. Gauckler and M. Prestat, Fuel Cells, 2013, 13, 441–444 CrossRef CAS.
- Z. Fan, J. An, A. Iancu and F. B. Prinz, J. Power Sources, 2012, 218, 187–191 CrossRef CAS.
- J. An, Y.-B. Kim, J. Park, T. M. Gür and F. B. Prinz, Nano Lett., 2013, 13, 4551–4555 CrossRef CAS PubMed.
- M. V. F. Schlupp, A. Evans, J. Martynczuk and M. Prestat, Adv. Energy Mater., 2013, 4, 1301383 Search PubMed.
- K. Bae, D. Y. Jang, H. J. Jung, J. W. Kim, J.-W. Son and J. H. Shim, J. Power Sources, 2014, 248, 1163–1169 CrossRef CAS.
- B. Scherrer, A. Evans, A. J. Santis-Alvarez, B. Jiang, J. Martynczuk, H. Galinski, M. Nabavi, M. Prestat, R. Tölke, A. Bieberle-Hütter, D. Poulikakos, P. Muralt, P. Niedermann, A. Dommann, T. Maeder, P. Heeb, V. Straessle, C. Muller and L. J. Gauckler, J. Power Sources, 2014, 258, 434–440 CrossRef CAS.
- K. Kerman, S. Xuza and S. Ramanathan, J. Electroceram., 2014 DOI:10.1007/s10832-014-9917-1.
- A. Tarancón, Energies, 2009, 2, 1130–1150 CrossRef.
- A. Bieberle-Hutter, A. J. Santis-Alvarez, B. Jiang, P. Heeb, T. Maeder, M. Nabavi, D. Poulikakos, P. Niedermann, A. Dommann, P. Muralt, A. Bernard and L. J. Gauckler, Lab Chip, 2012, 12, 4894–4902 RSC.
- B. T. Schädel, M. Duisberg and O. Deutschmann, Catal. Today, 2009, 142, 42–51 CrossRef.
- N. J. Divins, E. López, Á. Rodríguez, D. Vega and J. Llorca, Chem. Eng. Process. Process Intensif., 2013, 64, 31–37 CrossRef CAS.
- A. J. Santis-Alvarez, M. Nabavi, B. Jiang, T. Maeder, P. Muralt and D. Poulikakos, Chem. Eng. Sci., 2012, 84, 469–478 CrossRef CAS.
- A. J. Santis-Alvarez, R. Büchel, N. Hild, W. J. Stark and D. Poulikakos, Appl. Catal., A, 2014, 469, 275–283 CrossRef CAS.
- A. Tarancón, N. Sabaté, A. Cavallaro, I. Gràcia, J. Roqueta, I. Garbayo, J. P. Esquivel, G. Garcia, C. Cané and J. Santiso, J. Nanosci. Nanotechnol., 2010, 10, 1327–1337 CrossRef.
- I. Garbayo, A. Tarancón, J. Santiso, F. Peiró, E. Alarcón-LLadó, A. Cavallaro, I. Gràcia, C. Cané and N. Sabaté, Solid State Ionics, 2010, 181, 322–331 CrossRef CAS.
- I. Garbayo, G. Dezanneau, C. Bogicevic, J. Santiso, I. Gràcia, N. Sabaté and A. Tarancón, Solid State Ionics, 2012, 216, 64–68 CrossRef CAS.
- C. D. Baertsch, K. F. Jensen, J. L. Hertz, H. L. Tuller, S. T. Vengallatore, S. M. Spearing and M. A. Schmidt, J. Mater. Res., 2004, 19, 2604–2615 CrossRef CAS.
- D. J. Quinn, M.Sc. Thesis, Massachusetts Institute of Technology, 2006.
- N. Yamamoto, M.Sc. Thesis, Massachusetts Institute of Technology, 2006.
- T. Ryll, H. Galinski, L. Schlagenhauf, P. Elser, J. L. M. Rupp, A. Bieberle-Hutter and L. J. Gauckler, Adv. Funct. Mater., 2011, 21, 565–572 CrossRef CAS.
- H. Galinski, T. Ryll, L. Schlagenhauf, L. J. Gauckler, P. Stender and G. Schmitz, Phys. Rev. B: Condens. Matter Mater. Phys., 2012, 85, 125408 CrossRef.
- X. Wang, H. Huang, T. Holme, X. Tian and F. B. Prinz, J. Power Sources, 2008, 175, 75–81 CrossRef CAS.
- H. Galinski, T. Ryll, P. Elser, J. L. M. Rupp, A. Bieberle-Hütter and L. J. Gauckler, Phys. Rev. B: Condens. Matter Mater. Phys., 2010, 82, 235415 CrossRef.
- H.-I. Ji, J. Hwang, K. J. Yoon, J.-W. Son, B.-K. Kim, H.-W. Lee and J.-H. Lee, Energy Environ. Sci., 2013, 6, 116–120 CAS.
- P. Plonczak, A. Bieberle-Hütter, M. Søgaard, T. Ryll, J. Martynczuk, P. V. Hendriksen and L. J. Gauckler, Adv. Funct. Mater., 2011, 21, 2764–2775 CrossRef CAS.
- C. Benel, A. J. Darbandi, R. Djenadic, A. Evans, R. Tölke, M. Prestat and H. Hahn, J. Power Sources, 2013, 229, 258–264 CrossRef CAS.
- J. Hayd, L. Dieterle, U. Guntow, D. Gerthsen and E. Ivers-Tiffée, J. Power Sources, 2011, 196, 7263–7270 CrossRef CAS.
- J. Hayd, H. Yokokawa and E. Ivers-Tiffée, J. Electrochem. Soc., 2013, 160, F351–F359 CrossRef CAS.
- N. I. Karageorgakis, A. Heel, A. Bieberle-Hütter, J. L. M. Rupp, T. Graule and L. J. Gauckler, J. Power Sources, 2010, 195, 8152–8161 CrossRef CAS.
- C. Peters, A. Weber and E. Ivers-Tiffée, J. Electrochem. Soc., 2008, 155, B730–B737 CrossRef CAS.
- F. S. Baumann, J. Maier and J. Fleig, Solid State Ionics, 2008, 179, 1198–1204 CrossRef CAS.
- P. Plonczak, D. R. Sørensen, M. Søgaard, V. Esposito and P. V. Hendriksen, Solid State Ionics, 2012, 217, 54–61 CrossRef CAS.
- A. C. Johnson, B.-K. Lai, H. Xiong and S. Ramanathan, J. Power Sources, 2009, 186, 252–260 CrossRef CAS.
- I. Garbayo, V. Esposito, S. Sanna, A. Morata, D. Pla, L. Fonseca, N. Sabaté and A. Tarancón, J. Power Sources, 2014, 248, 1042–1049 CrossRef CAS.
- W. Jung, J. O. Dereux, W. C. Chueh, Y. Hao and S. M. Haile, Energy Environ. Sci., 2012, 5, 8682–8689 CAS.
- U. P. Muecke, K. Akiba, A. Infortuna, T. Salkus, N. V. Stus and L. J. Gauckler, Solid State Ionics, 2008, 178, 1762–1768 CrossRef CAS.
- G. La O, J. Hertz, H. Tuller and Y. Shao-Horn, J. Electroceram., 2004, 13, 691–695 CrossRef CAS.
- J. L. Hertz and H. L. Tuller, J. Electrochem. Soc., 2007, 154, B413–B418 CrossRef CAS.
- G. Müller, R.-N. Vannier, A. Ringuedé, C. Laberty-Robert and C. Sanchez, J. Mater. Chem. A, 2013, 1, 10753 Search PubMed.
- I. Garbayo, N. Sabaté, M. Salleras, A. Tarancón and A. Morata, ES Pat., P201230973, 2012 Search PubMed.
- M. Salleras, I. Garbayo, C. Calaza, A. Tarancón, I. Gràcia, L. Fonseca, C. Cané, J. Santiso and N. Sabaté, in Power MEMS, Leuven, 2010, pp. 215–218 Search PubMed.
- I. Garbayo, M. Salleras, A. Tarancón, A. Morata, G. Sauthier, J. Santiso and N. Sabaté, in 10th European SOFC Forum, Luzern, 2012, vol. 6-A07, pp. A07 – 38–44 Search PubMed.
- L. Fonseca, J. Santander, R. Rubio, N. Sabaté, E. Figueras, M. Duch, I. Gràcia and C. Cané, Sens. Actuators, B, 2008, 130, 538–545 CrossRef CAS.
- J. B. Goodenough, Annu. Rev. Mater. Res., 2003, 33, 91–128 CrossRef CAS.
- N. P. Brandon, S. Skinner and B. C. H. Steele, Annu. Rev. Mater. Res., 2003, 33, 183–213 CrossRef CAS.
- A. Infortuna, A. S. Harvey and L. J. Gauckler, Adv. Funct. Mater., 2008, 18, 127–135 CrossRef CAS.
- C. Kleinlogel, Solid State Ionics, 2000, 135, 567–573 CrossRef CAS.
- J. Fleig, Solid State Ionics, 2002, 150, 181–193 CrossRef CAS.
- S. Primdahl and Y. L. Liu, J. Electrochem. Soc., 2002, 149, A1466–A1472 CrossRef CAS.
- E. Perry Murray, Solid State Ionics, 2001, 143, 265–273 CrossRef CAS.
- N. L. Robertson and J. N. Michaels, J. Electrochem. Soc., 1991, 138, 1494–1499 CrossRef CAS.
- H. Inaba and H. Tagawa, Solid State Ionics, 1996, 83, 1–16 CrossRef CAS.
- F. S. Baumann, J. Fleig, H. U. Habermeier and J. Maier, Solid State Ionics, 2006, 177, 3187–3191 CrossRef CAS.
- P. Plonczak, M. Søgaard, A. Bieberle-Hütter, P. V. Hendriksen and L. J. Gauckler, J. Electrochem. Soc., 2012, 159, B471–B482 CrossRef CAS.
- J. Fleig, Annu. Rev. Mater. Res., 2003, 33, 361–382 CrossRef CAS.
Footnotes |
| † Electronic supplementary information (ESI) available: Additional details on the microstructural optimization of porous LSC and CGO films as well as a comparison of the thermal stability of different thin film electrodes can be found in the ESI file. Moreover, open circuit voltage and power density evolution of the cell with time during the test is included. Finally, a video showing the thermomechanical stability of the presented μSOFC under ultra-rapid thermal cycling is provided. See DOI: 10.1039/c4ee00748d |
| ‡ Measurements below 650 °C showed insufficient performance (no electrode activation), and tests at higher temperatures (T ≥ 800 °C) resulted in membrane failure (similar thermomechanical limits were previously reported by the authors45). |
| This journal is © The Royal Society of Chemistry 2014 |

