 Open Access Article
 This Open Access Article is licensed under a Creative Commons Attribution-Non Commercial 3.0 Unported Licence
Large scale deployment of polymer solar cells on land, on sea and in the air†
Nieves
Espinosa
,
Markus
Hösel
,
Mikkel
Jørgensen
and
Frederik C.
Krebs
*
DTU, Energy Conversion and Storage, Frederiksborgvej, 399, Roskilde, Denmark. E-mail: frkr@dtu.dk
First published on 22nd January 2014
Abstract
With the development of patterns that connect all cells in series, organic photovoltaics have leapt a step forward being ahead of other solar and even other energy technologies in terms of manufacturing speed and energy density. The important questions of how they are meant to be installed for producing power and what the requirements are yet to be explored. We present here the installation of organic solar cell modules in different settings (terrestrial, marine and airborne). For the evaluation of these installations deployed at DTU, we have used the life cycle assessment tools, and calculated key parameters in order to assess their environmental impact. The novel technology when installed in a solar park system can generate more than 1300 kW h kWp−1 of electricity a year, which means that the whole system can pay the energy invested back before the first year of operation, in 320 days. If this electricity is fed back to the same electricity supply system that was used for manufacturing the potential saving of more than 13 GJ of primary energy per kWp per year can be reached. With the real data logged, a dynamic energy payback time has been furthermore calculated for the case of the solar tube installation, giving a value of 1.1 years.
Broader contextFast modes of manufacture warrant fast modes of installation and low impact energy technology requires low impact installation methods. The polymer solar cell when printed in quasi-infinite rolls is best installed directly from the roll and new methods of installation are enabled. We demonstrate very low impact installation methods of polymer solar cells on land, on sea and in air, all possible due to the unique properties of OPV. We find that short system energy pay-back times are possible even with these laboratory/pilot scale printed polymer solar cells and highlight that closing the observed gap in performance between laboratory hero cells and large scale devices as presented here will be the birth of the best performing renewable energy technology ever conceived. |
1. Introduction
Greenhouse gas accounting and ecological foot printing as a result of electricity generation are concerns that every energy technology with the ambition to enter the energy supply chain must consider to counteract global warming. We employ the term of an ecological footprint for the technology and imply this as the complete measure on human demand on Earth's ecosystems. It does include not only the carbon emission footprint (CO2eq. per kW per hel generated) but also other categories that account for human welfare and biocapacity use in general. It is clear that renewable energies and PV in particular present the smallest carbon factor emissions.1,2 Photovoltaics have a steep learning curve and one of the PV technologies, the organic photovoltaic (OPV) family, has been shown to have the smallest ecological footprint and the shortest energy payback time possible.3–6 The prospect of organic photovoltaics as being a competitive energy technology however requires that new forms of installation are employed such that their advantages can be fully explored in comparison to other forms of energy.A good tool to properly compare energy options is Life-Cycle Assessment (LCA). As a tool it was developed to compare clearly defined end-product alternatives but it has been rapidly incorporated at all levels and today LCA is employed at even the very high strategic levels including decision- and policy-making. Life-cycle assessment is currently used for assessing a wide range of products and activities, from eco-labelling to product design as well as food production, transportation alternatives and to assess the sustainability of energy systems.7
In this work, we present an evaluation of the sustainability of different grid-connected installations for organic solar modules deployed at DTU through use of the LCA tool. The photovoltaic modules used in these installations have been manufactured according to the Infinity-concept, which is a refined version of the IOne process.8–10 This route has been proven to be one of the most successful to OPV manufacturing using the bulk heterojunction concept and its main feature is the low requirement of energy, both in the materials and in the process: no indium-tin-oxide is used, no vacuum steps are involved, only printing and coating steps are used and furthermore the processing takes place directly on the barrier foil at low temperature and high speed. This ultra-small cumulative energy demand (CED) results in a low energy payback time (EPBT), that is the time it takes for them to generate the same amount of energy that is embodied in the materials and spent during their manufacture. A further aspect is that a high voltage (a consequence of a quasi-infinite serial connection) is employed which is one of the best ways to transport electrical energy at little loss through thin printed conductors.
The first electricity grid-connected organic photovoltaic installation was demonstrated in 2009,11 and recently a solar park based on the Infinity concept2,10 has been inaugurated at DTU. The main motivation of this solar park is the proof-of-concept for OPV in the context of large-scale electrical grid power production with a low environmental footprint. This mind-set is also reflected in the design; from the modules manufacturing, throughout the careful selection of the components based only on sustainability criteria and all the way to the materials in the support structure. For example, a wood-based structure has been used for the solar park since it presents several advantages but mostly due to its truly renewable origin: the emissions released when making a wooden structure as compared to concrete or metallic structures are 3 times lower12 and further wood has advantages such as being corrosion resistant and durable when installed in a fashion that allows it to dry. The fast manner in which the modules are meant to be installed and uninstalled on the structure, the mounting surface, and the number of replacements possible are also reflections of the mind-set.
Lighter forms and rapidly deployable systems, apart from being useful in energy production on a large scale, could potentially provide benefits on a smaller scale as well; such as for example emergency communications in the wake of a disaster – when existing networks have been damaged – or in the case of remote applications integrating sensors that have to send/receive data.13 Therefore, alternative forms of installations based on light plastic structures were designed with the idea of designing a sustainable solution to that challenge. These new concepts are offshore, onshore and airborne light installations that were realized at DTU and they have been proven and analysed in this work. Our concept for offshore installations is foreseen to be lighter and having a lower impact than other offshore systems that comprise conventional inorganic technologies, such as the deployment termed Solar Islands.‡ While these islands are floating and comprise robust rotating platforms for silicon modules, our offshore design can be a really low cost alternative in terms of capital investment since they do not require heavy construction works and steel platforms to support heavy modules. Offshore OPV could complement other offshore energy technologies such as offshore wind farm that produces 160 MW in an area of 20 km2.§ If organic solar modules are placed in between the wind mills occupying 50% of this area, with our present 0.8% total area power conversion efficiency (PCE) solar cells, 80 MW of additional power could be produced. With our first successful prototypes the technological gap between traditional and latest technologies could be filled and be part of portable land or offshore deployment units, by supplying a rapid response service. In addition they are light and can be transported anywhere without being subject to damage due to their flexibility.
2. Life cycle assessment methodology
Until now, large-scale energy producing installations that integrate OPV modules, as the ones presented in this work, have not been built up or even assessed. Evaluating different choices for the deployment of a solar installation requires a methodology that permits us to establish analogies between them. Life cycle assessment (LCA) has proven to be a very powerful tool and very useful so far in the context of OPV spanning the fabrication of modules3–5,14 and applications that include them.15,16 The main reason is that LCA studies provide an image of how this product will eventually impact the environment along its lifespan; but furthermore this tool keeps track of energy forms used in the final product or service, so that we are left with a real picture of what has been taken from nature to give shape to the product or installation. The cumulative energy demand – CED – in primary energy units (MJEPE) accounts for these total energy needs and it has in this work been calculated with our own processing data and the Ecoinvent database. It has served to obtain the energy payback time (EPBT), calculated as the CED divided by the energy that the modules generate in their lifetime (EGEN) following International Energy Agency guidelines.17 Going further we also explore how many times the system returns the energy embedded in its fabrication if any, and this figure is termed energy return of investment (EROI). EGEN and both indicators have been calculated using the following equations, where G is the irradiation in kW h per m2 per year units, PR is the performance ratio,¶η is the module efficiency on the total area and Pp is the power peak installed – all the values considered for the assessment are gathered in Section 4.2.

Cumulative energy demand is correlated with the energy payback time, so the lower is the former the faster the system pays back the energy invested, and that is a way to lower the EPBT. However, there is a reciprocal relationship between EPBT and PCE – since the energy generated by the system, EGEN, depends on the radiation level and on the power conversion efficiency (PCE) of the PV system. While the conversion efficiency is often used as the metric to evaluate the performance and potential usefulness of a technology or system, usually more complex processes or materials are required. It has been discussed elsewhere18 that it may happen that for a particular OPV technology an increase in efficiency is also accompanied by such an increase in CED that balances out and in the end does not result in a shorter EPBT. The most powerful use of LCA, when used to evaluate energy options, is to direct research and development towards a sustainable product rather than being directed by some artificial goal of high power conversion efficiency. The latter is a valiant cause but not at any cost.
Since energy payback time does not take into account the whole scale of the problem at hand or the potential unavailability of elements or components, life cycle impact assessment (LCIA) of the installations has been performed through use of the commonly available LCA software: SimaPro.|| Two methods representing different approaches that are included in this software have been considered. First, CML 2000 was selected as a midpoint method and ReCiPe 2008 for the endpoint approach. Both approaches differ in the way in which the environmental relevance of category indicators is taken into account.19 In the former approach20 relevance is given to the potential for causing damage (problem-oriented), while the latter focuses on the damage in itself (damage-oriented). The CML baseline version includes nine impact categories, from which we have extracted eight. The other method ReCiPe7 is a hybrid method that connects the midpoint and the endpoint-oriented methods, allowing the user to choose. In this work we chose the endpoint methodology and included indicators such as climate change, human toxicity or fossil depletion. The characterisation factors of impacts are expressed in different units (see Table 1) and we have chosen to present them normalized and weighted for a better comparison between the different deployments explored in this work. Therefore, the metric is given in the dimensionless unit Pt, obtained by weighting all the impact loads.
| Impact category | Unit | Reliability in calculation methods |
|---|---|---|
| Cumulative energy demand | MJ EPE | +++ |
| Abiotic depletion | kg eq. Sb | + |
| Global warming potential | g eq. CO2 | +++ |
| Acidification potential | g eq. SO2 | ++ |
| Eutrophication potential | g eq. PO4 | + |
| Photochemical oxidation | g eq. ethylene | + |
| Climate change human health | DALY | + |
| Particular matter formation | DALY | + |
| Ionising radiation | DALY | + |
| Metal depletion | $ | +++ |
| Fossil depletion | $ | +++ |
| Agricultural land occupation | Species, year | + |
| Climate change ecosystems | Species, year | + |
| Urban land occupation | Species, year | + |
| Terrestrial ecotoxicity | kg 1,4 DB | + |
| Ozone layer depletion | kg eq. CFC-11 | + |
| Human toxicity | kg 1,4 DB | + |
The level of uncertainty in the two approaches differs; the endpoint approach has a higher level of uncertainty when compared to midpoint level. Two basic kinds of uncertainties have to be distinguished: the first one is due to the calculation and modelling (used to describe a physical phenomenon), the other one is introduced as far as the inventory dataset may be reliable and accurate. The soundness of every impact indicator is scored (‘+++’ = high reliability to ‘+’ = very low reliability) in Table 1. The scores for the reliability of the calculation methods are representative of today's state of the art for impact assessment within the LCA framework; additional work is in progress to improve the indicators related to human and ecosystem health. The confidence in the inventory dataset in this study is very high, since it builds on real data recorded from pilot-scale production equipment and processes.
A third LCIA methodology was employed to calculate the carbon footprint of the produced modules and their installation in different forms. The Greenhouse Gas Protocol, the most used tool to quantify and manage greenhouse gas emissions, displays four types of carbon emissions: fossil based carbon originating from fossil fuels; biogenic carbon originating from plants and trees; carbon from land transformation; and carbon uptake (i.e. the CO2 that has been stored in plants and trees as they grow).
3. The four installation scenarios
3.1 Solar park installation
The concept of the solar park has been reported in detail in recent publications2,10 and it is constructed using wooden scaffolds and plates that are facing south at an inclination angle of 38 degrees (Fig. 1). Each of the four rows of 100 m long platforms that comprise the solar park has a theoretical mounting area of 250 m2 for solar cells, and the whole solar park setup has a size that is visible using satellite imagery highlighting that OPV has increased enormously in scale.21 Up to 7 stripes of solar cell modules currently manufactured in a width of 305 mm can be mounted side-by-side using a special wagon that holds one roll and moves from one end of the scaffold to the other while rolling out the OPV. Currently the stripes are fixed using weather-proof tape that is attached while rolling out the module. The power output from 6 parallel-connected modules on the platform with a cumulated active area of 88.2 m2 is more than 1330 W at roughly 1 sun illumination that corresponds to an efficiency of more than 1.5% on the active area after burn-in. The average output per stripe was more than 220 W or 2.2 W per meter of Infinity module. For grid-connection, a down conversion of the high voltage system is necessary (the open circuit voltage of each 100 m stretch is above 10.000 V).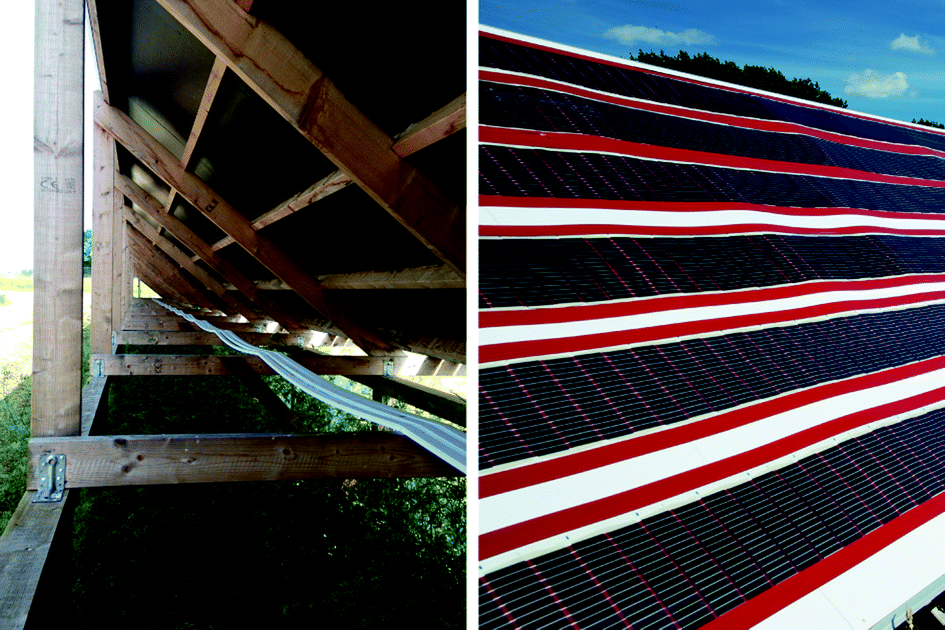 | ||
| Fig. 1 Photograph of the wooden scaffold structure of the solar park installation (left) with six solar cell module stripes mounted on top of PVC plates (right). | ||
3.2 Tube-in-tube concept
The alternative on- and offshore installation designs are based on a self-supporting inflated tube of low density polyethylene (LDPE) with a thickness of 200 μm that have been first built in small dummy setups to learn how to fabricate them in an efficient way. To avoid any air leakage from cable feed-through we developed a tube-in-tube concept where the inner tube is fully sealed. The workflow of setting up the tubes is illustrated in Fig. 2.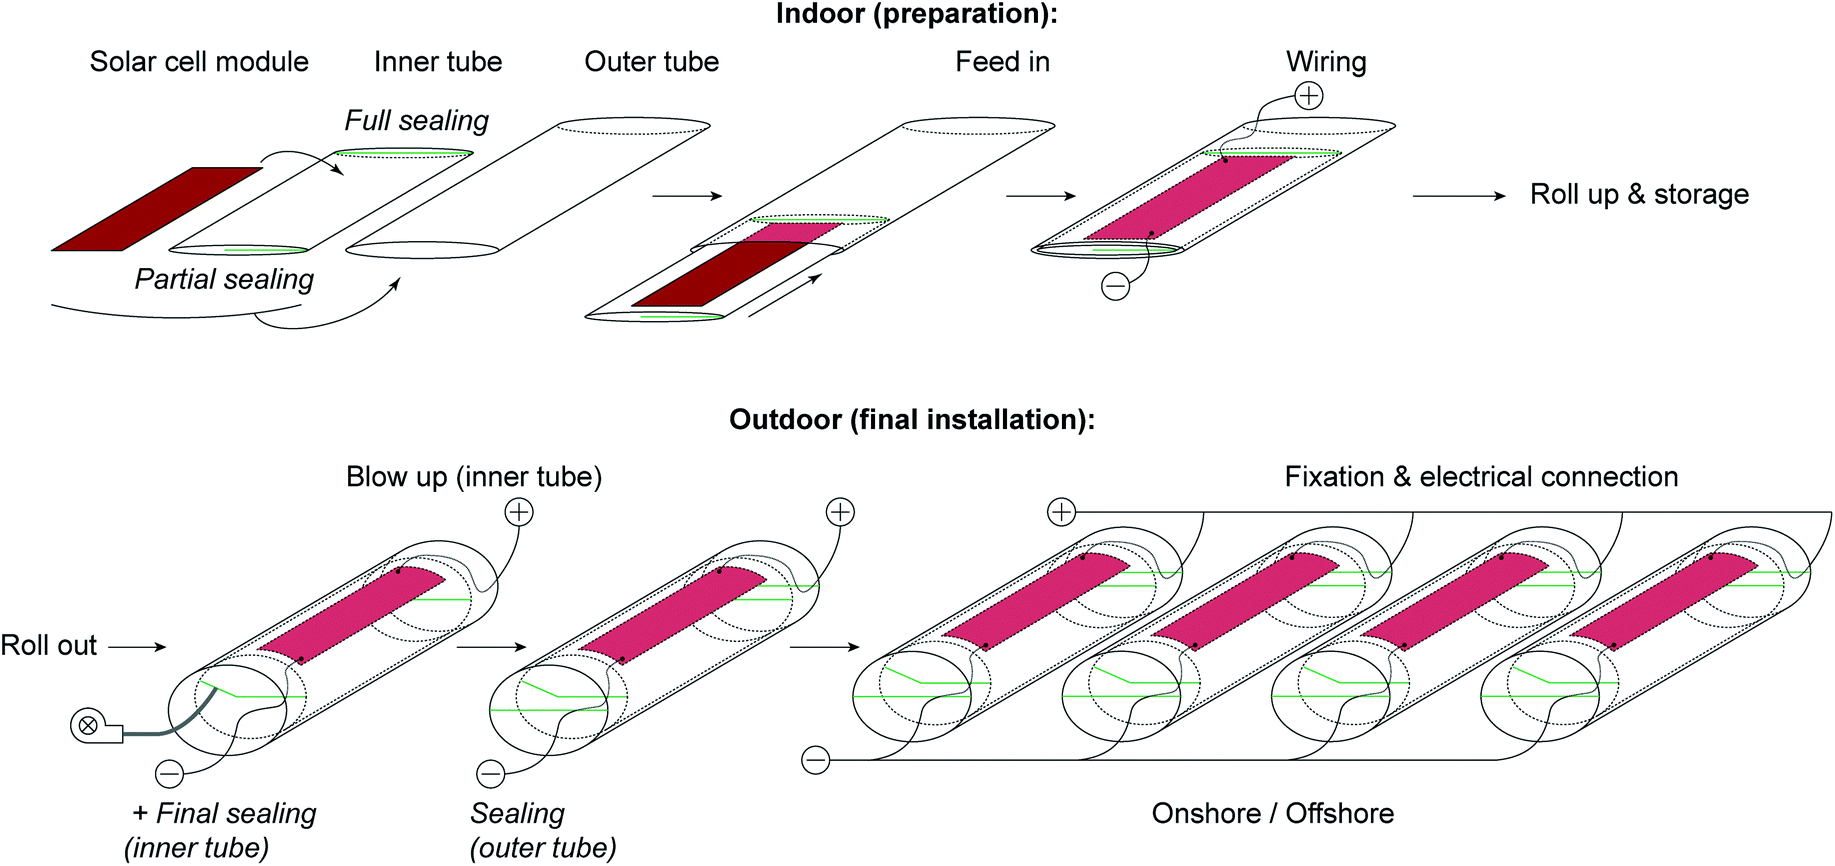 | ||
| Fig. 2 Preparation and installation workflow of the tube-in-tube mounting concept. | ||
We prepared tubes with solar cell module lengths of 3.4 m (Aactiveca. 0.5 m2), 6.8 m (Aactiveca. 1 m2), and 10 m (Aactiveca. 1.5 m2). The inner tubes were slightly longer than the modules, and correspondingly the outer tubes to enable sealing and fixation with ropes (offshore) or hooks (onshore). An automatic sealing machine was used for closing the tubes, leaving one end open for a couple of centimetres to enable the final inflation, which was completed in just 5 seconds. During the preparation, the inner tube and an Infinity solar cell module were fed together into the outer tube. The manual preparation of the sets was feasible up to a module length of 10 meters corresponding to 1 kV open circuit voltage. The solar cells were electrically connected using cables soldered to push buttons that allow a fast mounting with the counterpart of the push button on the module. When the inner tube was inflated the solar cell stripe was fixed by the pressure of the inner tube against the outer one, however the final inclination of solar cells was adjusted by turning the cells and tubes towards the sun.
3.3 Offshore solar tube installation (on water)
The offshore version of the tubes was set up at the pier of DTU Risø campus in the Fjord of Roskilde and had a total of 5 parallel-connected tubes with a total active area of 5 m2. Each tube was connected with ropes to the pier to demonstrate the basic idea of the floating solar installation (we also made pilot experiments with a single tube during the winter of 2013). A photograph of the installation with the cells facing south and an I–V-curve is shown in Fig. 3. The maximum power output was >30 W with an efficiency of 0.6%, which was lower than expected. We ascribe this to some challenges in the installation where the modules experienced some rough handling as a result of the land-to-water method of installation and it is likely that the deployment from a float should be explored in the future. Although the modules are not perfectly inclined we measured almost the same current output from each module. The distance between each tube allows a shadow-free illumination over most of the day. Waves and wind can be seen as the most critical factor that has to be considered for future offshore platforms based on this design. Bending and crumpling on long stretches must be avoided.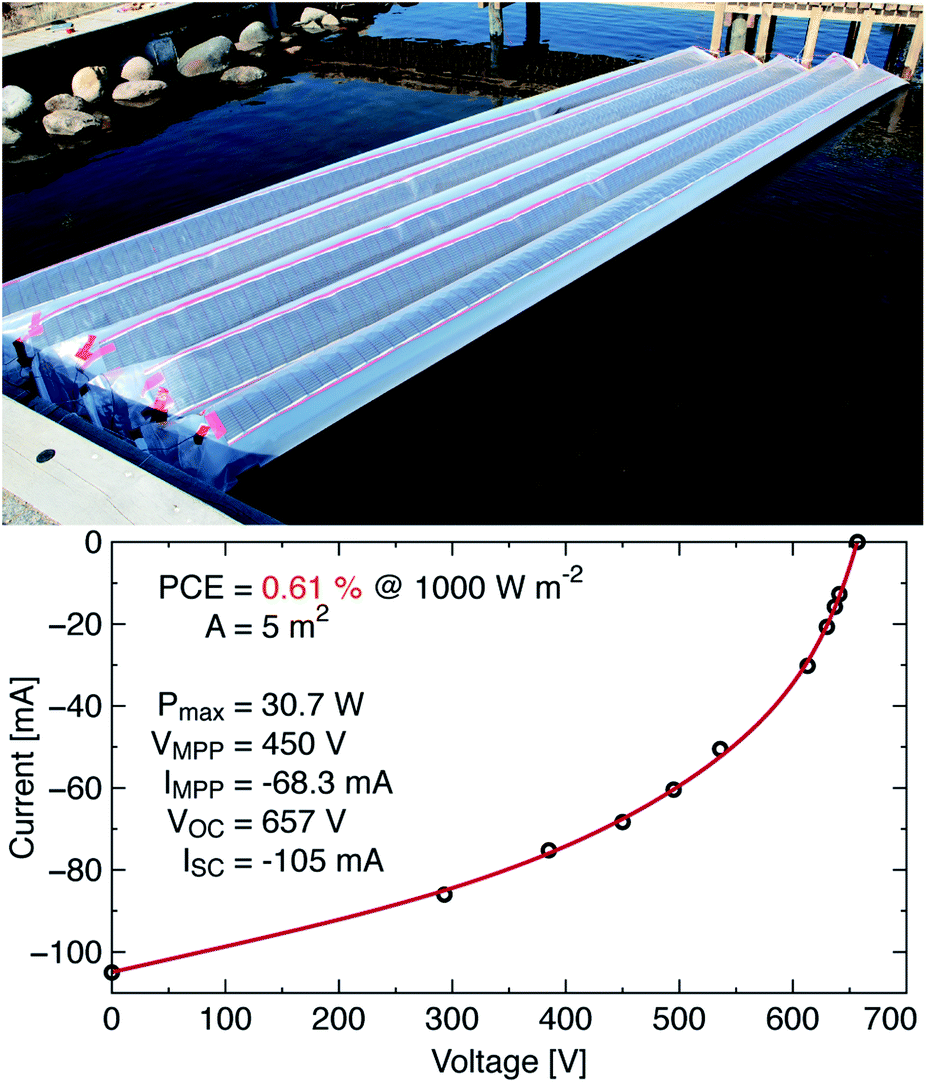 | ||
| Fig. 3 Photograph of the offshore solar cell installation with five tubes of an overall length of ca. 7.5 m (top) and a corresponding I–V-curve (bottom). | ||
3.4 Onshore solar tube installation (on land)
An onshore or ground-based version of the tubes has been installed in the front row of the solar park at DTU. Here a first set of six tubes with 3.4 m long modules (Fig. 4) was extended with six modules of 6.8 m to generate enough power to be handled through the inverter (0.6–1 kV input voltage). Finally, nine 10 m long modules were added to give a total module area of ca. 50 m2. The long tubes were not inflated because of difficulties in keeping the inclination of solar cells stable. Therefore, the flat version of solar cells in LDPE tubes can be seen as a further installation scenario. A photograph of the full setup side by side with the other land-based installations is also shown in Fig. 6. All the tubes were connected to the inverter, delivering around 200 W on average to the grid. Since the tubes were grid-connected on the 5th July 2013, they have performed stably.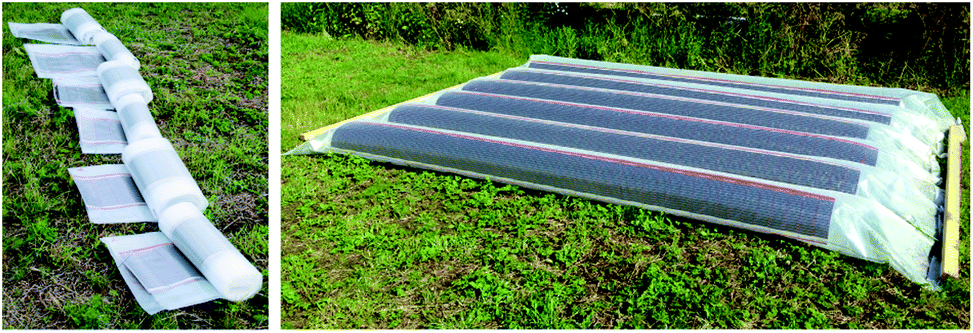 | ||
| Fig. 4 Ground-based onshore solar cell installation with the rolled-up tubes prior to blow-up (left) and the final setup of six 3.4 m solar cell modules (right). | ||
Compared to the properly fixed and inclined solar cells from the wooden solar park structure we saw a drop in efficiency for the solar cell inside the tubes. The main reasons are the different inclinations for each individual tube and in some cases partial shadowing. Furthermore, the opaque LDPE foil blocks some light due to a direct transmittance of 50–70% over the whole visual spectrum. Interestingly, this only results in an 8% drop of efficiency with improved fill factor as can be seen from the normalized I–V-curves in Fig. 5. We ascribe this to part of the transmission loss being due to diffuse scattering, which is collected by the solar cell.
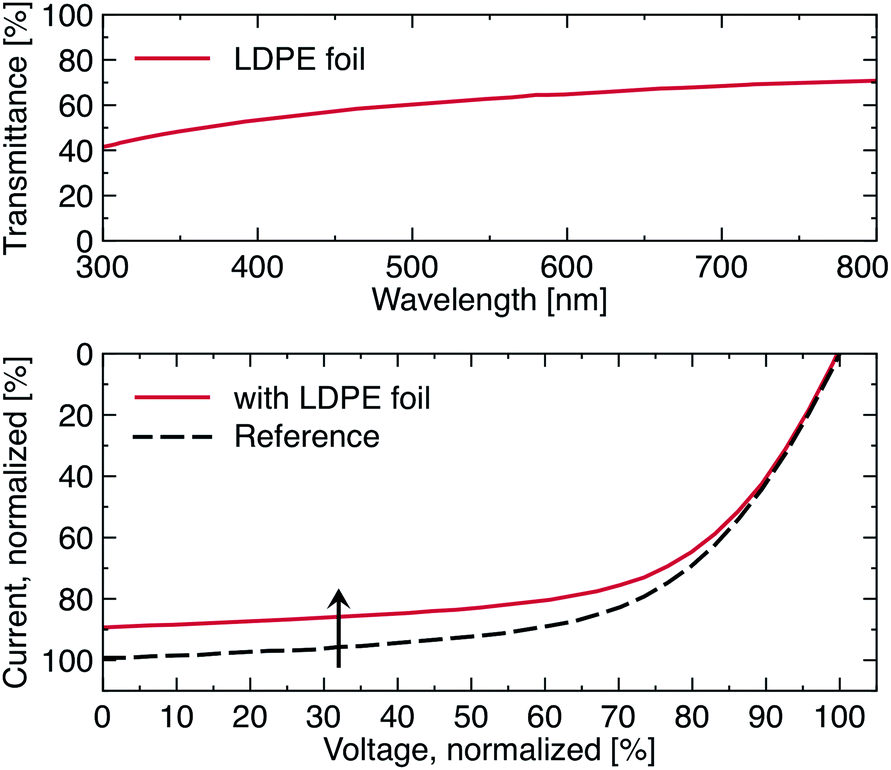 | ||
| Fig. 5 Transmittance spectrum of the opaque LDPE foil that covers the solar cells (top). I–V-curve behaviour of a solar cell with and without LDPE foil on top (bottom). The efficiency drops by 8%. | ||
3.5 Balloon solar installation (balloon)
The last and by far the most experimental installation scenario is the tethered balloon with mounted solar cells. Foils of LDPE with a surface area of 40 m2 were sealed to form a pillow-shaped balloon with the size of 4 m × 5 m along the edges. Five solar cell modules with a combined active area of 2.5 m2 were attached on one half of the top side of the balloon and connected in series to increase the voltage. Long cables enabled a ground-based power extraction. The volume of the idealized pillow shaped helium balloon was calculated so that 17 m3 would generate enough lift and up to 8 kg of additional load. Finally, we filled the balloon with 16 m3 of helium and floated it to a height of roughly 10 m. The balloon was aligned and held with ropes so that the solar cells had a good inclination for the I–V measurements. Photographs and a corresponding I–V-curve are shown in Fig. 6.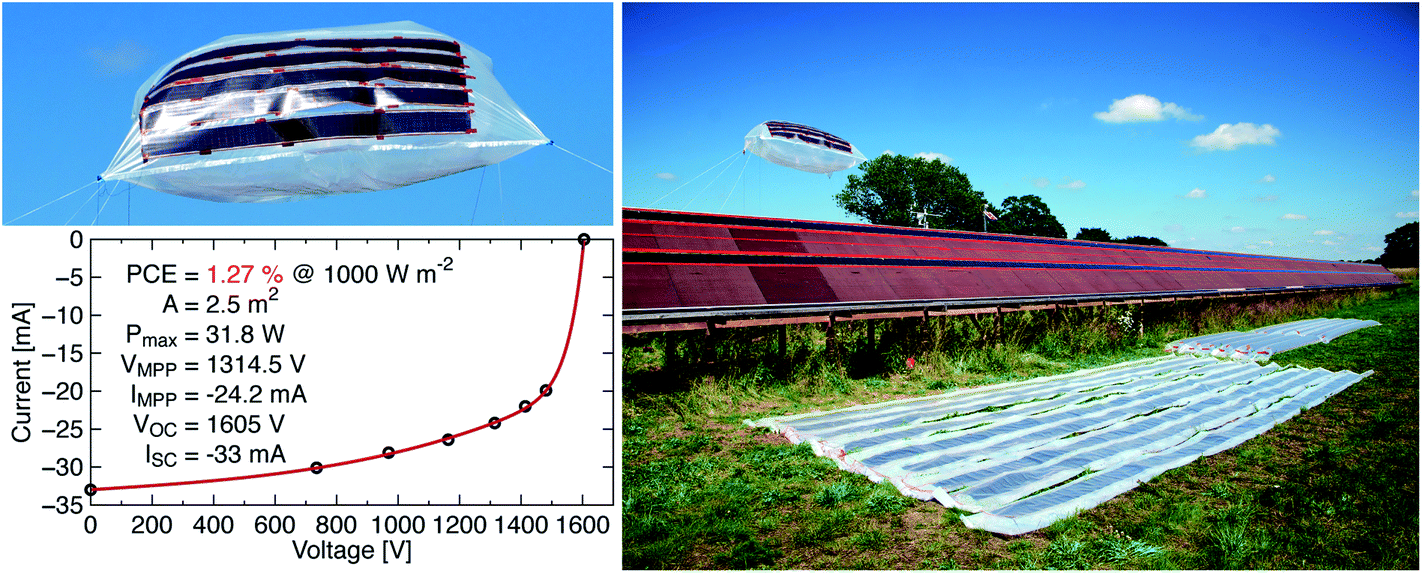 | ||
| Fig. 6 Photograph of the helium-filled balloon with attached solar cells and an I–V-curve (left). The photograph on the right shows three installation scenarios combined – balloon, wooden solar park structure (with just 2 stripes of solar cells), and tubes (flat, and blown-up in the background). | ||
4. The assessment of the OPV installations
The OPV modules are integrated in different structures or installations and they constitute a building block or a structural element; therefore we present a separate and detailed LCA analysis for them in the first section. Following that we have analysed the different balance of systems (BOS) of the different installations in which the modules produced by the same manufacturing route were integrated.4.1 The assessment of the organic modules
Energy analyses of several manufacturing routes for producing organic solar modules in a semi industrial environment have already been performed using the LCA methodology. It was firstly applied for an ITO-based route named ProcessOne3 which highlighted that ITO accounted for an excessive amount of the embodied energy and the direct process energy. This led to development of ITO-free modules following different routes that were analysed using the LCA methodology. Several approaches were studied including an aluminium–chromium electrode,22,23 silver and also carbon based electrodes.5,24 Recently, a preliminary evaluation of the organic solar cell modules was done. They were prepared by the route known as IOne8–10 and were mounted in a solar park and analysed.2 Since our analysis work is always based on a real manufacturing set up and OPV is at an early development stage, slight improvements have been made in the speed, in the power for curing the adhesives, optimisations in printing forms, etc. All these changes can affect from moderately to strongly the needs of energy and materials. We therefore present here a refined analysis of the already published work, with the recent improvements included.The modules are printed on a flexible ITO-free substrate called Flextrode25 that is employed in the Infinity-concept, and which is now free available to academics.21 Thanks to the pattern employed in the Infinity-concept, it is possible to manufacture an infinite serial connection of both cells and modules in the direction of the web thus stepping up voltage along the web or roll. The modules are printed on a plastic barrier substrate from Amcor with a front electrode, PEDOT:PSS and ZnO – taken together this is called the Flextrode. The finalisation of the module is made with the active material, in this case P3HT:PCBM, a second layer of PEDOT:PSS and the silver back electrode. The top encapsulation is made with a UV curable adhesive. This results in an initial 2.2% efficiency on the active area. The module lifetime is 1 year and the functional unit considered for the LCA is one square meter of processed foil, in which the active area is 50% of total area ratio.
We show the results for the calculations on cumulative energy demand for 1 m2 of modules in Fig. 7, where it can be observed that (in agreement with previous studies) the share of the energy that has to be used in the materials still remains two thirds of the total energy and one third being employed in the manufacturing phase of the modules. However, there has been a tremendous optimization of the IOne process with regard to the former routes which is reflected in the achieved reduction of energy required; from the several hundreds of MJEPE that were required for the manufacture of ProcessOne to IOne where only 42.17 MJEPE are needed. In Fig. 7 it is clear that the substrate containing four different materials (the Flextrode) requires a considerable part of the total materials energy. On the other hand the most expensive material in terms of energy to be deposited is by far PEDOT:PSS, due to the slow processing at 2 m min−1 and to the use of infrared lamps for drying it (see ESI for more details on the data†).
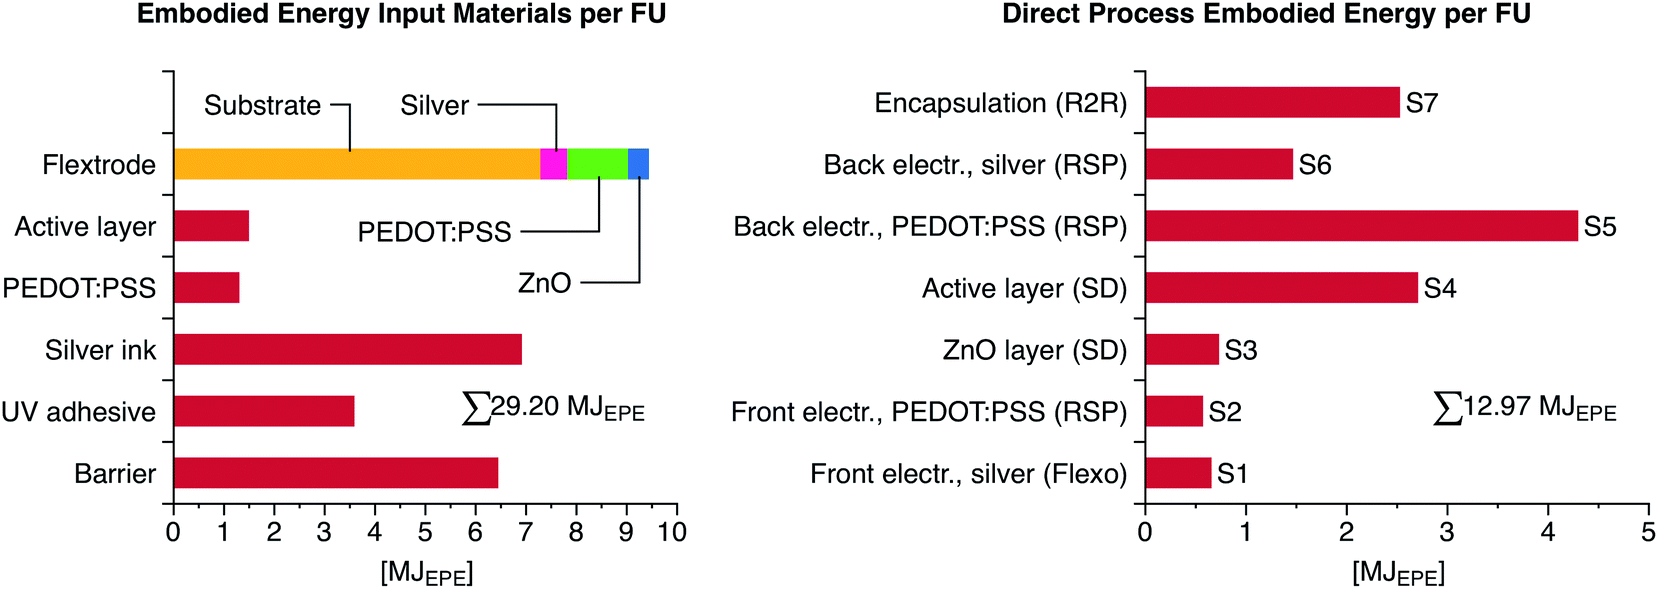 | ||
| Fig. 7 Energy embodied in the materials and spent in the process of manufacturing 1 m2 of organic modules produced with the Infinity pattern. | ||
4.2 The balance of systems assessment
The OPV modules, all of them manufactured in similar batches of 700 m length, were hosted in four different installations: solar park, onshore, offshore and a balloon – all shown in Fig. 3, 4 and 6. Their components and the structures are detailed in Table 2 (see also the ESI†). Each installation was conceived for a different purpose, and therefore had a different size. The solar park was originally devised for the sustainable production of electrical energy from OPV on a large scale, while the tubes and the balloon were envisaged for shorter operational lifetimes, being useful as a portable energy source or in communication systems. Their lifetimes and components employed in the systems are different. The lifetime of the structure defines the lifetime of the system. The wood based solar park is considered to last for 15 years, and since the lifetime of the modules is here assumed to be 1 year it is assumed that 15 replacements of modules will have to take place. In the case of the tubes either if they are onshore or offshore it has been estimated that they last for 2 years. The balloon is only considered to last for one month.| Components | Park | Onshore | Offshore | Balloon |
|---|---|---|---|---|
| a An estimated inverter has been considered for the accountancy, although 6 kW was used in these experiments. | ||||
| OPV module area | 960 m2 | 50 m2 | 10 m2 | 2.5 m2 |
| Structure | 17 m3 wood, 960 m2 supportive PVC, 1 cm | 45 kg LDPE, 200 μm | 10 kg LDPE, 200 μm | 5.40 kg LDPE, 200 μm |
| Inverter | Inverter 6 kW Danfoss, TLX series | Inverter 50 Wa | Inverter 250 W | Inverter 37 W |
| Cabling (copper wire) | 500 m, 10 mm2 | 82 m, 2.5 mm2 | 40 m, 2.5 mm2 | 30 m, 2.5 mm2 |
| Wagon station | 35 m aluminium profiles | — | — | — |
| Power installed (Wp) | 7860 | 403.2 | 80 | 20 |
| Lifetime of the system | 15 years | 2 years | 2 years | 1 month |
In the search for sustainable materials for the solar park scaffold, as the platform that serve for the installation/deinstallation of the modules wood was chosen as shown in Fig. 1. The energy embedded in the scaffold has been taken as the average from a relevant study21 and from the Ecoinvent database,26 resulting roughly in 270 GJEPE. We have explored using wood as the mounting surface but have also explored other mounting surfaces to ensure a more even surface in the joints between mounting plates and also to observe differences in electrical insulation. PVC foam plus wood was thus chosen in this study on the scale of 250 m2 each. While other materials are possible the purpose here was not to exhaustively test all conceivable materials but rather to take two at opposite ends of the scale in terms of sustainability (wood is best, PVC is worst) and see how they impact the overall picture. So the combination PVC foam plus wood resulted in a CED of 615.7 GJEPE with data taken from Ecoinvent database.
For the other deployments, a much lighter structure made of low-density polyethylene (LDPE) tubes served as a support for onshore and offshore tubes, already explained in the previous section. Plastic film, LDPE, with a thickness of 200 μm was used, resulting in 3.5 and 1 GJEPE, respectively for onshore and offshore installations.
The cabling in the solar park is guided back from the end of each row (where the positive and negative terminals of the series are) to the middle of the rows and from thereon they are led through a subterranean tube to a hut with the inverter. The copper, cables and associated materials for their conduction to the endpoint were included in this study, but the hut was not. For the onshore tube installation, the cabling was guided in the same manner through the same system. For the other deployments cabling was 2.5 mm2 section insulated copper cable, with an energy that was extracted from the Energy Inventory from Bath University.27
The cabling reaches the inverter inside the hut. This inverter detailed in Table 2 has been used for all installations, which may be evidently oversized for the onshore and offshore tubes, and for the balloon system. For the LCA calculations of each system the energy needed for an ideal inverter with right power has been scaled and taken into account.
Results are shown in Fig. 8. In the energy invested in the structure for the solar park, the introduction of PVC as the mounting surface has a strong impact; it almost doubles the embodied energy thus underlining the need to use sustainable low energy materials as mounting surfaces. Wood alone is here found to be the best choice. In all the installations the energy embodied in the structure accounts from 47% to 55% with respect to the total energy for the installation, while the modules represent from 22% to 50%. Inverters and cabling energy represent a little amount, being in all cases below 1%. For the balloon, a big share is embedded in helium that accounts for 21% of the total energy – see ESI† for details on the data.
 | ||
| Fig. 8 Breakdown of cumulative energy demand required for every component in the balance of system of each installation (shown in percentages). | ||
After all the accountancy, the solar park including PVC embeds a total of 670 GJEPE, the onshore tubes account for 5.25 GJEPE, the offshore for 1.61 GJEPE and the balloon for 0.95 GJEPE. However, since they were all built in different sizes, in order to make fair comparisons, for each installation all the requirements of energy have been scaled to 1 m2 of installed OPV modules per year of lifetime. So we have therefore scaled the energy requirements for the structure, cabling, inverter and other elements that were necessary for 1 m2 of OPV modules and have then made the comparison. Once scaled, the solar park is still the deployment with the highest energy associated, even though they all fall close ranging from 83 to 180 MJEPE per m2 per year. Table 3 illustrates this comparison of the installations and also shows the kind of energy that is required.
| Park | Onshore | Offshore | Balloon | |
|---|---|---|---|---|
| BOS component | ||||
| Support/structure (MJEPE m−2) | 54.71 | 40.01 | 46.03 | 96.89 |
| Inverter (MJEPE m−2) | 0.61 | 0.61 | 0.61 | 0.61 |
| Cabling (MJEPE m−2) | 0.08 | 0.25 | 0.62 | 1.86 |
| Others (MJEPE m−2) (Wagon station/helium) | 0.88 | — | — | 38.66 |
| Modules (MJEPE m−2) | 42.17 | 42.17 | 42.17 | 42.17 |
| Total | 98.45 | 83.05 | 89.43 | 180.20 |
| E GEN (MJEPE per m2 per year) | 111.90 | 111.90 | 111.90 | 111.90 |
| EPBT (years) | 0.88 | 0.74 | 0.80 | 1.61 |
| EROI (L/EPBT) | 17.04 | 2.50 | 2.69 | 0.05 |
The first stripes of modules were installed in the solar park already in August 2012 though they could not be connected to the grid unattended due to a high voltage regulation. However, the tubes were grid-connected on the 5th July 2013 and the electricity output was logged: 1 kW h per sunny day has been summed up from the start date. In order to see whether the assumed conditions – for a southern location – were overestimated, a dynamic EPBT for the onshore tube installation was estimated based on the real data. This real EPBT, plotted in Fig. 9, is based on the actual energy produced during summertime in Denmark and fed into the Danish electricity grid. We found the real EPBT was 30% larger than the theoretical in Table 3. The plot in Fig. 9 shows how the EPBT started being 400 years and rapidly decreased to reach a 1.1 years level at the end of the first year of operation.
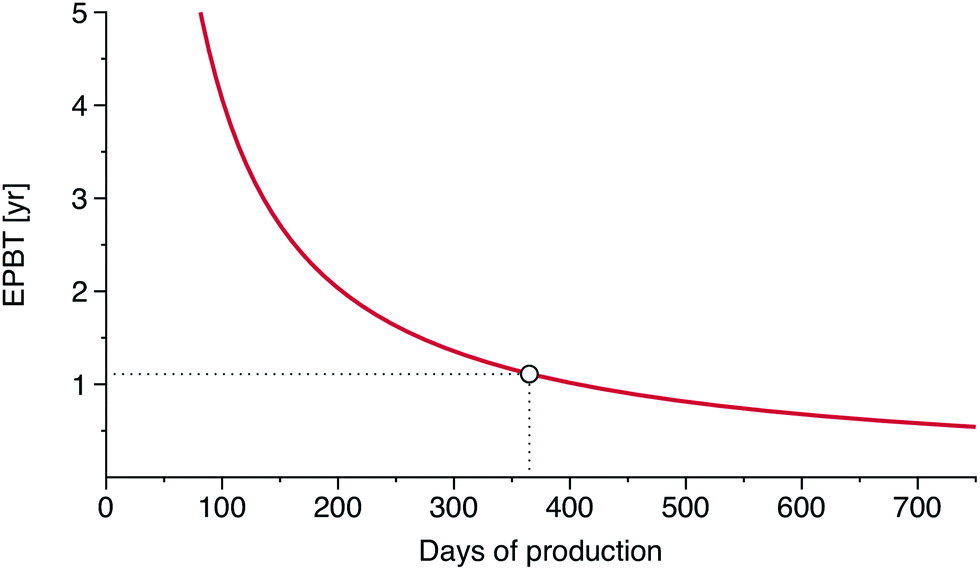 | ||
| Fig. 9 Energy payback time in years for the onshore tube installation, based on real energy produced and fed into the Danish electricity grid. The dot marks one year of energy production where the energy embedded would be almost paid back (EPBT = 1.11 years). | ||
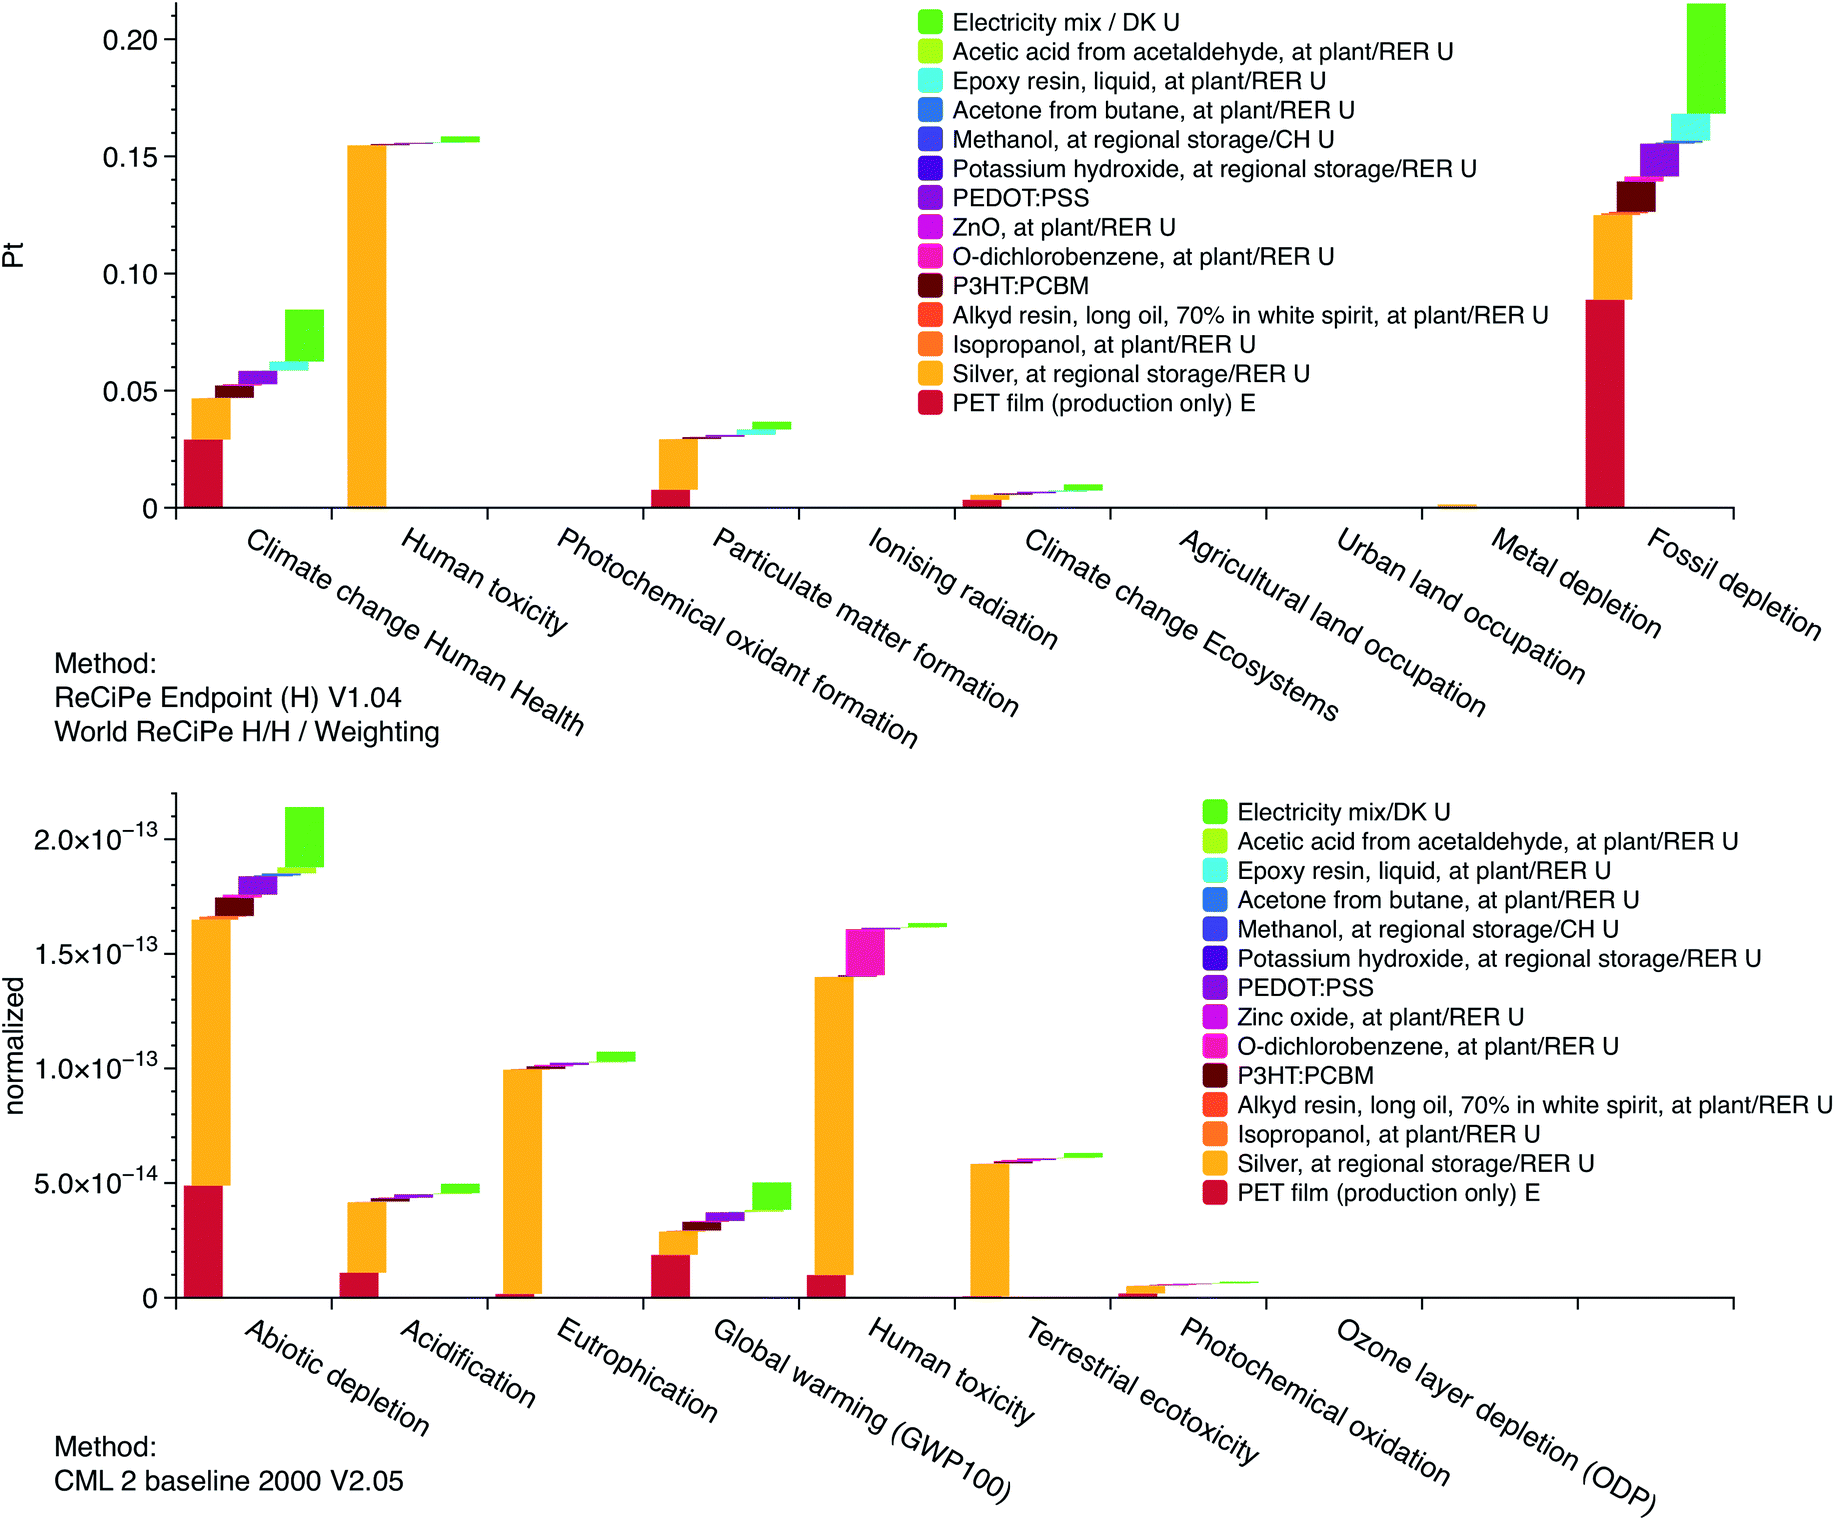 | ||
| Fig. 10 Weighted environmental impacts of OPV modules analyzed by ReCiPe (top graph) and normalized impacts by CML (bottom graph). Both are LCA methodologies available in SimaPro. RER stands for average Europe and U for unit process in SimaPro. | ||
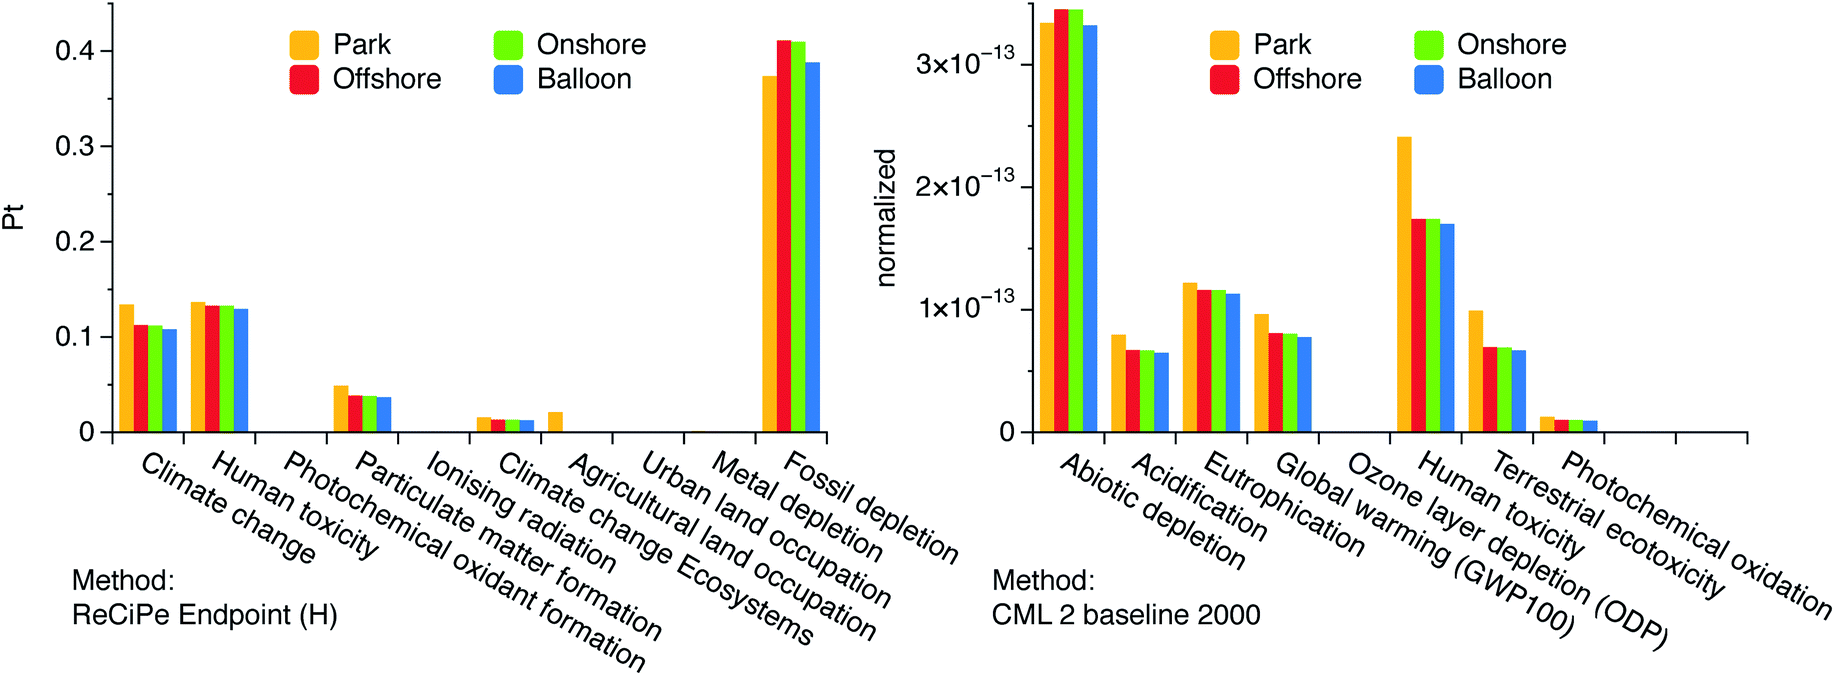 | ||
| Fig. 11 Environmental impact of the four installations by two different assessment methods in SimaPro: CML and ReCiPe. | ||
For the modules produced by the Infinity route, silver accounts for 45% of the total impact by ReCiPe and 68% of the categories of CML methodology; thus underlining that efficient recycling schemes for silver needs to be developed or that silver must be entirely avoided in the finally refined OPV technology. The fossil fuel depletion category is highly impacted with respect to the others and the main cause is the use of PET and electricity.
The most impacted category from the CML method is in every case abiotic depletion with ca. 40%, and then human toxicity. For the offshore, onshore and the balloon system the OPV modules are responsible for this impact with a 50% share, followed by the LDPE plastic foil. In the solar park however the use of PVC causes 60% of the impact in all categories, yet again highlighting the need for carefully choosing the material used as a mounting surface.
Using the ReCiPe methodology, we found similar results. Fossil fuel depletion is the most impacted category for all the installations up to 67% in the case of the balloon, and even for the modules. For the onshore and offshore installations, and the balloon the source of the fossil depletion is the LDPE plastic foil, while in the solar park it is due to the PVC (when used).
We have also applied the Greenhouse Gas Protocol embedded in SimaPro to calculate the equivalent CO2 in kilograms per functional unit of module produced. And we found that the corresponding emissions were a total of 2.94 kg CO2eq., that if rated per kW h of energy produced (known as the emission factor) amounts to 57.55 g of equivalent CO2 (detailed in Fig. 12). The latest publications in the PV field state emission factors for thin-film technologies ranging between 57 and 17 g of equivalent CO2.1 Therefore it is clear that OPV is well placed in comparison with well-established PV technologies when tackling environmental issues.
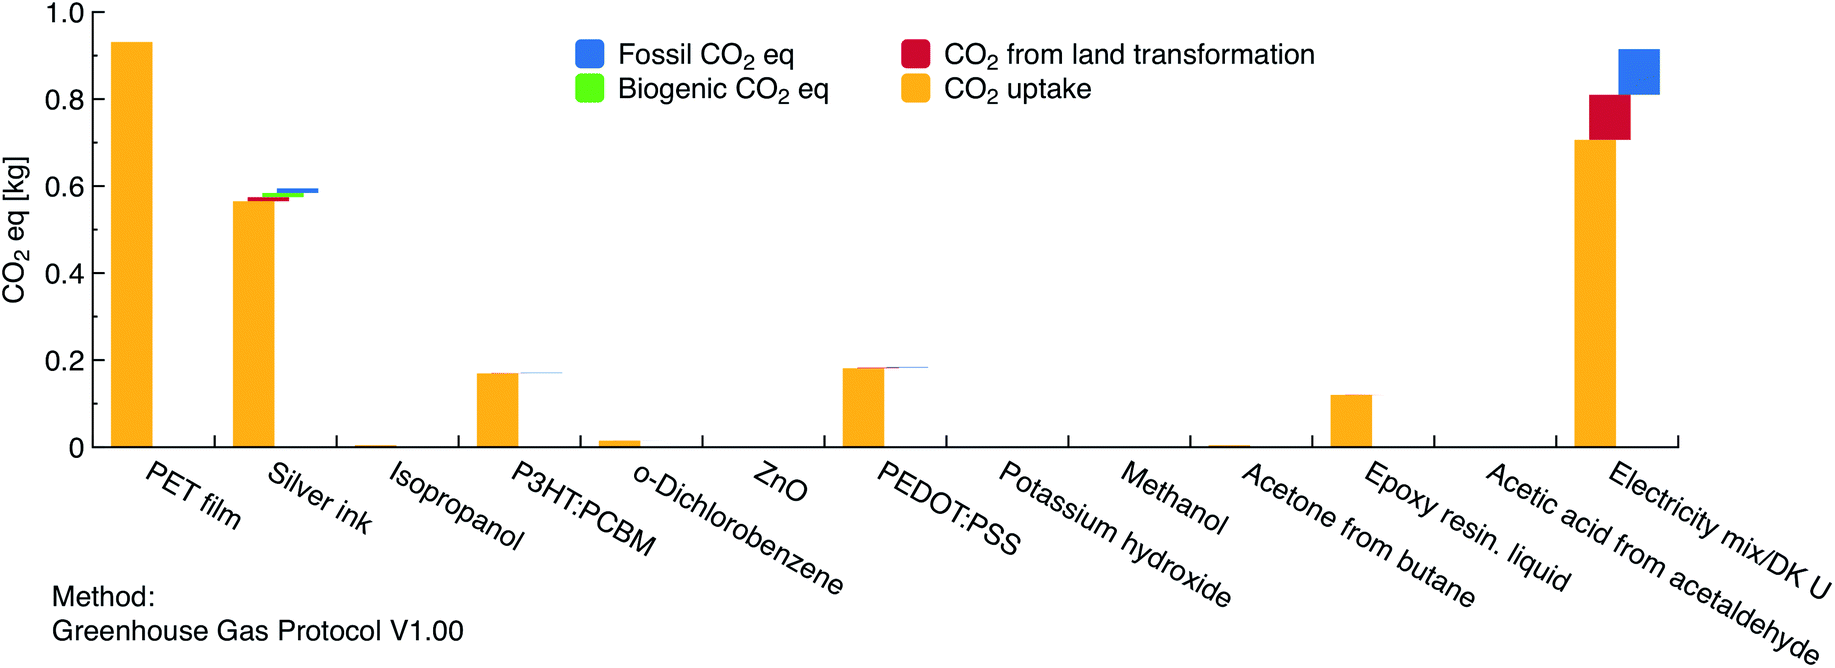 | ||
| Fig. 12 Greenhouse gas emissions corresponding to one square meter of organic solar cells prepared by the IOne manufacturing route. | ||
5. Discussion
The polymer and organic solar cell has been the subject of intense study with the aim of realising the vision of a low cost widely distributed green energy producing technology. As a photovoltaic technology the organic solar cell is distinct from the other photovoltaic technologies but it is also an extremely diverse solar cell. The record efficiency is claimed to be very high and approaching other thin film photovoltaics30 whereas a sober view of the current status is best found by looking at all the organic solar cell data published and comparing this to other PV technologies. In a recent database study this enormous task was undertaken and it does show that the organic solar cell as a general rule falls below all other technologies.31 This of course does not rule out the fact that the technology can be developed to reach the record efficiencies claimed in a few laboratories but it does show that the majority of competent researchers fall short of reaching the claimed potential. A question one could ask is whether the currently reachable performance is sufficient on its own such that efforts in scaling and development of methods can be pursued. It is likely that such developments can be carried out in parallel with performance enhancing efforts and if they can co-develop such that the future high performing OPV is directly compatible with the scaling and deployment methods then time is saved. Scaling and deployment efforts can also establish if OPV is already good enough as it is, or alternatively give an accurate view of exactly how good the performance will have to be before it is viable. It is clear that OPV has advantages that no other PV technology has. It is also clear that OPV has disadvantages that are mostly associated with low performance and relatively short stability. In terms of stability, OPV is still inferior to i.e. crystalline silicon. OPV however does seem to exhibit outside stability of several years as this has been demonstrated in several independent studies.32,33 One advantage is that the OPV can be fully printed and this enables the manufacture of endless solar cell foil that following the Infinity concept can be cut to any length and most interestingly that the performance is independent of the length of foil (at least up to 700 metres). It has been demonstrated for 100 metre stretches of foil that there is no difference in performance between a single cell and more than twenty thousand solar cells connected in series. This fact is unique and it enables the printing of interconnections such that no extra wires or strings need to be applied in post-production steps to make a module, one could say that the roll of solar cell is the module regardless of size. This simple fact has enormous implications when it comes to scaling since the question of scalability is reduced to clever ways of deployment rather than having to deal also with manual issues of contacting and connecting single devices into modules and systems post-production. We already demonstrated that the polymer solar cell can have an energy payback below one year even when manufactured under laboratory conditions.2 The objective of the present work was to progress beyond what is possible with conventional solar cells and identify novel methods of fast and low impact deployment that has not been possible hitherto.The solar park that we already had explored has served as a starting point and we have analysed this with respect to the impact that small changes in the scaffold would have on its energy balance. In the calculation the building time of the scaffold has been neglected. The result has been found to be sensitive while not extraordinarily sensitive (we showed it here for PVC mounting plates). We then progressed beyond this to establish if a low cost technology that can be readily deployed could be subject to simple installation means, and if possible it would enable us to explore territories that are not easily accessible with traditional solar cells. Most traditional solar cells are heavy and rigid thus making them difficult to deploy in a different context than on-land. The polymer solar cells are light and flexible thus potentially enabling one to explore both airborne and waterborne installation methods. We chose polyethylene as the carrier material simply because of its availability and flexibility. We developed the concept of having the solar cell laminated between two tubes where the inner tube could be air filled (Fig. 2). The inner tube could be air-filled and its deployment worked equally well on land or on the surface of sea water (Fig. 3, 4 and 6). When installing on land one could also simply avoid air filling the inner tube. Nevertheless, the air filling is likely to be the most robust method with respect to precipitation in the form of rain or snow. The airborne experiment was mostly included to demonstrate that the lightness enables it but it is unlikely to be practical in the long run simply because tethering is a challenge over time when subject to weathering. This is also true for both land based and water based installations but the requirements are less strict and most straightforward for the land based version. One surprising outcome is that the energy payback time for the entire on-shore installation is just over 1 year based on the actual data which is very significant since the calculation included everything. We can conclude that both the on-shore and the water surface installations are viable methods of deployment of OPV modules. In response to one of the reviewer comments we also explored the effect of salt spray and dried salt on the solar cells surface which can be expected for the off-shore installation (even if we did not observe it). This demonstrated a relatively small drop in efficiency similar to the LDPE foil employed in the tubes which we ascribe to the optically transparent nature of sea salt which scatters light (see ESI†).
6. Outlook
There is a large gap between the average performance that can be reached for polymer cells and the best reported data. As this gap hopefully closes the polymer solar cell will move from being an already viable technology to a highly competitive energy technology. We have shown that currently available OPV technology can be manufactured and deployed in a setting where the energy is delivered back during the lifetime of the solar cell. When the performance gap is closed the polymer solar cell will outperform many if not all known energy technologies in terms of manufacturing speed, scalability, speed of deployment and removal, environmental foot print and energy payback time. If significant research efforts were focussed on closing the gap in the relevant polymer solar cell technology, i.e. the Infinity concept, then the ambitious goal of a fossil free future will move remarkably close.Acknowledgements
This work has been supported by Energinet.dk (project no. 10728) and by the Danish Ministry of Science, Innovation and Higher Education under a Sapere Aude Top Scientist grant (no. DFF – 1335-00037A).References
- H. C. Kim, V. Fthenakis, J.-K. Choi and D. E. Turney, J. Ind. Ecol., 2012, 16, S110–S121 CrossRef CAS.
- F. C. Krebs, N. Espinosa, M. Hösel, R. R. Søndergaard and M. Jørgensen, Adv. Mater., 2014, 26, 26–39 CrossRef.
- N. Espinosa, R. García-Valverde, A. Urbina and F. C. Krebs, Sol. Energy Mater. Sol. Cells, 2011, 95, 1293–1302 CrossRef CAS PubMed.
- A. L. Roes, E. A. Alsema, K. Blok and M. K. Patel, Progress in Photovoltaics: Research and Applications, 2009, 17, 372–393 CrossRef CAS.
- N. Espinosa, M. Hösel, D. Angmo and F. C. Krebs, Energy Environ. Sci., 2012, 5, 5117–5132 CAS.
- J. Peng, L. Lu and H. Yang, Renewable Sustainable Energy Rev., 2013, 19, 255–274 CrossRef CAS PubMed.
- M. Goedkoop, R. Heijungs, M. Huijbregts, A. De Schryver, J. Struijs and R. Van Zelm, A life cycle impact assessment method which comprises harmonised category indicators at the midpoint and the endpoint level, ReCiPe 2008, 2009.
- D. Angmo, S. A. Gevorgyan, T. T. Larsen-Olsen, R. R. Søndergaard, M. Hösel, M. Jørgensen, R. Gupta, G. U. Kulkarni and F. C. Krebs, Org. Electron., 2013, 14, 984–994 CrossRef CAS PubMed.
- J.-S. Yu, I. Kim, J.-S. Kim, J. Jo, T. T. Larsen-Olsen, R. R. Søndergaard, M. Hösel, D. Angmo, M. Jørgensen and F. C. Krebs, Nanoscale, 2012, 4, 6032–6040 RSC.
- P. Sommer-Larsen, M. Jørgensen, R. R. Søndergaard, M. Hösel and F. C. Krebs, Energy Technol., 2013, 1, 15–19 Search PubMed.
- A. J. Medford, M. R. Lilliedal, M. Jørgensen, D. Aarø, H. Pakalski, J. Fyenbo and F. C. Krebs, Opt. Express, 2010, 18, A272 CrossRef CAS PubMed.
- Å. Jönsson, T. Björklund and A.-M. Tillman, Int. J. Life Cycle Assess., 1998, 3, 216–224 CrossRef.
- A. Valcarce, T. Rasheed, K. Gomez, S. Kandeepan, L. Reynaud, R. Hermenier, A. Munari, M. Mohorcic, M. Smolnikar and I. Bucaille, in Personal Satellite Services, ed. R. Dhaou, A.-L. Beylot, M.-J. Montpetit, D. Lucani and L. Mucchi, Springer International Publishing, Cham, 2013, pp. 13–25 Search PubMed.
- R. García-Valverde, J. A. Cherni and A. Urbina, Progress in Photovoltaics: Research and Applications, 2010, 18, 535–558 CrossRef.
- N. Espinosa, R. García-Valverde and F. C. Krebs, Energy Environ. Sci., 2011, 4, 1547–1557 CAS.
- N. Espinosa, F. O. Lenzmann, S. Ryley, D. Angmo, M. Hösel, R. R. Søndergaard, D. Huss, S. Dafinger, S. Gritsch, J. M. Kroon, M. Jørgensen and F. C. Krebs, J. Mater. Chem. A, 2013, 1, 7037–7040 CAS.
- V. Fthenakis, R. Frischknecht, M. Raugei, H. C. Kim, E. A. Alsema, M. Held and M. J. de Wild-Scholten, Methodology Guidelines on Life Cycle Assessment of Photovoltaic Electricity, International Energy Agency, 2011 Search PubMed.
- N. Espinosa and F. C. Krebs, Sol. Energy Mater. Sol. Cells, 2014, 120, 692–700 CrossRef CAS PubMed.
- J. C. Bare, P. Hofstetter, D. W. Pennington and H. A. U. Haes, Int. J. Life Cycle Assess., 2000, 5, 319–326 CrossRef.
- J. B. Guinee, Handbook on Life Cycle Assessment: Operational Guide to the ISO Standards, Kluwer Academic Publishers, Dordrecht, 2002 Search PubMed.
- http://Plasticphotovoltaics.org .
- M. Manceau, D. Angmo, M. Jørgensen and F. C. Krebs, Org. Electron., 2011, 12, 566–574 CrossRef CAS PubMed.
- N. Espinosa, R. García-Valverde, A. Urbina, F. Lenzmann, M. Manceau, D. Angmo and F. C. Krebs, Sol. Energy Mater. Sol. Cells, 2012, 97, 3–13 CrossRef CAS PubMed.
- D. Angmo, M. Hösel and F. C. Krebs, Sol. Energy Mater. Sol. Cells, 2012, 107, 329–336 CrossRef CAS PubMed.
- M. Hösel, R. R. Søndergaard, M. Jørgensen and F. C. Krebs, Energy Technol., 2013, 1, 102–107 CrossRef.
- http://Ecoinvent.ch .
- C. Jones, Inventory Carbon Energy V2, Bath University, HammondJones, 2011 Search PubMed.
- S. A. Mann, M. J. de Wild-Scholten, V. M. Fthenakis, W. G. J. H. M. van Sark and W. C. Sinke, Progress in Photovoltaics: Research and Applications, 2013 DOI:10.1002/pip.2363.
- M. A. J. Huijbregts, L. Breedveld, G. Huppes, A. de Koning, L. van Oers and S. Suh, J. Cleaner Prod., 2003, 11, 737–748 CrossRef.
- M. A. Green, K. Emery, Y. Hishikawa, W. Warta and E. D. Dunlop, Progress in Photovoltaics: Research and Applications, 2013, 21, 827–837 CrossRef.
- M. Jørgensen, J. E. Carlé, R. R. Søndergaard, M. Lauritzen, N. A. Dagnæs-Hansen, S. L. Byskov, T. R. Andersen, T. T. Larsen-Olsen, A. P. L. Böttiger, B. Andreasen, L. Fu, L. Zuo, Y. Liu, E. Bundgaard, X. Zhan, H. Chen and F. C. Krebs, Sol. Energy Mater. Sol. Cells, 2013, 119, 84–93 CrossRef PubMed.
- M. Jørgensen, K. Norrman and F. C. Krebs, Sol. Energy Mater. Sol. Cells, 2008, 92, 686–714 CrossRef PubMed.
- J. A. Hauch, P. Schilinsky, S. A. Choulis, R. Childers, M. Biele and C. J. Brabec, Sol. Energy Mater. Sol. Cells, 2008, 92, 727–731 CrossRef CAS PubMed.
Footnotes |
| † Electronic supplementary information (ESI) available. See DOI: 10.1039/c3ee43212b |
| ‡ Solar island prototype in Switzerland. http://www.solar-islands.com. |
| § Based on data from Horns Rev 1 Offshore Wind Farm in Blåvandshuk (Denmark). |
| ¶ Performance ratio is the internationally introduced measure for an entire PV system. It accounts for the overall effect of losses due to array temperature, incomplete utilization of the irradiation and failures of the system components. |
| || SimaPro Sotfware 7.3.3, PRE Consultants, 2011. |
| This journal is © The Royal Society of Chemistry 2014 |