 Open Access Article
Nanocasted synthesis of ordered mesoporous cerium iron mixed oxide and its excellent performances for As(V) and Cr(VI) removal from aqueous solutions†
Bo
Chen
a,
Zhiliang
Zhu
*a,
Jun
Hong
a,
Zhipan
Wen
a,
Jie
Ma
a,
Yanling
Qiu
a and
Junhong
Chen
*ab
aState Key Laboratory of Pollution Control and Resource Reuse, College of Environmental Science and Engineering, Tongji University, Shanghai 200092, China. E-mail: zzl@tongji.edu.cn; Fax: +86-21-65984626; Tel: +86-21-65982426
bDepartment of Mechanical Engineering, University of Wisconsin-Milwaukee, Milwaukee, WI 53211, USA
First published on 9th May 2014
Abstract
A novel ordered mesoporous cerium iron mixed oxide (OMCI) with high specific surface area and uniform and well-interconnected mesopores was synthesized through the nanocasting strategy using mesoporous silica (KIT-6) as a hard template. The obtained OMCI was used as an adsorbent to remove As(V) or Cr(VI) anions from aqueous solutions, and exhibited excellent performances with the maximum adsorption capacities of ∼106.2 and ∼75.36 mg g−1 for As(V) and Cr(VI), respectively. A mechanism study showed that both Fe and Ce compositions participated in the As(V) or Cr(VI) adsorption process, and complex interactions were involved, including electrostatic attraction and the replacement of hydroxyl groups to form anionic negatively charged inner-sphere surface complexes. The OMCI material could be easily regenerated and reused while maintaining high adsorption capacities for As(V) and Cr(VI). Owing to their integrated features including high specific surface area, uniform and well-interconnected mesopores and specific acid–base surface properties, the synthesized OMCI material is expected to have good potential for the decontamination of As(V) or Cr(VI) polluted waters.
Introduction
The decontamination of heavy metals from water systems is one of the most pressing issues in water environment protection. Adsorption has been proven to be one of the most efficient ways to efficiently reduce the release of heavy metal pollutants, with the advantages of having high removal efficiency, simplicity of operation, low cost, and high recycle rate without any harmful by-products.1–4 Recently, various kinds of adsorbents have been exploited, such as activated carbon,5 metallic minerals and metal oxide based materials,6–10 biomasses,11 functional carbon-based nanomaterials12–14 and so on. Among these materials, bimetal oxides have become a growing concern of scholars due to their abundant resources, simple preparation, reusable properties as well as superior performances for heavy metal adsorption.15–20As is well known, the most important requirement for an excellent adsorbent is a large interface for pollutants. Thus, porous materials are widely considered as potential adsorbents because of their intrinsic large surface areas. In this regard, ordered mesoporous materials (OMMs) possess high specific surface areas, regular and tunable pore sizes, large pore volumes, as well as stable and interconnected frameworks with active pore surface for easy modification or functionalization, thus meeting the requirements as promising adsorbents excellently.1 Since the discovery of a series of mesoporous molecular sieves, intensive research has been conducted to design mesoporous materials applied in the field of environment protection including photocatalysis and adsorption.1,21,22 Compared with common metal oxides, the oxides with mesoporous structures have some unique physicochemical performances, such as large pore volume and specific surface area, highly ordered porous channels and adjustable pore diameters. Mesoporous metal oxides can be prepared via soft (cooperative assembly)23 and hard template (nanocasting) routes.24 A large number of mesoporous bimetal oxides have been synthesized through the cooperative assembly pathway.25–27 However, the direct synthesis of mesoporous metal oxides with a soft template is not easy to control the hydrolysis and polymerization process of these metal alkoxides. Moreover, the mesoporous oxides prepared via soft templating display poor pore ordering and low thermal stability after template removal.28 Ryoo and coworkers pioneered the nanocasting route,29 by which they synthesized metal oxides by taking the place of the void of the hard template, resulting in the restriction of oxides growth and the facilitation of mesostructure formation. Recently, lots of metal oxides or mixed metal oxides with higher thermostability have been successfully synthesized via the nanocasting pathway.30–33 Most of these OMMs have been widely used as the catalysts or the supports of catalysts due to their special properties.34 Chen and coworkers synthesized monodisperse mesoporous zirconium titanium oxide microspheres with high surface areas for Cr(VI) anions removal and the results showed an excellent capacity for Cr(VI) adsorption due to the abundant active hydroxyl groups on the surface.25 However, studies on the application of the thermo-stable ordered mesoporous oxides or mixed oxides in the adsorption field are still quite limited.
On the basis of the above considerations, in this study, we designed and synthesized a novel ordered mesoporous cerium and iron bimetal oxide (OMCI) with uniform and well-interconnected mesopores, which combined the superiority of bimetal oxides and mesoporous materials through a hard-template method. Due to the higher specific surface area and superior pore size features, the resulting OMCI material was expected to have promising excellent performances in removal of inorganic oxyacid anion pollutants for water purification. Arsenate (As(V)) and chromate (Cr(VI)) are two typical hypertoxic oxyacid anion pollutants in drinking water resources. Thus, As(V) and Cr(VI) anions were chosen as the objective pollutants for investigating the adsorption behaviors of OMCI and the possible mechanisms are also discussed.
Materials and methods
Nanocasted synthesis of the OMCI
Cubic Ia3d mesoporous silica (KIT-6) was selected as the hard template and prepared according to the reported literature.35 Typically, 12.0 g Pluronic 123 (P123, EO20PO70EO20, MW = 5800) was dissolved in a solution of 434.0 g ultrapure water and 23.6 g concentrated HCl (37%) with vigorous stirring, and then 12.0 g n-butanol was added to the homogeneous solution at 35 °C. After vigorously stirring for 60 min, 25.8 g TEOS (tetraethoxysilane) was slowly added to the solution, and stirring was continued at this temperature for another 24 h. The obtained suspension was aged at 40 °C for 24 h. The white product was filtered, washed with ultrapure water and dried at 90 °C. Then, P123 was removed by heat treatment at 550 °C for 6 h and the obtained product is KIT-6.The nanocasting process was similar to a reported method, except for using Fe(III) and Ce(III) as the precursor.28 Briefly, 1.6 mmol ferric nitrate hydrate (Fe(NO3)3·9H2O) and 0.8 mmol cerous nitrate hexahydrate (Ce(NO3)3·6H2O) were dissolved in a mixture of 20 mL ethanol. After stirring at room temperature for 2 h, 1 g KIT-6 was dispersed in this homogeneous solution, and the obtained mixture was stirred at room temperature for 2 h. Subsequently, the mixed solvent was evaporated at 50 °C until the mixture became viscous, was dried at 80 °C and then calcined at 300 °C for 6 h. The hybrid was re-impregnated with half the amount of the precursor to achieve higher loadings, followed by calcination at 450 °C for 6 h. The silica framework was then removed by treatment with 2 mol L−1 NaOH solution, centrifuged, washed three times with water and ethanol, and then dried at 80 °C in air, the tawny powder was obtained as the final product and named OMCI. For comparison, conventional Ce–Fe oxides prepared through the co-precipitation method with calcination at 450 °C were also obtained,15 denoted as CFC.
Characterization methods
Small-angle X-ray diffraction (SXRD) data were recorded using a Rigaku Dmax-2BR X-ray diffractometer at 40 kV and 100 mA, with the speed of 0.12° min−1. Wide-angle X-ray patterns (WXRD) were collected on a Siemens D5000 X-ray diffractometer (Cu Kα radiation, λ = 1.5406 Å) over a range of 10–80° operated at 40 mA and 40 kV, with a scan rate of 1° min−1 and a step size of 0.02°. Nitrogen adsorption–desorption isotherms were obtained using an Autosorb-iQ of Quantachrome at 77 K, with degasing at 373 K prior to the measurements. The Brumauer–Emmett–Teller (BET) method was utilized to calculate the specific surface areas. Pore size distribution curves were estimated by the Barrett–Joyner–Halenda (BJH) method from the desorption branches. Transmission electron microscopy (TEM) images of the samples were obtained with a JEOL2010F equipped with an energy dispersion spectrometer (EDS) at 200 kV. Scanning electron microscopy (SEM) images were obtained using a field emission scanning electron microscope (SEM) (Hitachi S-4800, Hitachi, Japan). Infrared absorption spectra were measured at room temperature on a Fourier transform infrared absorption spectrometer (FTIR, Nicolet 6700, USA) with a resolution of 2 cm−1. The zero charge points of the adsorbents before and after the adsorption were determined using a Zetasizer apparatus (Nano Z, Malvern, U.K.). The functional groups and oxidation states on the surface of the samples were analyzed by X-ray photoelectron spectroscopy (XPS) with a PHI 5000 Versaprobe spectrometer, using monochromatized Al Kα radiation (hv = 1486.6 eV). The concentrations of residual As(V) or Cr(VI) in solution were measured by Inductively Coupled Plasma Optical Emission Spectrometry (ICP-OES, Agilent 720ES, USA).Adsorption and regeneration experiments
Solutions with different concentrations of As(V) or Cr(VI) were prepared using Na2HAsO4·7H2O and K2Cr2O7 (Analytical Grade) as sources, respectively. All the adsorption experiments were conducted in well capped 150 mL flasks containing 50 mL solution with the required concentration of As(V) or Cr(VI), respectively. The flasks were shaken in a thermostatic shaker at 150 rpm and 298 K. After a specified time, the adsorbent was separated by a 0.45 μm membrane. Adsorption kinetics and isotherms were studied at pH 4, which were adjusted using HCl and NaOH solutions with the desired concentrations. For the kinetics study, 10 mg OMCI was added to 10 mg L−1 As(V) or Cr(VI) solution, respectively. After a specified time, the adsorbent was separated by a 0.45 μm membrane. For the adsorption isotherms study, 10 mg OMCI was added to 50 mL solution with As(V) or Cr(VI) concentration ranging from 1 to 50 mg L−1 under stirring for 24 h, respectively. The effect of pH on adsorption was studied in the pH range from 2 to 10. The adsorbents with As(V) or Cr(VI) loading, respectively, were collected by filtration and subsequently dried under vacuum.To evaluate the regeneration and reusable properties, OMCI was eluted using 1 M NaOH solution. The regenerated adsorbents were washed with deionized water until a neutral pH was reached, and then dried at 373 K for reuse in the next cycle. The adsorption–desorption cycles were repeated 6 times with 20 mg L−1 of As(V) or Cr(VI) solutions at pH 4. In order to verify the results of the present study, all the experiments were repeated twice.
Results and discussion
Characterization of OMCI
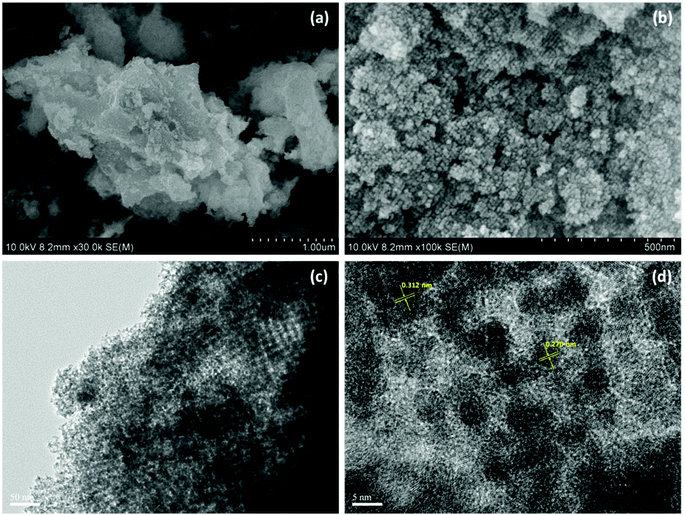
Architectural features of a hard template play a very important role in the determination of nanocasting materials. The template mesoporous silica (KIT-6) was characterized by SXRD patterns and exhibited two peaks corresponding to (211) and (220) reflections indicating the Ia3d cubic structure of KIT-6 (Fig. S1a†). The TEM image also indicates the ordered structure of KIT-6 (Fig. S1a†). The N2 adsorption–desorption analysis shows that the isotherm is IV type with a sharp capillary condensation step at relatively high pressure indicating the uniformity of mesopores (Fig. S1b†). The pore size distribution illustrates a narrow pore size distribution. All these pieces of information show the well-ordered mesoporous Ia3d cubic structure. The prepared KIT-6 owns a BET area of 630.0 m2 g−1, an average pore size of 5.39 nm and a total pore volume of 0.71 cm3 g−1.The obtained OMCI was analyzed by SEM and TEM, as shown in Fig. 1. It can be clearly observed that CFC prepared through a conventional co-precipitation method is composed of irregular particles with heterogeneous sizes (Fig. 1a). However, OMCI prepared by the hard-template approach consists of neatly aligned tiny spherical particles with uniform size of about 10 nm, which was possibly self-assembled to form large clusters (Fig. 1b). The well-ordered inner-connected mesoporous structure of OMCI is clearly observed from the TEM image depicted in Fig. 1c. The average crystallite size was estimated to be ∼10 nm, which is consistent with the result of SEM. The HRTEM image indicated OMCI is partially crystallized (Fig. 1d). The lattice interplanar spacing of 0.312 and 0.270 nm corresponds to the (111) and (200) plane of CeO2, revealing the existing CeO2 in OMCI are polycrystalline. No distinct lattices of iron oxides were clearly observed, indicating amorphous of iron oxides which is consistent with afore-mentioned WXRD analysis. On the basis of SXRD and TEM analysis, the ordered mesoporous Ce–Fe mixed oxides have been successfully prepared via a hard-template route.
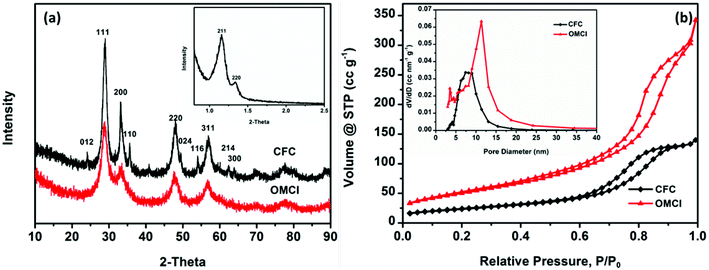
Evidence for the formation of mesostructures of OMCI was provided by the SXRD pattern, as shown in Fig. 2a. The SXRD patterns showed two well-dissolved diffractions corresponding to (211) and (220) reflections, indicating the well-ordered cubic mesostructure which is similar to that of the template KIT-6. However, the intensity of (211) reflection decreased, which may be due to the interconnectivity between the two mesopore systems of the gyroid structure decreased and resulted in the formation of lower symmetry.36 The WXRD pattern of OMCI consists of four well-dissolved diffractions corresponding to (111), (200), (220) and (311) reflections, which are consistent with the typical characteristic of the fluorite structure of CeO2. No distinct principal peaks for the phase of Fe2O3 were observed, indicating that the iron oxide in OMCI may be amorphous which will be confirmed by previous high resolution transmission electron microscopy (HRTEM) analysis. The WXRD pattern of CFC shows the diffractions of CeO2 with strong intensity and Fe2O3 with very low intensity, which is inconsistent with the original dosing ratio of Fe to Ce. It indicates that Fe2O3 was not well crystallized such as amorphous iron oxides in Fig. 1d.
The specific surface area (SSA) and mesoporosity parameters of OMCI and CFC were investigated by nitrogen adsorption–desorption measurements. The nitrogen adsorption–desorption isotherms and pore distributions calculated from the desorption branch by the BJH model of these two samples are given in Fig. 2b. Both CFC and OMCI exhibit typical type IV isotherms with H1 hysteresis loops, reflecting the typical characteristic of uniform mesoporous metal oxides. It is known that the steepness of the capillary condensation indicates the uniformity of mesopores.37 The more conspicuous and steep capillary condensations for OMCI indicate the better-defined uniform mesopores domain in the framework of OMCI. The detailed SSA and porosity parameters of OMCI and CFC are shown in Table 1. The obtained OMCI possesses much higher SSA and pore volume (185.6 m2 g−1 and 0.53 cc g−1, respectively) compared with the values of CFC (84.2 m2 g−1 and 0.22 cc g−1, respectively) and the mesoporous oxides reported by other research groups.24,28,31,37–39 This is very important for the adsorbents that OMCI can provide much more active sites and facilitate the diffusion of the adsorbates. Fig. 2b inset indicates different pore size distribution for the two materials. CFC possesses a wider pore size range, while OMCI exhibits a bimodal pore size distribution. Small pores for OMCI are ∼4 nm, while the large pores are ∼11 nm. It has been reported that KIT-6 is composed of two sets of interpenetrating mesopore systems that are connected to each other through micropores in the silica walls and the nanocasted replica may grow within the pores of KIT-6 in two ways, which may result in the formation of coupled replicas or uncoupled replicas.40 When the metal oxides grow only in one of the channels of KIT-6, the nanocast metal oxides show a bimodal pore size distribution.28,36,40 The first weak peak for OMCI is in agreement with the wall thickness of KIT-6 (∼3.6 nm). The larger pore size of OMCI (∼11 nm) is equivalent to the dimensions of the walls plus a pore of KIT-6.
| Sample | BET area (m2 g−1) | Pore volume (cc g−1) | Average pore size (nm) |
|---|---|---|---|
| OMCI | 185.6 | 0.53 | 11.35 |
| CFC | 84.2 | 0.22 | 7.42 |
Adsorption performance for arsenate and chromate anions
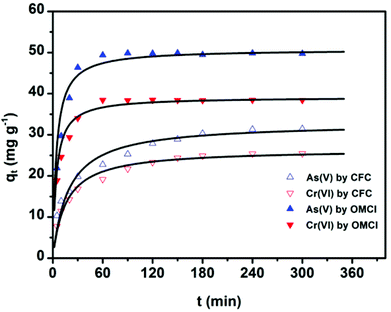
The adsorption kinetics is one of the most important characteristics that define the adsorption process and efficiency.41 The adsorption kinetics of As(V) or Cr(VI) on CFC and OMCI are shown in Fig. 3. The process is time dependent. The sorption was rapid in the first 30 min for both As(V) and Cr(VI) by OMCI, respectively. Thereafter it proceeded at a relatively slower rate and finally reached equilibrium after ∼60 min for both As(V) and Cr(VI). Compared with OMCI, CFC shows a lower adsorption rate and reaches equilibrium after ∼240 min for both As(V) and Cr(VI). The more rapid adsorption by OMCI may be attributed to its inner-connected mesoporous structure, which is favorable for the diffusion of As(V) and Cr(VI) ions.The initial rapid adsorption may be due to the large number of available sites in the initial stage. Along with the increase of the adsorption time, the concentration gradients gradually reduce due to the accumulation of adsorbed anions on the surface sites of OMCI, leading to the decrease in the adsorption rate of the later stage.42 The pseudo-first-order and pseudo-second-order kinetic models were applied to fit the experimental data. These models can be expressed as follows:
 | (1) |
 | (2) |
| Adsorbents | Adsorbates | q e,exp | Pseudo-first order | Pseudo-second order | ||||
|---|---|---|---|---|---|---|---|---|
| q e,exp | k 1 (min−1) | q e,cal (mg g−1) | R 2 | k 2 (g mg−1 min−1) | q e,cal (mg g−1) | R 2 | ||
| OMCI | As(V) | 49.74 | 0.3141 | 44.72 | 0.7211 | 4.61 × 10⁻³ | 50.79 | 0.9996 |
| Cr(VI) | 38.39 | 0.1649 | 30.34 | 0.6536 | 6.16 × 10⁻³ | 39.18 | 0.9997 | |
| CFC | As(V) | 31.45 | 0.01925 | 26.16 | 0.9401 | 1.63 × 10⁻³ | 32.90 | 0.9990 |
| Cr(VI) | 25.53 | 0.01938 | 18.77 | 0.9395 | 2.44 × 10⁻³ | 26.16 | 0.9994 | |
Since general kinetic studies could not clarify the rate-limiting step of As(V) and Cr(VI) adsorption on OMCI, an intraparticle diffusion model was used for the analysis of the rate-limiting step of the adsorption. The equation given by Weber and Morris can be written as43
 | (3) |
Plots of qtversus t1/2 for both As(V) and Cr(VI) are shown in Fig. S2† and the values of ki and C calculated from the slope and intercept are summarized in Table S1.† It was found that the plots for both As(V) and Cr(VI) exhibited a multilinear type, and there were three portions with different gradients. It indicates that three steps were involved in the whole adsorption process for As(V) or Cr(VI) on OMCI: (i) the instantaneous adsorption or external surface adsorption possibly including diffusion by the macropores; (ii) the gradual adsorption stage where intraparticle diffusion into the mesopores and micropores was a rate-limiting step; and (iii) the final stage where intraparticle diffusion started to slow down due to the relatively low residual As(V) concentration in the solutions.25 The second stage of all three adsorbents did not pass through the origin, suggesting that the intraparticle diffusion was not the only rate-limiting step and chemical complex reaction might be involved.
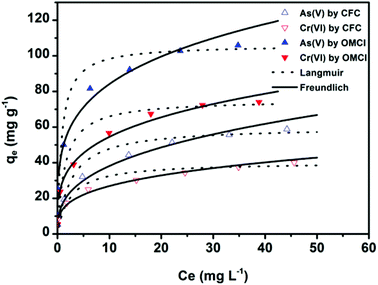
To further understand the adsorption performance of OMCI for As(V) and Cr(VI), the adsorption isotherms were investigated; the results are shown in Fig. 4. It can be found from Fig. 4 that the equilibrium adsorption amount of the adsorbent increases with the increment of equilibrium concentrations. The experimental data were fitted by two methods, Langmuir and Freundlich models, which can be represented in a linear way as follows:
 | (4) |
 | (5) |
The amounts of adsorbed As(V) or Cr(VI) versus the corresponding aqueous-phase equilibrium concentration have been plotted as adsorption isotherms in Fig. 4. The calculated isotherm parameters of OMCI for As(V) and Cr(VI) are summarized in Table 3. By comparison of regression coefficients (R2) of the two models, it can be found that the two models can well describe the adsorption behavior of As(V) and Cr(VI) on OMCI. The calculated Langmuir maximum adsorption capacities of OMCI for As(V) and Cr(VI) were 106.21 and 75.36 mg g−1, respectively, which is much higher than the values of CFC (60.17 and 40.27 mg g−1, respectively). The results are also significantly higher than that of reported related adsorbents, such as flowerlike α-Fe2O3,44 flowerlike α-Fe2O3 nanostructures,45 flowerlike CeO2,46 CeO2 hollow nanospheres,47 hollow nestlike α-Fe2O3![[thin space (1/6-em)]](https://www.rsc.org/images/entities/char_2009.gif) 48 and commercial α-Fe2O3
48 and commercial α-Fe2O3![[thin space (1/6-em)]](https://www.rsc.org/images/entities/char_2009.gif) 45 (Table 4). The great enhancement in adsorption capacity of OMCI compared with CFC is possibly due to its much higher surface area, internal uniform mesopore distribution which can enhance the accessibility of As(V) and Cr(VI) to the active sites and surface properties. It will be discussed in the subsequent sections. The Freundlich constant, KF, is defined as an adsorption or distribution coefficient which describes the amount of arsenic or chromium adsorbed on the adsorbents for the unit equilibrium concentration. The KF values of OMCI for As(V) and Cr(VI) were 48.12 and 29.61, respectively, indicating that OMCI exhibited higher adsorption capacity for As(V) than that for Cr(VI). This is consistent with the experimental results. The other constant n in the Freundlich model is found to be greater than 1 for both As(V) and Cr(VI), indicating that the adsorbents are favorable for As(V) or Cr(VI) removal.
45 (Table 4). The great enhancement in adsorption capacity of OMCI compared with CFC is possibly due to its much higher surface area, internal uniform mesopore distribution which can enhance the accessibility of As(V) and Cr(VI) to the active sites and surface properties. It will be discussed in the subsequent sections. The Freundlich constant, KF, is defined as an adsorption or distribution coefficient which describes the amount of arsenic or chromium adsorbed on the adsorbents for the unit equilibrium concentration. The KF values of OMCI for As(V) and Cr(VI) were 48.12 and 29.61, respectively, indicating that OMCI exhibited higher adsorption capacity for As(V) than that for Cr(VI). This is consistent with the experimental results. The other constant n in the Freundlich model is found to be greater than 1 for both As(V) and Cr(VI), indicating that the adsorbents are favorable for As(V) or Cr(VI) removal.
| Adsorbents | Anion species | Langmuir isotherm | Freundlich isotherm | ||||
|---|---|---|---|---|---|---|---|
| q m (mg g−1) | b (L g−1) | R 2 | K F ((mg g−1) (dm3 mg−1)−1/n) | n | R 2 | ||
| OMCI | As(V) | 106.2 | 1.242 | 0.9946 | 48.12 | 4.117 | 0.9975 |
| Cr(VI) | 75.36 | 0.7017 | 0.9930 | 29.61 | 3.772 | 0.9967 | |
| CFC | As(V) | 60.17 | 0.3867 | 0.9905 | 17.15 | 2.877 | 0.9963 |
| Cr(VI) | 40.27 | 0.4182 | 0.9888 | 13.82 | 3.457 | 0.9962 | |
| Adsorbents | BET surface area | Adsorption capacity (mg g−1) | Ref. | |
|---|---|---|---|---|
| m2 g−1 | As(V) | Cr(VI) | ||
| OMCI | 185.6 | 106.21 | 75.36 | This work |
| CFC | 84.2 | 60.17 | 40.27 | This work |
| Flowerlike α-Fe2O3 | 40 | 7.6 | 5.4 | 44 |
| Commercial α-Fe2O3 | 2 | 0.3 | 0.37 | 45 |
| Flowerlike α-Fe2O3 nanostructures | 130 | 51 | 30 | 45 |
| Flowerlike CeO2 | 34.1 | 14.4 | 5.9 | 46 |
| CeO2 hollow nanospheres | 72 | 22.4 | 15.4 | 47 |
| Hollow nestlike α-Fe2O3 | 152.42 | 75.3 | 58.6 | 48 |
| Nano-malachite | — | 57.1 | 82.2 | 49 |
The adsorption behaviors of OMCI for As(V) and Cr(VI) may be associated with their species distribution under the experimental conditions. As(V) and Cr(VI) exist predominantly in the anionic states of H2AsO4− and Cr2O72−/HCrO4− in aqueous solution at pH 4,45 and the surface of OMCI is positively charged according to the pHzpc value (7.13) (Fig. S3†). It can be postulated that the adsorption of As(V) or Cr(VI) on the adsorbents involves multiple mechanisms, including electrostatic attraction and surface complexation, which causes the occurrence of multilayer sorption.
Solution pH can affect both the zeta potential of the adsorbents and ion species. The removal efficiency of As(V) and Cr(VI) by OMCI as a function of a broad pH range is represented in Fig. 5. It can be easily seen that the pH had a pronounced effect on As(V) or Cr(VI) uptake on OMCI, and the influencing trends for them are similar. In the whole pH range, the removal efficiency decreases with increasing pH for both As(V) and Cr(VI). The surface of OMCI was positively charged below pHzpc (pH = 7.13), which was due to the protonation of the surface. Therefore, the electrostatic attraction between positively charged OMCI samples and negatively charged As(V) and Cr(VI) species may be the main reason for high removal efficiency under acidic conditions. As solution pH increased up to ∼7, the removal efficiency slightly decreased. This is presumably related to the reduction of electrostatic attraction between near neutral surface and As(V) and Cr(VI) species. More sharply, a decrease in removal efficiency was found in the pH range above 7, and the reasons might be attributed to (i) the strong electrostatic repulsion between the negatively charge sites on the surface and As(V) and Cr(VI) species, (ii) competition adsorption between OH− and As(V) and Cr(VI) species.20,50 Another important superiority of OMCI was that almost no Fe or Ce leached into the solution even under the acidic conditions of pH = 2, indicating that OMCI was stable and could be used in a broad pH range.
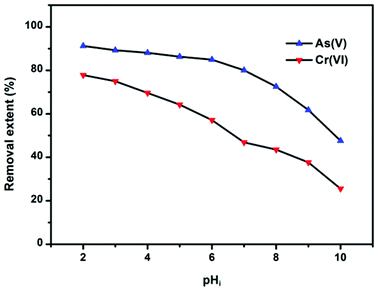 | ||
| Fig. 5 Effect of pH on As(V) or Cr(VI) adsorption by OMCI at 298 K. Both the initial concentrations of As(V) and Cr(VI) were 10 mg L−1; the dosage of adsorbents was 0.2 g L−1. | ||
Adsorption mechanisms
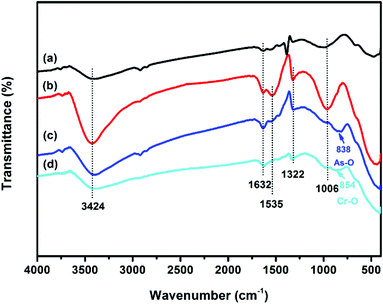
The vibration models associated with the stretching and bending motions of hydroxyl groups of metal oxides (M–OH, where M represents the substrate of metal oxides) are sensitive to the presence of adsorbed ions, which can be detected by IR spectroscopy.51 FTIR spectra of samples before and after adsorption of As(V) and Cr(VI) are shown in Fig. 6. All the four tested samples exhibit broad bands at ∼3424 and ∼1632 cm−1, attributable to HOH stretching and bending vibration of the physisorbed water on the surface of the adsorbent, respectively. The peaks among 2700 to 2900 cm−1 and the band at ∼1535 cm−1 may be attributed to the impurities. The band at ∼1380 cm−1 of CFC can be assigned to CO32−, which may be due to the dissolved CO2 through the synthetic process. The reason for the decrease in the intensity of the peak at ∼1535 cm−1 after adsorption is not clear. The bands of OMCI at 1006 cm−1 with much stronger intensity compared to CFC are assigned to the bending vibration M–OH.51 The much more abundant M–OH groups on OMCI may be associated with its higher specific surface area. It is clear that the M–OH bending bands almost disappeared, while a new band at 838 and 854 cm−1 appeared after As(V) and Cr(VI) adsorption, which can be attributed to the stretching vibrations of As–O and Cr–O, respectively. From the fact that OMCI possesses much higher adsorption capacity for As(V) and Cr(VI), it can be speculated that the substitution of M–OH groups by As(V) or Cr(VI) ions plays a key role in the adsorption process, which is in accordance with the reported studies.25,45,51,52Surface states of OMCI before and after As(V) and Cr(VI) adsorption were analyzed by XPS to obtain further insight into the adsorption mechanism. Fig. 7a shows full-range XPS spectra of OMCI before and after As(V) and Cr(VI) adsorption. As and Cr information appeared after As(V) or Cr(VI) was adsorbed on the surface of OMCI. After As(V) adsorption, the As 3d spectrum showed a peak at 45.4 eV, attributable to As(V)–O bonding (Fig. S4†), while after Cr(VI) adsorption, the Cr 2p spectrum showed two peaks at 576.9 and 586.6 eV, corresponding to Cr 2p3/2–O and Cr 2p1/2–O bonding (Fig. S5†), respectively. This reveals that As(V) and Cr(VI) have been adsorbed on the surface of OMCI.
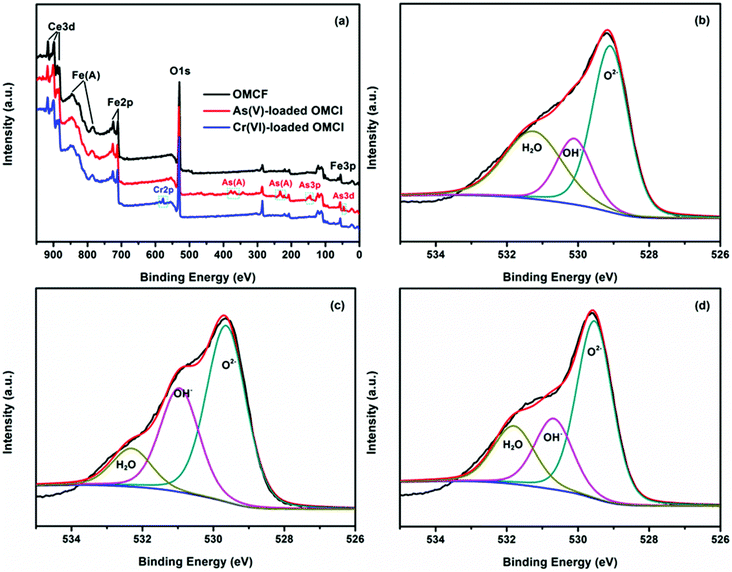 | ||
| Fig. 7 Full-range XPS spectra of OMCI before and after As(V) and Cr(VI) adsorption (a), O 1s spectra with three deconvolutions of OMCI (b), As(V)-loaded OMCI (c) and Cr(VI)-loaded OMCI (d). | ||
The binding energy of Fe 2p3/2 was 710.6 eV, which is assigned to Fe(III)–O for the Fe phase of OMCI (Fig. S6†). The separation of the 2p3/2 and 2p1/2 spin–orbit levels was approximately 13.5 eV, which is also attributed to Fe(III) ions in solids.53 As reported, two pairs of spin–orbital doublets (v°–u°, v′–u′) corresponding to the Ce 3d3/2 and Ce 3d5/2 contributions indicates the states of Ce(III) species, while three pairs of spin–orbital doublets (v–u, v′′–u′′, v′′′–u′′′) arising from different Ce 4f electron configurations indicates the Ce(IV) species.54 As shown in Fig. S7,† the Ce spectrum of OMCI exhibits three pairs of peaks, indicating that the dominating chemical state of Ce in OMCI is Ce(IV). It can be seen that the phases of Fe and Ce showed little change after the adsorption of As(V) and Cr(VI), indicating no occurrence of redox reactions between adsorbates and adsorbents. Because of the chemical adsorption between OMCI and the anions, the binding energies of both Fe 2p and Ce 3d spectra have slightly shifted to more positive energy after As(V) and Cr(VI) adsorption (Fig. S6 and S7†), suggesting the possibility that both Fe and Ce atoms were involved in the adsorption.
The surface compositions of OMCI before and after As(V) and Cr(VI) adsorption are summarized in Table 5. The surface of OMCI contains 18.02% Fe and 9.03% Ce. The atomic ratio of Fe to Ce was ∼2, which is consistent with the mass ratio in adsorbent preparation, suggesting near homogeneity of Fe and Ce in OMCI. After the chemical adsorption with As(V) and Cr(VI), the atomic ratios of both Fe and Ce on the surface decreased, demonstrating that Fe and Ce atoms were overlaid by the adsorbed As(V) or Cr(VI) species. This is consistent with the previous finding of Fe 2p and Ce 3d spectra shift after adsorption. The above results further proved that both Fe and Ce atoms in OMCI directly participated in the adsorption. The atomic ratio of O on the other hand decreased from 72.59% to 68.01% and 70.06%, respectively, after As(V) or Cr(VI) adsorption. The very slight change of O atom loss may be due to the fact that the replacement of M–OH was compensated for by the new O atoms from As(V) or Cr(VI) ions.51
| Sample | Fe (at%) | Ce (at%) | O (at%) | As (at%) | Cr (at%) |
|---|---|---|---|---|---|
| OMCI | 18.02 | 9.03 | 72.95 | −0 | −0 |
| As-loaded OMCI | 16.32 | 8.28 | 68.01 | 7.39 | −0 |
| Cr-loaded OMCI | 16.94 | 8.44 | 70.06 | −0 | 4.56 |
The O 1s spectra of OMCI before and after As(V) and Cr(VI) adsorption are illustrated in Fig. 7. It can be clearly seen that the O 1s spectra are quite different after As(V) or Cr(VI) adsorption, indicating that the oxygen constituents of OMCI significantly changed after adsorption. The O 1s narrow scans can be deconvoluted into three overlapped peaks corresponding to oxide oxygen (M–O), hydroxyl groups (OH−) and adsorbed water (H2O). The binding energy of O1 s and their variations on the surface are summarized in Table 6. The area ratio for the peak at 529.1 eV attributed to M–O increased from 48.87% to 55.92% and 55.39% after As(V) and Cr(VI) adsorption, respectively. This increment may be due to: (i) the formation of M–O on the surface after the reaction between adsorbents and adsorbates; (ii) the As–O or Cr–O in adsorbed As(V) or Cr(VI) species on the surface.55 The OH− group, which was proven to be the key factor for As(V) and Cr(VI) adsorption on OMCI by FTIR analysis, occupied 19.15% of the total oxygen. It is interesting that the surface of OMCI became progressively hydroxylated after adsorption (32.07% and 21.14%), which is possibly due to the formation of highly hydroxylated surface complexes via the reaction between M–OH and As–OH or Cr–OH.51
| Samples | Chemical states | Binding energy (eV) | Percent (%) |
|---|---|---|---|
| OMCI | M–O | 529.1 | 48.87 |
| OH− | 530.1 | 19.15 | |
| H2O | 531.3 | 31.98 | |
| As(V)-loaded OMCI | M–O | 529.5 | 55.92 |
| OH− | 530.8 | 32.07 | |
| H2O | 532.4 | 12.01 | |
| Cr(VI)-loaded OMCI | M–O | 529.5 | 55.39 |
| OH− | 530.7 | 23.47 | |
| H2O | 531.8 | 21.14 |
Results of previous sections showed that the As(V) and Cr(VI) removal efficiency by OMCI decreased with increasing solution pH values, indicating that As(V) and Cr(VI) adsorptions by OMCI were not only through ligand exchange under acidic solutions, but also through Coulomb forces. Additionally, the pHzpc decreased from 7.13 to 5.36 and 5.74 (Fig. S3†) after As(V) and Cr(VI) adsorption, respectively, indicating the formation of anionic negatively charged inner-sphere surface complexes.56,57 Based on the afore-mentioned analysis, the adsorption of both As(V) and Cr(VI) on OMCI under the experimental conditions showed a complex mechanism, including electrostatic attraction and surface complexion through the ligand exchange.
Regeneration and reusable property studies
Under the consideration of further practical application, regeneration and reusable properties are also important. The desorption studies of OMCI materials were conducted by washing with 1 M NaOH solution, and these adsorption–regeneration cycles were carried out up to five times. It can be extrapolated from Fig. 8a that a strong alkali solution is an ideal candidate for As(V) and Cr(VI) desorption from OMCI. Fig. 8b demonstrates that the adsorption capacities of OMCI for As(V) and Cr(VI) decrease with the increase of the regeneration cycle. However, the decrease was slight, and after the fifth regeneration, the reduction in adsorption capacities of OMCI for As(V) and Cr(VI) was only ∼7.8% and 13.3%, respectively. These results indicate that OMCI is desirable for potential application in real practice.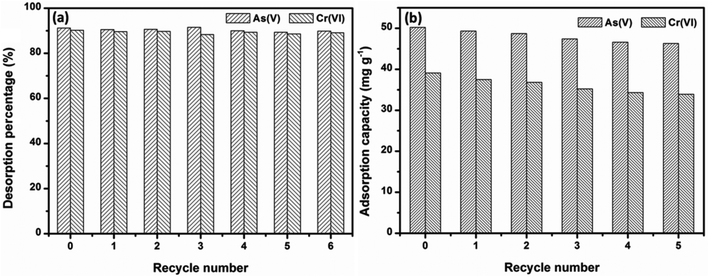 | ||
| Fig. 8 Adsorption capacities and desorption percentages of OMCI for As(V) and Cr(VI) in 5 consecutive cycles. | ||
Conclusion
In this study, a novel ordered mesoporous Ce–Fe bimetal oxide (OMCI) has been successfully synthesized by the nanocasting method. The obtained OMCI possessed large SSA and pore volume, uniform pore size distribution and abundant surface hydroxyl groups on the surface. It was applied as an adsorbent for As(V) and Cr(VI) removal from aqueous solutions and exhibited excellent adsorption performance. The adsorption behaviour of As(V) or Cr(VI) can be well described by both the Freundlich and the Langmuir model, and the kinetics fitted with the pseudo-second-order model. Mechanism studies demonstrated that As(V) or Cr(VI) adsorption on OMCI was through a complex mechanism including electrostatic attraction and the replacement of M–OH groups to form anionic negatively charged inner-sphere surface complexes. The adsorbed As(V) or Cr(VI) was effectively desorbed by sodium hydroxide solution, and the regenerated OMCI could be reused for at least five cycles with a slight reduction in the adsorption capacity. The excellent adsorption performance makes the OMCI material a good potential adsorbent for the decontamination of As(V) or Cr(VI) from water systems.Acknowledgements
This work was supported by the National Natural Science Foundation of China (no. 41372241) and State Key Laboratory of Pollution Control and Resource Reuse Foundation (no. PCRRK09006, PCRRY11009).References
- Z. Wu and D. Zhao, Chem. Commun., 2011, 47, 3332–3338 RSC.
- D. Mohan and C. U. Pittman, J. Hazard. Mater., 2007, 142, 1–53 CrossRef CAS PubMed.
- S. E. Bailey, T. J. Olin, R. M. Bricka and D. D. Adrian, Water Res., 1999, 33, 2469–2479 CrossRef CAS.
- S. Babel and T. A. Kurniawan, J. Hazard. Mater., 2003, 97, 219–243 CrossRef CAS.
- R. Baccar, J. Bouzid, M. Feki and A. Montiel, J. Hazard. Mater., 2009, 162, 1522–1529 CrossRef CAS PubMed.
- C. K. Jain and I. Ali, Water Res., 2000, 34, 4304–4312 CrossRef CAS.
- Z. X. Zhao, Y. F. Jia, L. Y. Xu and S. L. Zhao, Water Res., 2011, 45, 6496–6504 CrossRef CAS PubMed.
- J.-H. Huang, A. Voegelin, S. A. Pombo, A. Lazzaro, J. Zeyer and R. Kretzschmar, Environ. Sci. Technol., 2011, 45, 7701–7709 CrossRef CAS PubMed.
- D. J. Yang, B. Paul, W. J. Xu, Y. Yuan, E. Liu, X. B. Ke, R. M. Wellard, C. Guo, Y. J. Xu and Y. H. Sun, Water Res., 2010, 44, 741–750 CrossRef CAS PubMed.
- Z. Li, T. Zhang and K. Li, Dalton Trans., 2011, 40, 2062–2066 RSC.
- P. K. Pandey, S. Choubey, Y. Verma, M. Pandey and K. Chandrashekhar, Bioresour. Technol., 2009, 100, 634–637 CrossRef CAS PubMed.
- G. X. Zhao, J. X. Li, X. M. Ren, C. L. Chen and X. K. Wang, Environ. Sci. Technol., 2011, 45, 10454–10462 CrossRef CAS PubMed.
- J. Ma, Z. Zhu, B. Chen, M. Yang, H. Zhou, C. Li, F. Yu and J. Chen, J. Mater. Chem. A, 2013, 1, 4662–4666 CAS.
- S. Vadahanambi, S.-H. Lee, W.-J. Kim and I.-K. Oh, Environ. Sci. Technol., 2013, 47, 10510–10517 CAS.
- G. S. Zhang, Z. M. Ren, X. W. Zhang and J. Chen, Water Res., 2013, 47, 4022–4031 CrossRef CAS PubMed.
- R. M. Dhoble, S. Lunge, A. G. Bhole and S. Rayalu, Water Res., 2011, 45, 4769–4781 CrossRef CAS PubMed.
- V. Gupta, S. Agarwal and T. A. Saleh, Water Res., 2011, 45, 2207–2212 CrossRef CAS PubMed.
- G. S. Zhang, H. J. Liu, J. H. Qu and W. Jefferson, J. Colloid Interface Sci., 2012, 366, 141–146 CrossRef CAS PubMed.
- G. S. Zhang, J. H. Qu, H. J. Liu, R. P. Liu and R. C. Wu, Water Res., 2007, 41, 1921–1928 CrossRef CAS PubMed.
- B. Chen, Z. Zhu, Y. Guo, Y. Qiu and J. Zhao, J. Colloid Interface Sci., 2013, 398, 142–151 CrossRef CAS PubMed.
- J. Zhou, Z. Hua, W. Wu, Z. Liu, Y. Zhu, Y. Chen and J. Shi, Dalton Trans., 2011, 40, 12667–12669 RSC.
- Y. Zhang, X. Wang, L. Zeng, S. Y. Song and D. P. Liu, Dalton Trans., 2012, 41, 4316–4319 RSC.
- J. Wang, H. Li, H. Li, C. Zuo and H. Wang, J. Phys. Chem. C, 2012, 116, 9517–9525 CAS.
- F. Jiao, A. Harrison, J. C. Jumas, A. V. Chadwick, W. Kockelmann and P. G. Bruce, J. Am. Chem. Soc., 2006, 128, 5468–5474 CrossRef CAS PubMed.
- D. H. Chen, L. Cao, T. L. Hanley and R. A. Caruso, Adv. Funct. Mater., 2012, 22, 1966–1971 CrossRef CAS.
- Z. X. Li, F. B. Shi, Y. Ding, T. Zhang and C. H. Yan, Langmuir, 2011, 27, 14589–14593 CrossRef CAS PubMed.
- Z. Q. Zou, M. Meng and Y. Q. Zha, J. Phys. Chem. C, 2009, 114, 468–477 Search PubMed.
- H. Tuysuz, E. L. Salabas, E. Bill, H. Bongard, B. Spliethoff, C. W. Lehmann and F. Schuth, Chem. Mater., 2012, 24, 2493–2500 CrossRef CAS.
- R. Ryoo, S. H. Joo and S. Jun, J. Phys. Chem. B, 1999, 103, 7743–7746 CrossRef CAS.
- M. S. Jin, J. N. Park, J. K. Shon, J. H. Kim, Z. H. Li, Y. K. Park and J. M. Kim, Catal. Today, 2012, 185, 183–190 CrossRef CAS PubMed.
- T. Tsoncheva, J. Roggenbuck, M. Tiemann, L. Ivanova, D. Paneva, I. Mitov and C. Minchev, Microporous Mesoporous Mater., 2008, 110, 339–346 CrossRef CAS PubMed.
- E. Pellicer, M. Cabo, E. Rossinyol, P. Solsona, S. Surinach, M. D. Baro and J. Sort, Adv. Funct. Mater., 2013, 23, 900–911 CrossRef CAS.
- J. Rosen, G. S. Hutchings and F. Jiao, J. Am. Chem. Soc., 2013, 135, 4516–4521 CrossRef CAS PubMed.
- Y. Ren, Z. Ma and P. G. Bruce, Chem. Soc. Rev., 2012, 41, 4909–4927 RSC.
- F. Kleitz, S. H. Choi and R. Ryoo, Chem. Commun., 2003, 2136–2137 RSC.
- H. Tuysuz, C. W. Lehmann, H. Bongard, B. Tesche, R. Schmidt and F. Schuth, J. Am. Chem. Soc., 2008, 130, 11510–11517 CrossRef CAS PubMed.
- S. M. Morris, P. F. Fulvio and M. Jaroniec, J. Am. Chem. Soc., 2008, 130, 15210–15216 CrossRef CAS PubMed.
- J. Zhu and Q. Gao, Microporous Mesoporous Mater., 2009, 124, 144–152 CrossRef CAS PubMed.
- Y. Wang, J. Ren, Y. Wang, F. Zhang, X. Liu, Y. Guo and G. Lu, J. Phys. Chem. C, 2008, 112, 15293–15298 CAS.
- F. Jiao, A. H. Hill, A. Harrison, A. Berko, A. V. Chadwick and P. G. Bruce, J. Am. Chem. Soc., 2008, 130, 5262–5266 CrossRef CAS PubMed.
- X. Y. Yu, T. Luo, Y. Jia, Y. X. Zhang, J. H. Liu and X. J. Huang, J. Phys. Chem. C, 2011, 115, 22242–22250 CAS.
- J. Hu, D. Shao, C. Chen, G. Sheng, X. Ren and X. Wang, J. Hazard. Mater., 2011, 185, 463–471 CrossRef CAS PubMed.
- M. J. C. Weber, Adsorption Processes for Water Treatment, Butterworth, London, 1987 Search PubMed.
- L. S. Zhong, J. S. Hu, H. P. Liang, A. M. Cao, W. G. Song and L. J. Wan, Adv. Mater., 2006, 18, 2426–2431 CrossRef CAS.
- C. Y. Cao, J. Qu, W. S. Yan, J. H. Zhu, Z. Y. Wu and W. G. Song, Langmuir, 2012, 28, 4573–4579 CrossRef CAS PubMed.
- L. S. Zhong, J. S. Hu, A. M. Cao, Q. Liu, W. G. Song and L. J. Wan, Chem. Mater., 2007, 19, 1648–1655 CrossRef CAS.
- C. Y. Cao, Z. M. Cui, C. Q. Chen, W. G. Song and W. Cai, J. Phys. Chem. C, 2010, 114, 9865–9870 CAS.
- Z. Wei, R. Xing, X. Zhang, S. Liu, H. Yu and P. Li, ACS Appl. Mater. Interfaces, 2013, 5, 598–604 CAS.
- J. Saikia, B. Saha and G. Das, J. Hazard. Mater., 2011, 186, 575–582 CrossRef CAS PubMed.
- K. Gupta, T. Basu and U. C. Ghosh, J. Chem. Eng. Data, 2009, 54, 2222–2228 CrossRef CAS.
- Y. Zhang, M. Yang, X. M. Dou, H. He and D. S. Wang, Environ. Sci. Technol., 2005, 39, 7246–7253 CrossRef CAS.
- Z. Li, S. Deng, G. Yu, J. Huang and V. C. Lim, Chem. Eng. J., 2010, 161, 106–113 CrossRef CAS PubMed.
- L. Armelao, R. Bertoncello, L. Crociani, G. Depaoli, G. Granozzi, E. Tondello and M. Bettinelli, J. Mater. Chem., 1995, 5, 79–83 RSC.
- J. He, G. K. Reddy, S. W. Thiel, P. G. Smirniotis and N. G. Pinto, J. Phys. Chem. C, 2011, 115, 24300–24309 CAS.
- E. A. Deliyanni, L. Nalbandian and K. A. Matis, J. Colloid Interface Sci., 2006, 302, 458–466 CrossRef CAS PubMed.
- M. Pena, X. Meng, G. P. Korfiatis and C. Jing, Environ. Sci. Technol., 2006, 40, 1257–1262 CrossRef CAS.
- B. Chen, Z. Zhu, J. Ma, Y. Qiu and J. Chen, J. Mater. Chem. A, 2013, 1, 11355–11367 CAS.
Footnote |
| † Electronic supplementary information (ESI) available. See DOI: 10.1039/c4dt01101e |
| This journal is © The Royal Society of Chemistry 2014 |

