 Open Access Article
Creative Commons Attribution 3.0 Unported Licence
Interaction of Cm(III) and Am(III) with human serum transferrin studied by time-resolved laser fluorescence and EXAFS spectroscopy
Nicole
Bauer
*ab,
Daniel R.
Fröhlich
ab and
Petra J.
Panak
ab
aKarlsruhe Institute of Technology (KIT), Campus North, Institute for Nuclear Waste Disposal (INE), P.O. Box 3640, 76021 Karlsruhe, Germany. E-mail: Nicole.bauer@kit.edu; Fax: (+)49 721 608 23927; Tel: (+)49 721 608 24652
bUniversity of Heidelberg, Institute for Physical Chemistry, Im Neuenheimer Feld 253, 69120 Heidelberg, Germany
First published on 14th March 2014
Abstract
The complexation of Cm(III) with human serum transferrin was investigated in a pH range from 3.5 to 11.0 using time-resolved laser fluorescence spectroscopy (TRLFS). At pH ≥ 7.4 Cm(III) is incorporated at the Fe(III) binding site of transferrin whereas at lower pH a partially bound Cm(III) transferrin species is formed. At physiological temperature (310 K) at pH 7.4, about 70% of the partially bound and 30% of the incorporated Cm(III) transferrin species are present in solution. The Cm(III) results obtained by TRLFS are in very good agreement with Am(III) EXAFS results, confirming the incorporation of Am(III) at the Fe(III) binding site at pH 8.5.
Introduction
In the case of an accidental release of radionuclides to the environment, especially actinides cause a serious health risk upon incorporation into the body e.g. by wounds, ingestion or inhalation. In contrast to other metal ions, actinides have no essential function in the biochemistry of the human body.1 Apart from chemical toxicity, their hazardousness depends on radiological toxicity. Availability and toxicity of the incorporated actinides in the body are mainly influenced by their concentration and speciation (chemical form and oxidation state).2 Up to now, little is known about the chemical behavior and potential toxic effects of actinides in the human body. Hence, it is important to understand the mechanisms of relevant biochemical reactions with regard to the development of potential decontamination therapies.3The chemistry of actinides in aqueous systems under physiological conditions (pH![[thin space (1/6-em)]](https://www.rsc.org/images/entities/char_2009.gif) ∼
∼![[thin space (1/6-em)]](https://www.rsc.org/images/entities/char_2009.gif) 7.4) is dominated by the formation of complexes with available organic and inorganic ligands (OH−, CO32−etc.). Blood serum proteins have a high affinity to various metal ions and might be relevant for the biochemical behavior of incorporated actinides.4 One representative of utmost importance is the iron carrier protein transferrin.
7.4) is dominated by the formation of complexes with available organic and inorganic ligands (OH−, CO32−etc.). Blood serum proteins have a high affinity to various metal ions and might be relevant for the biochemical behavior of incorporated actinides.4 One representative of utmost importance is the iron carrier protein transferrin.
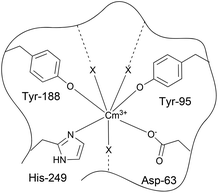
Human serum transferrin is a single-chain glycoprotein with a molecular mass of 79![[thin space (1/6-em)]](https://www.rsc.org/images/entities/char_2009.gif) 570 kDa which consists of 679 amino acids.5–7 Transferrin can bind to two Fe(III) ions and transport them to the cells where the transferrin metal complex is recognized by the receptor and taken up via endocytosis.8,9 The ternary structure of transferrin is characterized by folding into two similar but not identical lobes which are joined by a short peptide chain.10 Each lobe consists of α/β-subunits and is divided into two domains separated by a cleft housing the metal binding site. In both lobes the metal ion is coordinated by two tyrosines, one aspartate, one histidine and the synergistic anion in a distorted octahedral geometry.11 The synergistic anion stabilizes the Fe(III) transferrin complex by coordinating as a bidentate bridging ligand to the protein and the metal ion. In living organisms the synergistic anion is carbonate, but other anions such as carboxylates can also play a role.12–14 Although the coordination mode is the same at both binding sites, the C-terminal site is larger and has a higher affinity to Fe3+ than the smaller N-terminal site. At pH 7.4 the affinity of the binding site at the C-lobe to Fe(III) is about 20 times higher than that at the N-lobe.15 The coordination of Fe(III) and the anion leads to a conformational change from an open to a closed form. This mechanism stabilizes the transferrin metal complex and is important for the recognition of the metal transferrin complex by the transferrin receptor (TfR).5,16
570 kDa which consists of 679 amino acids.5–7 Transferrin can bind to two Fe(III) ions and transport them to the cells where the transferrin metal complex is recognized by the receptor and taken up via endocytosis.8,9 The ternary structure of transferrin is characterized by folding into two similar but not identical lobes which are joined by a short peptide chain.10 Each lobe consists of α/β-subunits and is divided into two domains separated by a cleft housing the metal binding site. In both lobes the metal ion is coordinated by two tyrosines, one aspartate, one histidine and the synergistic anion in a distorted octahedral geometry.11 The synergistic anion stabilizes the Fe(III) transferrin complex by coordinating as a bidentate bridging ligand to the protein and the metal ion. In living organisms the synergistic anion is carbonate, but other anions such as carboxylates can also play a role.12–14 Although the coordination mode is the same at both binding sites, the C-terminal site is larger and has a higher affinity to Fe3+ than the smaller N-terminal site. At pH 7.4 the affinity of the binding site at the C-lobe to Fe(III) is about 20 times higher than that at the N-lobe.15 The coordination of Fe(III) and the anion leads to a conformational change from an open to a closed form. This mechanism stabilizes the transferrin metal complex and is important for the recognition of the metal transferrin complex by the transferrin receptor (TfR).5,16
In regular blood serum only approximately 30% of the transferrin molecules are saturated with iron. Consequently, non-saturated transferrin is available for the complexation of other metal ions. Besides iron, about 30 other tri- and tetravalent metal ions have been identified to bind to transferrin, e.g. Ga(III),17,18 Ru(III)19,20 and lanthanide(III) ions like Nd(III).21,22 Regarding the interaction of transferrin with actinides, a few studies have been performed with Th(IV), Pa(V), U(VI), Np(IV), Np(V), Pu(IV), Am(III) and Cm(III).4,23–32 Most of them are phenomenological studies using methods like UV-visible spectroscopy or fluorescence spectroscopy of the protein with excitation of transferrin at 280 nm.29 They give only semiquantitative results on the binding of transferrin to actinides and provide no information on the complexation mechanism, binding structure and number of species. The complexation of Np(IV), Pu(IV), Th(IV) and U(VI) with transferrin and nitrilotriacetic acid (NTA) as a synergistic anion was investigated using EXAFS spectroscopy.25–27 Furthermore, the U(VI) transferrin system was studied by time-resolved laser fluorescence spectroscopy (TRLFS).24 Stability constants were determined for U(VI) and Pu(IV).24,33 The stability constants of Cm(III) and Am(III) were derived theoretically by using a mathematical correlation based on the first hydrolysis constants.28,34 In a recent paper, the complexation of Cm(III) with transferrin was investigated at pH 8.6 using fluorescence spectroscopy with excitation of the protein at 280 nm.29 Emission spectra of Cm2Tf and CmCTf were obtained. The fluorescence lifetimes of CmCTf and CmNTf were estimated to be 220 and 206 μs, respectively, and correspond to about two water molecules and seven other ligands in the coordination environment of Cm(III) at both Fe(III) binding sites of transferrin. Furthermore, the stability constants for the N- and C-lobe of Cm2Tf were determined experimentally to be log KC = 8.8 ± 0.3 and log KN = 7.0 ± 0.1 (pH 8.6), respectively.29KC and KN were derived from direct titration of transferrin with CmCl3 and reverse NTA competition titrations using UV-visible and fluorescence spectroscopy with indirect and direct excitation of Cm(III) at 280 and 397 nm. Since there is no variation in pH the formation of further (non-specific) Cm(III) transferrin species cannot be excluded.
Time-resolved laser fluorescence spectroscopy (TRLFS) is a very sensitive method for determination of the speciation of lanthanides and actinides in submicromolar concentration ranges.35 Because of its excellent fluorescence properties Cm(III) is used as a representative for trivalent actinides.36 Fluorescence spectra of different Cm(III) species are characterized by the shape and position of the emission bands and provide information on the coordination environment of the metal ion. In contrast to the work of Sturzbecher-Hoehne et al. who studied the complexation of Cm(III) with transferrin at pH 8.6, the present work focuses on the pH dependency of the complexation reaction. Furthermore, the Cm(III) transferrin system was studied at physiological temperature. Fluorescence lifetimes of the pH dependent Cm(III) transferrin species were determined to obtain valuable information on the coordination structure.
In addition to the TRLFS measurements, extended X-ray absorption fine-structure (EXAFS) spectra of Am(III) transferrin at pH 7.2 and 8.5 were recorded to get detailed information on the coordination environment of the metal ion. These measurements were performed at low temperatures (77 K) to improve the signal-to-noise ratio.
Experimental section
Chemicals and sample preparation
The protein samples were prepared in TRIS or HEPES buffered solutions (10 mM, pH 7.4) with a physiological sodium chloride medium of 0.15 mM NaCl using ultrapure water (Millipore, Billerica, MA, USA; 18.2 MΩcm). Human serum apo-transferrin of high reagent grade (apo-transferrin human, 98%) was purchased from Sigma, Calbiochem and Applichem. Commercially available transferrin is obtained from human blood serum. Since about 30% of transferrin in the blood is complexed with Fe(III), a complexing agent e.g. EDTA or citrate salt is added to remove Fe(III) quantitatively.37 Separation of the complexing agent with the bound Fe(III) from the transferrin using ultrafiltration yields Fe(III)-free transferrin. EDTA is a strong complexing ligand for trivalent actinides and the Cm(III) concentration used for the TRLFS measurements is quite low (c(Cm) = 1 × 10⁻⁷ M). Hence, it is necessary to purify the commercially available transferrin to remove the remaining traces of EDTA by size exclusion chromatography and filtration before use according to the protocol of Harris et al.17,38 100 mg of apo-transferrin were dissolved in 4 ml of 10 mM HEPES or TRIS buffer (pH 7.4) and passed through a 2 × 30 cm column (25 g Sephadex G-25 medium, GE Healthcare). After identification of the protein containing eluent fractions by TRLFS, the transferrin solution was passed through Amicon Centrifugal Filter Units (30 kDa) and washed five times each with 2 ml of a buffer solution. The protein concentration of the transferrin stock solution was determined by UV/Vis spectroscopy at λ = 280 nm using an extinction coefficient of ε = 93![[thin space (1/6-em)]](https://www.rsc.org/images/entities/char_2009.gif) 000 M−1 cm−1.39
000 M−1 cm−1.39
The Cm(III) stock solution used for the TRLFS studies (c(Cm) = 3.33 × 10⁻⁶ M in 15.7 mM HClO4) had an isotopic mass distribution of 89.7% Cm-248, 9.4% Cm-246, and ≤1% Cm-243, Cm-244, Cm-245 and Cm-247. The Cm(III) concentration of the TRLFS samples was fixed at 1.00 × 10⁻⁷ M by adding 30 μl of the Cm(III) stock solution to 970 μl of a buffered transferrin solution with a concentration of 4.85 × 10⁻⁶ M, resulting in a final transferrin concentration of 5.00 × 10⁻⁶ M. Complexation studies were carried out at varying pH values between 3.5 and 11.0. The pH was adjusted using NaOH and HCl solutions of different concentrations (1.0 M, 0.2 M, and 0.1 M). TRLFS measurements were performed at room temperature (296 K) and physiological temperature (310 K).
The concentration of the Am(III) stock solution used for the EXAFS measurements was c(Am-243) = 1.64 × 10⁻² M in 0.5 M HNO3. Two Am(III) transferrin samples were prepared with c(Am) = 5.00 × 10⁻⁴ M and c(Tf) = 2.40 × 10⁻³ M at pH 7.2 and 8.5. The Am(III) EXAFS measurements were performed at 70 K.
Analytical methods
For lifetime measurements the delay time between the laser pulse and the detection of the fluorescence emission was increased continuously with time intervals of Δt = 15 μs. The lifetime τ is obtained by fitting the fluorescence intensity I as a function of the delay time τ according to
| I(λ) = I0(λ)·e−t/τ | (1) |
For energy calibration, a Zr foil was measured simultaneously with each sample. The data evaluation was performed using the software packages Athena 0.8.061 and EXAFSPAK.41,42 Theoretical scattering phases and amplitudes were calculated with FEFF8.40 using the crystal structure of Fe-transferrin (RCSB protein database entry: 3QYT) and replacing Fe by Am.43 The best theoretical model was used to fit the k3-weighted raw Am LIII-edge EXAFS data using the Marquardt algorithm included in EXAFSPAK. The amplitude reduction factor S02 was set to 0.9.
Results
Identification of transferrin impurities by TRLFS
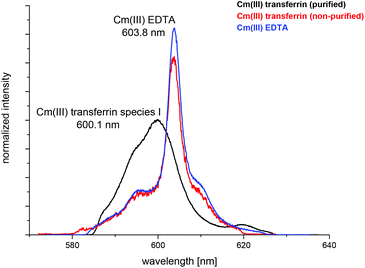
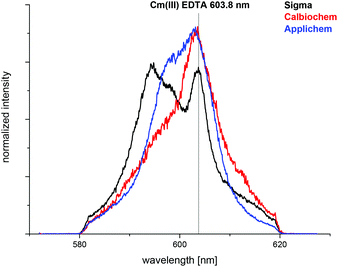
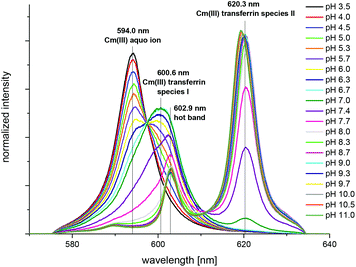
The complexation of Cm(III) with commercially available apo-transferrins from different suppliers was investigated at pH 7.4 before and after purification using TRLFS. The Cm(III) spectra with non-purified transferrin show a sharp emission band at λmax = 603.8 nm resulting from the formation of a Cm(III) EDTA complex (Fig. 1).44 This confirms that commercially available transferrin is contaminated with EDTA. The intensity of the Cm(III) EDTA emission band at λmax = 603.8 nm varies for different samples, indicating that transferrins from different suppliers contain varying amounts of EDTA (Fig. 2). Since the Cm(III) concentration used for TRLFS measurements is quite low (c(Cm) = 1 × 10⁻⁷ M) and EDTA is a strong complexing agent, transferrin has to be purified before usage in complexation studies. A reliable purification was performed using a combination of size exclusion chromatography followed by filtration. The quantitative separation of EDTA by size exclusion chromatography was monitored by addition of Cm(III) and by investigation of the eluent fractions with TRLFS. Spectra of purified transferrin samples at pH 7.4 display an emission band at λmax = 600.1 nm which can be attributed to the Cm(III) transferrin species I (see the next section).TRLFS studies of Cm(III) transferrin complexation
The spectrum of the Cm(III) transferrin species II is further characterized by two hot bands with emission maxima at λmax = 602.9 nm and 589.0 nm (very weak). To confirm that the emission band at 602.9 nm is a hot band and not the emission band of an additional Cm(III) transferrin species, direct excitation of the emitting state was performed using an excitation wavelength of 603 nm and 620 nm respectively (c(Cm) = 1.0 × 10⁻⁶ M and c(Tf) = 5.0 × 10⁻⁵ M, pH 9.0). As a result, excitation at 603 nm and 620 nm yields the same emission spectra confirming the existence of only one Cm(III) transferrin species at high pH (Fig. 4). The spectrum of the Cm(III) transferrin species II with the emission band at λmax = 620.3 nm and two hot bands at λmax = 602.9 nm and 589.0 nm corresponds to the results of Sturzbecher-Hoehne et al.29 The authors determined identical emission spectra of Cm2Tf and CmCTf at pH 8.6 using direct excitation of the protein at λ = 280 nm.
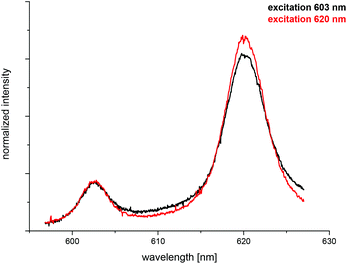 | ||
| Fig. 4 Normalized fluorescence spectra of the Cm(III) transferrin species II upon excitation at 603 nm and 620 nm; c(Cm) = 1.0 × 10⁻⁶ M and c(Tf) = 5.0 × 10⁻⁵ M, pH 9.0. | ||
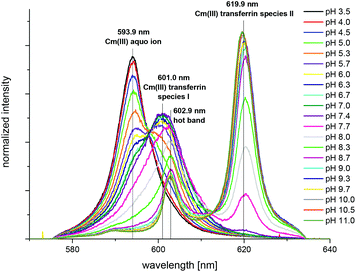
The fluorescence spectra of the pure components (Cm(III) aquo ion and the two Cm(III) transferrin species) were determined from the pH dependent fluorescence spectra and are shown in Fig. 5. The fractions of the three species at various pH values were determined by peak deconvolution of the emission spectra using the spectra of the pure components.
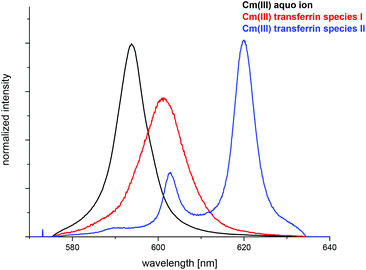 | ||
| Fig. 5 Normalized fluorescence spectra of the Cm(III) aquo ion, the Cm(III) transferrin species I and the Cm(III) transferrin species II. | ||
Since the total fluorescence intensity changed with varying pH, fluorescence intensity factors (fi factors) of the different Cm(III) transferrin species had to be determined and taken into account for the calculation of the concentration ratios. fi factors describe the decrease or increase of the fluorescence intensity relative to a reference species, in this case the Cm(III) aquo ion. They are determined from the overall fluorescence intensity of the spectra normalized to the concentration of Cm(III) in the sample and the energy of the laser beam as a function of pH according to eqn (2).47,48
| xaqfi(aq) + xtf1fi(tf1) + xtf2fi(tf2) = I | (2) |
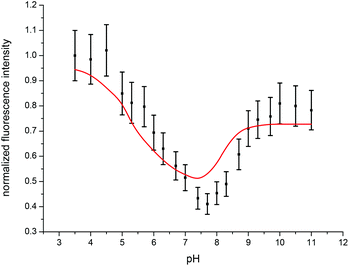 | ||
| Fig. 6 Experimentally determined (black) and calculated (red) fluorescence intensities of the emission spectra of the Cm(III) transferrin complexation as a function of pH at 296 K. | ||
Generally, complexation with organic ligands results in an increase of fi factors. Depending on the ligands, fi factors of up to 165 have been reported.49 An increase in fluorescence intensity is based on intramolecular ligand-to-metal energy transfer.50 This requires an overlap between the metal and ligand orbitals.51 The fluorescence intensity factors observed for the Cm(III) transferrin species I and II excited at 396.6 nm were determined to be <1. They are comparable to fi factors found for Cm(III) sorption processes on mineral surfaces or the formation of colloid-born Cm(III) species.52,53 The small fi factors of both Cm(III) transferrin species indicate that no energy transfer from the ligand to the metal occurs upon excitation at 396.6 nm as the absorption coefficient of transferrin at this wavelength is rather low. In contrast to this, Sturzbecher-Hoehne et al. estimated the fluorescence emitted from the Cm(III) transferrin species II excited at 280 nm (absorption maximum of the protein) to be at least 107 times more intense than that observed upon excitation at 397 nm (excitation of Cm(III)), indicating an excellent energy transfer from the protein to the metal.29
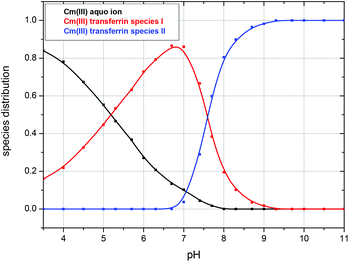
The fluorescence intensity factors of the three Cm(III) species were used for the calculation of the species concentrations as a function of pH (species distribution, Fig. 7). The Cm(III) aquo ion dominates the speciation up to pH 4.7, although the concentration decreases with increasing pH. The Cm(III) transferrin species I is formed in the pH range from 3.5 to 9.7 and becomes the dominating species between pH 5.0 and 8.2. Above pH 7.0 the concentration of the Cm(III) transferrin species II increases continuously until this species is solely present in solution above pH 9.7.
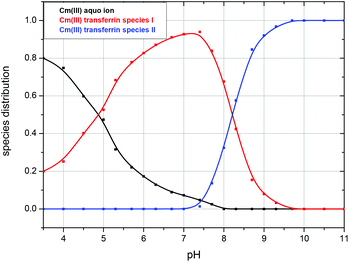 | ||
| Fig. 7 Speciation of Cm(III) with transferrin as a function of pH in a 10 mM TRIS buffered solution at room temperature (296 K); c(Cm) = 1.0 × 10⁻⁷ M and c(Tf) = 5.1 × 10⁻⁶ M. | ||
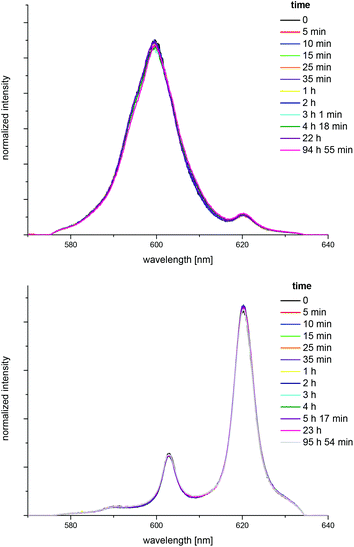
In order to characterize the different complex species, fluorescence lifetimes of the Cm(III) transferrin complexes were determined. The fluorescence lifetime of the Cm(III) transferrin species II was measured at high pH where this species is formed as a pure component. As an example, Fig. 8 shows the decay of the fluorescence emission of Cm(III) as a function of the delay time at pH 9.7. The fluorescence decay is identical for both, the emission bands at 620.3 nm and 602.9 nm, confirming the existence of only one Cm(III) transferrin II complex with the emission band at 602.9 nm being a hot band. With τ = 1/kobs the fluorescence lifetime is calculated from the slope (kobs = 0.00453 μs−1) of the linear plot. This yields an average fluorescence lifetime of τ = 221 ± 5 μs for the Cm(III) transferrin species II resulting from several measurements.
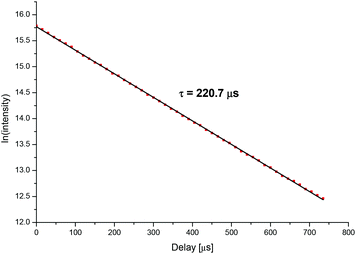 | ||
| Fig. 8 Decay of the fluorescence intensity of the Cm(III) transferrin species II as a function of the delay time, pH 9.7; c(Cm) = 1.0 × 10⁻⁷ M and c(Tf) = 5.1 × 10⁻⁶ M. | ||
The determination of the fluorescence lifetime of the Cm(III) transferrin species I is more complicated as it does not exist as a pure component at any pH value. For several samples containing Cm(III) and transferrin at pH 6.0 and 7.0 the decay of the fluorescence emission of Cm(III) as a function of delay time was fitted using a biexponential decay function. The fluorescence lifetime of the short-lived species was fixed at τ = 65 μs (lifetime of the Cm(III) aquo ion).46 Biexponential fitting of the results of several lifetime measurements provides an average fluorescence lifetime of τ = 129 ± 20 μs for the Cm(III) transferrin species I. The increased error is explained by the biexponential fitting procedure in comparison to the monoexponential decay of the fluorescence of the Cm(III) transferrin species II.
In accordance with the measurements at room temperature the total fluorescence intensity changes with varying pH. Due to the temperature dependency of fi factors, it is necessary to determine the fluorescence intensity factors of the Cm(III) transferrin species at 310 K using eqn (2). The fi factor of the Cm(III) aquo ion was set to 1 which results in fi factors of 0.58 for the Cm(III) transferrin species I and 1.04 for the Cm(III) transferrin species II. Comparison with the fluorescence intensity factors at room temperature (fi(Cm-Tf I) = 0.44, fi(Cm-Tf II) = 0.73) shows an increase of 0.14 and 0.31, respectively, and confirms the temperature dependency of the fi factors. Fig. 11 shows the measured and calculated fluorescence intensities according to eqn (2) using the determined fi factors. The fluorescence intensity factors of the three Cm(III) species were used for the calculation of the species concentrations as a function of pH (species distribution, Fig. 12). In comparison to the results at room temperature, the formation of the Cm(III) transferrin species II starts at lower pH values. The Cm(III) transferrin species I dominates in the pH range between 6.0 and 7.4 whereas the Cm(III) transferrin species II becomes the dominating species above pH 7.5. Comparison at the physiologically relevant pH value of 7.4 shows almost exclusive formation of the Cm(III) transferrin species I at room temperature whereas at elevated temperature 70% of the Cm(III) transferrin species I and 30% of the Cm(III) transferrin species II are formed (see the Discussion section).
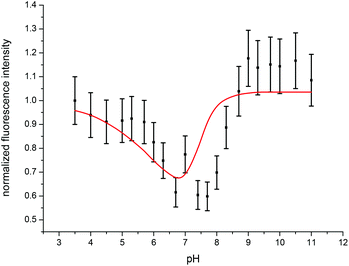 | ||
| Fig. 11 Experimentally determined (black) and calculated (red) fluorescence intensities of the emission spectra of the Cm(III) transferrin complexation as a function of pH at 310 K. | ||
EXAFS measurements of Am(III) transferrin
To complement the Cm(III) TRLFS results, the molecular structure of 0.5 mM Am(III) in the presence of 2.4 mM transferrin has been investigated by EXAFS at low temperature (77 K) at pH 7.2 and 8.5. The background corrected k3-weighted Am LIII-edge EXAFS spectra are presented together with the related Fourier transforms in Fig. 13.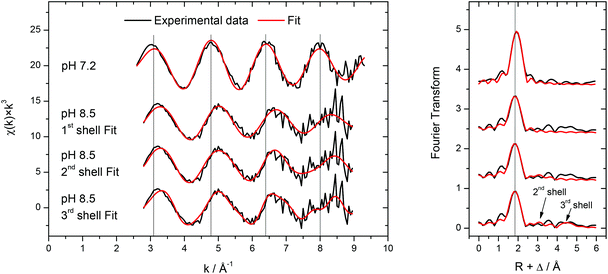 | ||
| Fig. 13 k 3-weighted Am LIII-edge EXAFS spectra (left) and related Fourier transforms (right) for 0.5 mM Am(III) in the presence of 2.4 mM transferrin at pH 7.2 and 8.5 recorded at T = 77 K. For the spectrum at pH = 8.5, three different fits are shown (fit parameters, see Table 1). | ||
The recorded EXAFS spectra at different pH values (Fig. 13, left) show clear differences indicating significant structural differences of the Am(III) species. The EXAFS-oscillations are visibly shifted (highlighted by the vertical lines in Fig. 13) and their amplitude is reduced when the pH is increased from 7.2 to 8.5. Comparison of the related Fourier transforms (Fig. 13, right) shows a slight but visible shift of the main peak to lower distance with increasing pH (again highlighted by a vertical line). The results of the fits of both spectra are summarized in Table 1. The spectrum at pH 7.2 is fitted by 8–9 oxygen atoms at a distance of 2.47 Å which is in good agreement with literature data for the aquo species of Am(III) and other trivalent actinides.59 Also the formation of a weak binding of Am(III) to transferrin resulting in an unspecific or partially bound species (comparable to the Cm(III) transferrin species I) cannot be excluded. The spectrum at pH 8.5 has been fitted with one, two or three shells. In all cases, about 9 nearest neighbors are present in the first coordination sphere at a lower distance of 2.38 Å as expected in the case of strong multidentate coordination of Am(III) at the transferrin binding cleft. Unspecific binding to functional groups of the protein surface would result in longer distances and can therefore be excluded. Comparing this Am(III) transferrin distance to the iron–ligand distances of human serum transferrin calculated by DFT, the present value of 2.38 Å is higher than the reported average distances of Fe(III) transferrin between 1.90 and 2.30 Å.60 The differences are related to the two times larger effective ionic radius of Am(III) compared to Fe(III) (IRFe(III) = 55 pm, IRAm(III) = 97.5 pm; the values are valid for a coordination number of six and Fe(III) low spin configuration).58 Furthermore, the coordination number has to be considered. The determined coordination number of ≈9 exceeds the expected value of 6 resulting from an octahedral coordination at the Fe(III) binding site of the transferrin molecule.
| pH | 1st shell | 2nd shell | 3rd shell | ΔE0 | Red. Er. | ||||||
|---|---|---|---|---|---|---|---|---|---|---|---|
| N | R/Å | σ/Å2 | N | R/Å | σ/Å2 | N | R/Å | σ/Å2 | |||
| a Held constant during fit. | |||||||||||
| 7.2 | 8.7 (0.5) | 2.47 (1) | 0.007 (1) | — | — | — | — | — | — | −6.2 (0.6) | 0.41 |
| 8.5 | 8.8 (1.0) | 2.38 (1) | 0.013 (2) | — | — | — | — | — | — | −3.8 (1.0) | 0.67 |
| 8.6 (1.0) | 2.38 (1) | 0.012 (2) | 3.0 (1.0) | 3.73 (3) | 0.003a | — | — | — | −3.8 (0.9) | 0.63 | |
| 8.8 (1.0) | 2.38 (1) | 0.013 (2) | 2.8 (1.0) | 3.72 (3) | 0.003a | 6.8 (2.3) | 5.19 (3) | 0.003a | −4.0 (0.9) | 0.59 | |
The inclusion of a second and a third coordination sphere with 2.8–3.0 neighbors at 3.72–3.73 Å and 6.8 neighbors at 5.19 Å in the fit leads to a slight but visible improvement of the fit as the reduced error decreases from 0.67 to 0.59 (Table 1). Due to the small difference in atomic number and the highly complex structure of transferrin, it is not possible to determine whether the different coordination shells consist of carbon, nitrogen, oxygen atoms or a mixture of them. Nevertheless, the presence of coordination shells at distances up to ∼5 Å in combination with the short oxygen distance in the first coordination sphere clearly indicates the presence of Am(III) in a complex but well-defined bonding environment within the transferrin molecule at pH = 8.5.
Discussion
Whereas in the literature the formation of only one Cm(III) transferrin species has been reported, it was possible to identify unambiguously different Cm(III) transferrin species (Cm(III) transferrin species I and II) as a function of pH for the first time using TRLFS. The spectra show a strong pH dependency of the complexation reaction of Cm(III) with transferrin at room temperature. The different Cm(III) transferrin species dominate in the pH ranges from 5.0 to 8.0 and 8.3 to 11.0, respectively. The spectrum of the Cm(III) transferrin species II with the emission band at λmax = 620 nm and two hot bands with emission maxima at 602.9 nm and 589.0 nm corresponds to the spectrum observed by Sturzbecher-Hoehne et al. upon excitation of transferrin at 280 nm and energy transfer to Cm(III) at pH 8.6.29 The shift of the emission band of a complex species relative to the emission band of the Cm(III) aquo ion is a measure of the ligand field splitting and is related to the complexation strength of the ligands. The emission band of the Cm(III) transferrin species I at 601.0 nm is shifted 7.2 nm relative to the aquo ion which is in the usual range of Cm(III) complexes with organic ligands.57,61–63 In contrast to this, an extraordinarily large shift as observed for the emission band of the Cm(III) transferrin species II (λmax = 620 nm) of 26 nm has so far only been reported for Cm(III) incorporated e.g. into calcite or Ca-montmorillonite.64–67 Furthermore, the emission band at 620.0 nm is extremely sharp which is characteristic of complexes with chelating ligands (e.g. EDTA, Fig. 1) whereas the emission band of the Cm(III) transferrin species I is significantly broader as it was observed for various Cm(III) sorption species.67–70 This indicates incorporation of Cm(III) into the Fe(III) binding site of transferrin above pH 8.3 and the formation of a species with partial complexation of Cm(III) to the protein in the pH range from 5.0 to 8.0. Between pH 7.4 and 9.0 both Cm(III) transferrin species are present.Although the binding mode is the same at both binding sites of transferrin they are not kinetically and thermodynamically equivalent. The C-terminal site is larger and has a higher affinity to the complexation of metal ions than the smaller N-terminal site. The log K values for the complexation of Cm(III) to the N- and C-lobe at pH 8.6 have been determined experimentally to be log KC = 8.8 ± 0.3 and log KN = 7.0 ± 0.1.29 They differ by almost two orders of magnitude which underlines the inequality of the binding sites. We therefore used a high excess of transferrin for the TRLFS measurements to ensure exclusive coordination of Cm(III) at the C-terminal binding site and the formation of a Cm(III) transferrin complex with a 1![[thin space (1/6-em)]](https://www.rsc.org/images/entities/char_2009.gif) :
:![[thin space (1/6-em)]](https://www.rsc.org/images/entities/char_2009.gif) 1 stoichiometry.
1 stoichiometry.
Furthermore, the fluorescence lifetimes of the different Cm(III) species were determined. According to the empirical Kimura equation
| nH2O = 0.65kobs − 0.88, kobs = 1/τ | (3) |
The fluorescence lifetime of the Cm(III) transferrin species I was determined to be τ = 129 ± 20 μs which corresponds to 4.2 ± 1.0 coordinated water molecules. This suggests that Cm(III) is coordinated by four to five ligands (amino acids of the protein and synergistic anions like OH−, CO32− and HCO3−). The broad emission band in combination with the bathochromic shift of 7.2 nm indicates the formation of a Cm(III) species partially bound to transferrin indicating slight variation in the inner coordination sphere of Cm(III). This binding is supposed to occur presumably at the binding site although complexation at a nonspecific site cannot be excluded.
Since there is no literature data of Cm(III) complexed with transferrin available the presented results will be compared to literature data of Gd(III) transferrin. Gd is the lanthanide homolog of Cm. Both trivalent ions are characterized by similar physical and chemical properties and comparable effective ionic radii (nine-fold coordination: IRGd(III) = 110.7 pm, IRCm(III) = 114.6 pm) resulting in similar complex formation with transferrin.58,73 UV/Vis, ESR and NMRD measurements show that specific and stoichiometric complexation of Gd(III) to the binding sites of transferrin occurs predominantly at pH ≥ 8.74 At pH ≤ 7 Gd(III) is bound to nonspecific sites of transferrin. This leads to a complex coordination chemistry in the physiologically relevant pH range involving the formation of Gd(III) transferrin complexes at the specific (Fe(III) binding site) and nonspecific binding sites. These results are in good agreement with the formation of a Cm(III) transferrin species incorporated at the Fe(III) binding site above pH 7 and a partially coordinated Cm(III) transferrin species (possibly at a nonspecific site) at lower pH values.
In comparison with TRLFS results at room temperature the complexation of Cm(III) with transferrin at physiologically relevant temperature was investigated. The spectra show the formation of the same Cm(III) transferrin species with emission bands at 600.6 nm and 620.3 nm respectively and a “hot band” at 602.9 nm as obtained at room temperature. The Cm(III) transferrin species II is formed at pH values about 0.5 units lower compared to room temperature conditions. At physiological temperature (310 K) at pH 7.4 about 70% of the Cm(III) transferrin species I and 30% of the Cm(III) transferrin species II are formed whereas the species distribution at room temperature is dominated by more than 90% of the Cm(III) transferrin species I. This change in the speciation of the Cm(III) transferrin species with increasing temperature involves an increase of the stability constants of the Cm(III) transferrin species of 1.3 orders of magnitude.
The Cm(III) TRLFS results are compared to EXAFS results of the Am(III) transferrin system at high pH (pH 8.5). The average distance of 2.38 Å as well as the presence of several shells at higher distances indicate the complexation of Am(III) at the Fe(III) binding cleft which is in accordance with the formation of the Cm(III) transferrin species II. The speciation of Cm(III) at pH 7.0 is dominated by the Cm(III) transferrin species I, whereas the EXAFS results show the formation of more Am(III) aquo ion at pH 7.2. Since a weak binding of Am(III) to transferrin might result in only slightly smaller distances compared to the Am(III) aquo ion, the formation of a certain amount of an unspecific or partially bound Am(III) transferrin species (comparable to the Cm(III) transferrin species I) cannot be excluded. Am(III) and Cm(III) have comparable physical and chemical properties (IRCm(III) = 98.0 pm, IRAm(III) = 97.5 pm; the values are valid for a coordination number of six).75 Furthermore, the theoretically derived log K values for the complexation of both metal ions to the C- and N-lobe of transferrin are almost identical (Cm(III): log KC = 10.3, log KN = 8.7; Am(III): log KC = 10.1, log KN = 8.5).28 Slight discrepancy in the speciation of Am(III) and Cm(III) with transferrin cannot be attributed to a different complexation behaviour but might be due to significant differences in the ligand to metal ion concentration ratios. Furthermore, the Am(III) EXAFS measurements were performed at low temperature (77 K) while the complexation of Cm(III) with transferrin was studied at room and body temperatures. Our TRLFS results on Cm(III) transferrin show a strong temperature dependency of the complexation reaction which contributes to the differences in the speciation of Cm(III) and Am(III) with transferrin.
The average distance of the 9 nearest neighbors (2.38 Å) of Am(III) transferrin at pH 8.6 is slightly higher compared to the distances found for the Pu(IV)/Np(IV)-NTA-Tf system at pH 8.0 (4 O/N at 2.21–2.23 Å and 5 O/N at 2.38–2.39 Å).27 This can be explained by the modified coordination environment of the metal ion at the binding site of transferrin when NTA is used as an additional anion.
Under physiological conditions Fe(III) is incorporated at the binding site and forms a stable complex with transferrin until the pH is lowered to 5.3 during endocytosis. In contrast to this, the incorporated Cm(III) transferrin species II is formed above pH 7.0 and becomes the dominant species above pH 7.7. At pH 7.4, both Cm(III) transferrin species (I and II) exist. The differences in the complexation behavior of Cm(III) and Fe(III) to transferrin are attributed to the two times larger effective ionic radius of Cm(III) relative to that of Fe(III) (IRFe(III) = 55 pm, IRCm(III) = 97 pm; the values are valid for a coordination number of six and Fe(III) low spin configuration).58 This means that Cm(III) does not fit optimally into the binding cleft which leads to a reduced incorporation of Cm(III) requiring higher pH values than for Fe(III). Coordination of Fe(III) at the binding site results in a domain closure which is important for the recognition of the metal transferrin complex by the receptor.5,16 Since a certain amount of Cm(III) is also incorporated at the transferrin binding site at physiological temperature the important question arises whether the Cm(III) transferrin complex might be recognized by the receptor as well and brought into cells via endocytosis.29 First studies by Sturzbecher-Hoehne et al. show that the shape of the emission spectrum and the fluorescence lifetime of Cm2Tf remain unaltered upon receptor binding indicating that the coordination environment of Cm(III) does not change when the protein is coordinated to the receptor.29 Deblonde et al. determined stability constants of the TfR:(MxTf)y adducts which follow the order Fe(III) ≫ Th(IV) ∼ U(VI) ∼ Cm(III) > Ln(III) ∼ Ga(III) ⋙ Yb(III) ∼ Pu(IV) using a high performance liquid chromatography-based method.76 The thermodynamic data show that Cm(III) might follow the receptor mediated iron acquisition pathway after incorporation.
Conclusions
In the present study two Cm(III) transferrin species were identified for the first time and characterized spectroscopically. At pH 7.4 about 70% of the partially bound (to the Fe(III) binding site or unspecific sites) Cm(III) transferrin species and 30% of the Cm(III) transferrin species with Cm(III) incorporated at the Fe(III) binding site are formed at physiological temperature (310 K). The incorporation of Cm(III) at the transferrin binding site is an important requirement for the recognition of the Cm(III) transferrin complex by the receptor followed by endocytosis which might be a possible pathway for the distribution of Cm(III) in the human body.The results presented in this study will contribute to a better understanding of relevant biochemical reactions of actinides upon incorporation and can be of major importance for the future development of potential decontamination therapies. We showed that TRLFS is a powerful tool for the investigation of the complexation of Cm(III) with transferrin. This method will be applied further to determine thermodynamic data of the complexation reactions and to investigate the influence of the synergistic anion. Additional work regarding the interaction of Eu(III) with transferrin using TRLFS is in progress.
Acknowledgements
The synchrotron-based experiments were performed at the INE beamline of the ANKA synchrotron light source in Karlsruhe, Germany. The authors thank J. Rothe and K. Dardenne for their support with the EXAFS measurements.Notes and references
- E. Ansoborlo, L. Bion, D. Doizi, C. Moulin, V. Lourenco, C. Madic, G. Cote, J. Van der Lee and V. Moulin, Radiat. Prot. Dosim., 2007, 127, 97 CrossRef CAS PubMed.
- V. Moulin, E. Ansoborlo, L. Bion, D. Doizi, C. Moulin, G. Cote, C. Madic and J. Van der Lee, Radioprotection, 2005, 40, S11 CrossRef.
- A. E. V. Gorden, J. D. Xu, K. N. Raymond and P. Durbin, Chem. Rev., 2003, 103, 4207 CrossRef CAS PubMed.
- D. M. Taylor, J. Alloys Compd., 1998, 271, 6 CrossRef.
- H. Z. Sun, H. Y. Li and P. J. Sadler, Chem. Rev., 1999, 99, 2817 CrossRef CAS PubMed.
- R. T. A. MacGillivray, E. Mendez, J. G. Shewale, S. K. Sinha, J. Linebackzins and K. Brew, J. Biol. Chem., 1983, 258, 3543 CAS.
- R. T. A. MacGillivray, E. Mendez, S. K. Sinha, M. R. Sutton, J. Linebackzins and K. Brew, Proc. Natl. Acad. Sci. U. S. A., 1982, 79, 2504 CrossRef CAS.
- J. Vanrenswoude, K. R. Bridges, J. B. Harford and R. D. Klausner, Proc. Natl. Acad. Sci. U. S. A., 1982, 79, 6186 CrossRef CAS.
- R. D. Klausner, G. Ashwell, J. Vanrenswoude, J. B. Harford and K. R. Bridges, Proc. Natl. Acad. Sci. U. S. A., 1983, 80, 2263 CrossRef CAS.
- J. Wally, P. J. Halbrooks, C. Vonrhein, M. A. Rould, S. J. Everse, A. B. Mason and S. K. Buchanan, J. Biol. Chem., 2006, 281, 24934 CrossRef CAS PubMed.
- R. T. A. MacGillivray, S. A. Moore, J. Chen, B. F. Anderson, H. Baker, Y. G. Luo, M. Bewley, C. A. Smith, M. E. P. Murphy, Y. Wang, A. B. Mason, R. C. Woodworth, G. D. Brayer and E. N. Baker, Biochemistry, 1998, 37, 7919 CrossRef CAS PubMed.
- P. Aisen, R. Aasa, B. Malmstro and T. Vanngard, J. Biol. Chem., 1967, 242, 2484 CAS.
- M. R. Schlabach and G. W. Bates, J. Biol. Chem., 1975, 250, 2182 CAS.
- B. F. Anderson, H. M. Baker, E. J. Dodson, G. E. Norris, S. V. Rumball, J. M. Waters and E. N. Baker, Proc. Natl. Acad. Sci. U. S. A., 1987, 84, 1769 CrossRef CAS.
- P. Aisen, A. Leibman and J. Zweier, J. Biol. Chem., 1978, 253, 1930 CAS.
- P. D. Jeffrey, M. C. Bewley, R. T. A. MacGillivray, A. B. Mason, R. C. Woodworth and E. N. Baker, Biochemistry, 1998, 37, 13978 CrossRef CAS PubMed.
- W. R. Harris and V. L. Pecoraro, Biochemistry, 1983, 22, 292 CrossRef CAS.
- W. R. Harris and L. Messori, Coord. Chem. Rev., 2002, 228, 237 CrossRef CAS.
- C. A. Smith, A. J. Sutherland-Smith, B. K. Keppler, F. Kratz and E. N. Baker, J. Biol. Inorg. Chem., 1996, 1, 424 CrossRef CAS.
- F. Kratz, M. Hartmann, B. Keppler and L. Messori, J. Biol. Chem., 1994, 269, 2581 CAS.
- W. R. Harris, Inorg. Chem., 1986, 25, 2041 CrossRef CAS.
- W. R. Harris and Y. Chen, Inorg. Chem., 1992, 31, 5001 CrossRef CAS.
- W. R. Harris, C. J. Carrano, V. L. Pecoraro and K. N. Raymond, J. Am. Chem. Soc., 1981, 103, 2231 CrossRef CAS.
- S. Scapolan, E. Ansoborlo, C. Moulin and C. Madic, Radiat. Prot. Dosim., 1998, 79, 505 CrossRef CAS.
- I. Llorens, C. Den Auwer, P. Moisy, E. Ansoborlo, C. Vidaud and H. Funke, FEBS J., 2005, 272, 1739 CrossRef CAS PubMed.
- C. Den Auwer, I. Llorens, P. Moisy, C. Vidaud, F. Goudard, C. Barbot, P. L. Solari and H. Funke, Radiochim. Acta, 2005, 93, 699 CrossRef CAS.
- A. Jeanson, M. Ferrand, H. Funke, C. Hennig, P. Moisy, P. L. Solari, C. Vidaud and C. Den Auwer, Chem.–Eur. J., 2010, 16, 1378 CrossRef CAS PubMed.
- E. Ansoborlo, O. Prat, P. Moisy, C. Den Auwer, P. Guilbaud, M. Carriere, B. Gouget, J. Duffield, D. Doizi, T. Vercouter, C. Moulin and V. Moulin, Biochimie, 2006, 88, 1605 CrossRef CAS PubMed.
- M. Sturzbecher-Hoehne, C. Goujon, G. J. P. Deblonde, A. B. Mason and R. J. Abergel, J. Am. Chem. Soc., 2013, 135, 2676 CrossRef CAS PubMed.
- R. Racine, P. Moisy, F. Paquet, H. Metivier and C. Madic, Radiochim. Acta, 2003, 91, 115 CrossRef CAS.
- J. Michon, S. Frelon, C. Garnier and F. Coppin, J. Fluoresc., 2010, 20, 581 CrossRef CAS PubMed.
- D. M. Taylor and L. C. Farrow, Nucl. Med. Biol., 1987, 14, 27 CAS.
- D. M. Taylor, in Perspectives in Bioinorganic Chemistry, ed. R. W. Hay, J. R. Dilworth and K. B. Nolan, JAI Press Inc., 1993, vol. 2, p. 139 Search PubMed.
- H. Z. Sun, M. C. Cox, H. Y. Li and P. J. Sadler, Struct. Bonding, 1997, 88, 71 CrossRef CAS.
- N. M. Edelstein, R. Klenze, T. Fanghänel and S. Hubert, Coord. Chem. Rev., 2006, 250, 948 CrossRef CAS PubMed.
- I. J. Kim, R. Klenze and H. Wimmer, Eur. J. Solid State Inorg. Chem., 1991, 28, 347 Search PubMed.
- H. Haupt, EP, 0 490 384 A1, 1992 Search PubMed.
- W. R. Harris, B. S. Yang, S. Abdollahi and Y. Hamada, J. Inorg. Biochem., 1999, 76, 231 CrossRef CAS.
- N. D. Chasteen, Coord. Chem. Rev., 1977, 22, 1 CrossRef CAS.
- J. Rothe, S. Butorin, K. Dardenne, M. A. Denecke, B. Kienzler, M. Loble, V. Metz, A. Seibert, M. Steppert, T. Vitova, C. Walther and H. Geckeis, Rev. Sci. Instrum., 2012, 83, 043105 CrossRef CAS PubMed.
- B. Ravel and M. Newville, J. Synchrotron Radiat., 2005, 12, 537 CrossRef CAS PubMed.
- G. N. George and I. J. Pickering, in EXAFSPAK – A suite of computer programs for analysis of X-ray absorption spectra, Stanford Synchrotron Radiation Laboratory, Stanford/USA, 2000 Search PubMed.
- A. L. Ankudinov, C. E. Bouldin, J. J. Rehr, J. Sims and H. Hung, Phys. Rev. B: Condens. Matter, 2002, 65 CrossRef CAS.
- R. Klenze, J. I. Kim and H. Wimmer, Radiochim. Acta, 1991, 52–3, 97 Search PubMed.
- J. V. Beitz, Radiochim. Acta, 1991, 52–3, 35 Search PubMed.
- J. V. Beitz and J. P. Hessler, Nucl. Technol., 1980, 51, 169 CAS.
- T. Fanghänel, H. T. Weger, T. Konnecke, V. Neck, P. Paviet-Hartmann, E. Steinle and J. I. Kim, Radiochim. Acta, 1998, 82, 47 Search PubMed.
- K. H. Chung, R. Klenze, K. K. Park, P. Paviet-Hartmann and J. I. Kim, Radiochim. Acta, 1998, 82, 215 CAS.
- H. Geckeis, Annual Report 2012: Institute for Nuclear Waste Disposal, Karlsruhe, 2012.
- S. I. Weissman, J. Chem. Phys., 1942, 10, 214 CrossRef CAS PubMed.
- J. C. G. Bunzli and C. Piguet, Chem. Soc. Rev., 2005, 34, 1048 RSC.
- T. Rabung, H. Geckeis, X. K. Wang, J. Rothe, M. A. Denecke, R. Klenze and T. Fanghänel, Radiochim. Acta, 2006, 94, 609 CrossRef CAS PubMed.
- X. K. Wang, T. Rabung, H. Geckeis, P. J. Panak, R. Klenze and T. Fanghänel, Radiochim. Acta, 2004, 92, 691 CrossRef CAS.
- E. Toth, E. Brucher, I. Lazar and I. Toth, Inorg. Chem., 1994, 33, 4070 CrossRef CAS.
- S. L. Wu and W. D. Horrocks, J. Chem. Soc., Dalton Trans., 1997, 1497 RSC.
- V. Kubicek, J. Havlickova, J. Kotek, T. Gyula, P. Hermann, E. Toth and I. Lukes, Inorg. Chem., 2010, 49, 10960 CrossRef CAS PubMed.
- A. Bremer, A. Geist and P. J. Panak, Dalton Trans., 2012, 41, 7582 RSC.
- R. D. Shannon, Acta Crystallogr. Sect. A: Found. Crystallogr., 1976, 32, 751 CrossRef.
- P. G. Allen, J. J. Bucher, D. K. Shuh, N. M. Edelstein and I. Craig, Inorg. Chem., 2000, 39, 595 CrossRef CAS.
- D. Rinaldo and M. J. Field, Aust. J. Chem., 2004, 57, 1219 CrossRef CAS.
- J. I. Kim, H. Wimmer and R. Klenze, Radiochim. Acta, 1991, 54, 35 CAS.
- H. Moll and G. Bernhard, J. Coord. Chem., 2007, 60, 1795 CrossRef CAS.
- H. Moll, G. Geipel and G. Bernhard, Inorg. Chim. Acta, 2005, 358, 2275 CrossRef CAS PubMed.
- T. Stumpf, M. M. Fernandes, C. Walther, K. Dardenne and T. Fanghänel, J. Colloid Interface Sci., 2006, 302, 240 CrossRef CAS PubMed.
- T. Stumpf and T. Fanghänel, J. Colloid Interface Sci., 2002, 249, 119 CrossRef CAS PubMed.
- M. M. Fernandes, T. Stumpf, T. Rabung, D. Bosbach and T. Fanghänel, Geochim. Cosmochim. Acta, 2008, 72, 464 CrossRef CAS PubMed.
- T. Rabung, M. C. Pierret, A. Bauer, H. Geckeis, M. H. Bradbury and B. Baeyens, Geochim. Cosmochim. Acta, 2005, 69, 5393 CrossRef CAS PubMed.
- T. Stumpf, T. Rabung, R. Klenze, H. Geckeis and J. I. Kim, J. Colloid Interface Sci., 2001, 238, 219 CrossRef CAS PubMed.
- N. Huittinen, T. Rabung, J. Lutzenkirchen, S. C. Mitchell, B. R. Bickmore, J. Lehto and H. Geckeis, J. Colloid Interface Sci., 2009, 332, 158 CrossRef CAS PubMed.
- T. Rabung, D. Schild, H. Geckeis, R. Klenze and T. Fanghanel, J. Phys. Chem. B, 2004, 108, 17160 CrossRef CAS.
- T. Kimura and G. R. Choppin, J. Alloys Compd., 1994, 213/214, 313 CrossRef CAS.
- T. Kimura, G. R. Choppin, Y. Kato and Z. Yoshida, Radiochim. Acta, 1996, 72, 61 CrossRef CAS.
- F. H. David and V. Vokhmin, New J. Chem., 2003, 27, 1627 RSC.
- P. B. Ohara and S. H. Koenig, Biochemistry, 1986, 25, 1445 CrossRef CAS.
- R. D. Shannon and C. T. Prewitt, Acta Crystallogr., Sect. B: Struct. Crystallogr. Cryst. Chem., 1969, 25, 925 CrossRef CAS.
- G. J. P. Deblonde, M. Sturzbecher-Hoehne, A. B. Mason and R. J. Abergel, Metallomics, 2013, 5, 619 RSC.
| This journal is © The Royal Society of Chemistry 2014 |

