 Open Access Article
Creative Commons Attribution 3.0 Unported Licence
The role of carboxylato ligand dissociation in the oxidation of chrysin with H2O2 catalysed by [Mn2III,IV(μ-CH3COO)(μ-O)2(Me4dtne)](PF6)2†
Shaghayegh
Abdolahzadeh
a,
Nicola M.
Boyle
a,
M. Lisa
Hoogendijk
a,
Ronald
Hage
b,
Johannes W.
de Boer
b and
Wesley R.
Browne
*a
aStratingh Institute for Chemistry, Faculty of Mathematics and Natural Sciences, University of Groningen, Nijenborgh 4, 9747 AG, Groningen, The Netherlands. Tel: +0031 50363 4428E-mail: w.r.browne@rug.nl
bCatexel Ltd, BioPartner Center Leiden, Galileiweg 8, 2333 BD Leiden, The Netherlands
First published on 14th February 2014
Abstract
The aqueous and non-aqueous chemistry of the complex [Mn2III,IV(μ-CH3COO)(μ-O)2(Me4dtne)](PF6)2 (where Me4dtne = 1,2-bis(4,7-dimethyl-1,4,7-triazacyclonon-1-yl)ethane), which has been demonstrated as an exceptionally active catalyst in the bleaching of raw cotton and especially wood pulp at high pH (>11), is explored by UV/vis absorption, Raman and EPR spectroscopies and cyclic voltammetry. The data indicate that dissociation of the μ-acetato bridge is essential to the catalyst activity and rationalises the effect of sequestrants such as DTPA on its performance.
Introduction
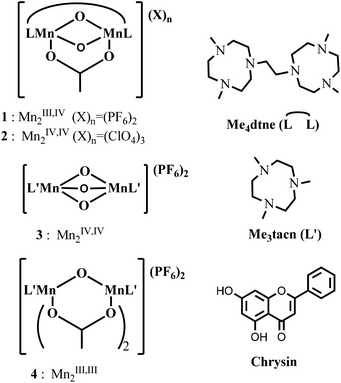
The coordination chemistry of manganese complexes1 bearing ligands based on the tridentate macrocycle 1,4,7-triazacyclononane (tacn) has attracted considerable attention both with respect to their solid state and magnetic properties and as models for bioinorganic systems.2 Since the first reports of multinuclear manganese complexes incorporating such ligands in the mid-1980s, interest in manganese chemistry is driven in large part by a wide range of oxidation states that are accessible, e.g., from Mn2II,II to Mn2IV,IV. Among the many multinuclear manganese complexes reported to date, dinuclear manganese complexes containing one3 or more μ-oxido groups4 have perhaps been the most extensively studied.5Manganese complexes derived from Me3tacn (N,N′,N′′-trimethyl-1,4,7-triazacyclonane) and Me4dtne (1,2-bis(4,7-dimethyl-1,4,7-triazacyclonon-1-yl)ethane), such as the mixed-valence complex [Mn2III,IV(μ-CH3COO)(μ-O)2(Me4dtne)](PF6)2 (1),6,7 and the complexes [Mn2IV,IV(μ-CH3COO)(μ-O)2(Me4dtne)](ClO4)3 (2),7 [Mn2IV,IV(μ-O)3(Me3tacn)2](PF6)2 (3),2a,b and [Mn2III,III(μ-CH3COO)2(μ-O)(Me3tacn)2](PF6)2 (4),2a,b were developed by Wieghardt and co-workers, with the aim of stabilizing μ-oxido bridged manganese units.
These complexes were described originally by Wieghardt and co-workers as models for manganese catalases and the oxygen-evolving complex of photosystem II,2b,7 in particular with respect to extensive EPR spectroscopic studies.7 However, in addition to their use as structural models for the study of enzymes and bioinorganic clusters, many of these complexes have been shown to catalyse oxidative transformations with H2O2.8 Indeed complex 3 has shown good to excellent activity in the presence of carboxylic acids in a range of oxidative transformations including the epoxidation and cis-dihydroxylation of alkenes9–13 and the oxidation of alcohols and aldehydes.14,15
Recent mechanistic studies16 and in particular speciation analysis in non-aqueous media have demonstrated that,10,11 in the case of 3, activity in oxidation catalysis is critically dependent on the formation of μ-carboxylato bridged complexes analogous to 4in situ. A key observation in these systems was that the carboxylato ligands are central to determining both the activity and selectivity of 3 in the oxidation of alkenes in particular10 and, for example, as the source of chirality in the enantioselective cis-dihydroxylation of alkenes.13
In contrast to the selective oxidation of organic substrates, the application of complexes 1–4 in industrial bleaching applications, e.g., raw cotton8 and wood pulp,17–19 with H2O2 requires that the complexes operate under conditions of high pH (11–11.5) in aqueous buffers and in the presence of sequestrants (e.g., diethylene-triamine-pentaacetic acid, DTPA). The latter is important for sequestering trace metal ions that can disproportionate H2O2. Interest in such catalysts for cotton bleaching is focused especially on limiting the extent of cellulose damage through the use of milder reaction conditions (i.e. lower temperatures and shorter reaction times); however, the treatments require high pH in order to remove fats and other unwanted components from raw cotton and to remove partially oxidised lignin in the case of wood pulp.18d Under these conditions it is complex 1 rather than 3 that has shown a better performance in cotton bleaching, especially at relatively high pH (11–11.5), which enables significantly lower temperatures to be used than the 90–100 °C normally employed for such processes.17
Central questions relating to the application of 1 in such bulk processes are: what are the effects of other components, especially sequestrants, and why does the catalyst work optimally at such high pH values? Answering these questions necessitates elucidating the structure of the species present at different pH values and potential interactions with the carboxylates that are commonly present in the additives used (e.g., DTPA).
Although the solid state and magnetic properties of these complexes have been examined in detail,7 their speciation in solution and especially in water has received relatively little attention. This lack of data is in large part due to the tendency of these complexes to undergo disproportionation reactions in solution and to form labile high-spin d5 MnII complexes, which tend to form manganese oxides at high pH. Nevertheless, understanding the pH dependence of the coordination chemistry of manganese complexes is of wider importance due to the numerous roles the complexes play in both natural and artificial systems, including the active sites of a number of metalloenzymes,20 and in water oxidation catalysis, which has seen a recent surge in interest.21
In the present contribution, the pH dependent aqueous and non-aqueous coordination chemistry of 1 was investigated by UV/vis absorption, Raman and electron paramagnetic resonance (EPR) spectroscopies, as well as cyclic voltammetry. The importance of carboxylato ligands in determining catalytic activity is of central interest. In contrast to complex 3, the activity of which, at low pH, depends critically on the presence of carboxylato ligands,10 here we show that for 1, at high pH, dissociation of the μ-carboxylato ligand is key to its activity in oxidation catalysis as demonstrated in the bleaching of chrysin containing aqueous solutions (Fig. 1) with H2O2. Furthermore, we demonstrate that carbonate, either added deliberately or present due to absorption of CO2 from the atmosphere, especially at high pH, displaces the acetate ligand of 1 and is also effective in suppressing catalytic activity through coordination to the dinuclear complex.
Results
Complexes 1 and 2 (Fig. 1) were prepared as described earlier6,7 with slight modifications. The solution chemistry of 1 and 2 was first studied in acetonitrile by UV/vis absorption, Raman and resonance Raman spectroscopy and by cyclic voltammetry in order to examine the effect of ligand exchange on their spectroscopic and electrochemical properties.UV/vis absorption spectroscopy and cyclic voltammetry in acetonitrile
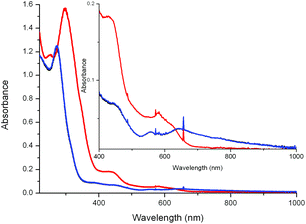
The UV/vis absorption spectrum of 1 in CH3CN in the presence of various carboxylic acids is shown in Fig. 2. Addition of carboxylic acids, such as CCl3CO2H, CF3CO2H and CH2BrCO2H, benzoic acid and 2,6-dichlorobenzoic acid, has relatively little, if any, effect on the UV/vis absorption spectrum of 1 in CH3CN. In the case of CCl3CO2H and CF3CO2H, however, over time (ca. 30 min) a blue shift in the visible absorption is observed, which, on the basis of the pH dependence of the absorption spectrum of 1 and by comparison with 2 (vide infra), is ascribed to the dissociation of the carboxylato bridge.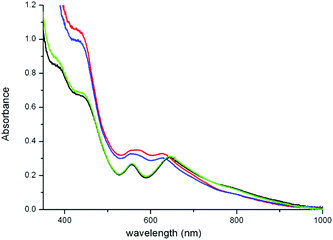 | ||
| Fig. 2 UV/vis absorption spectra of 1 (1 mM) in acetonitrile (black) 30 min after addition of CH2BrCO2H (green line), CCl3CO2H (red), and CF3CO2H (blue), each at 100 mM. | ||
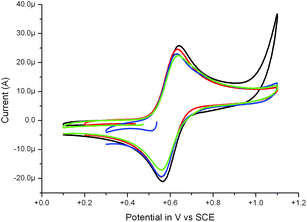
A reversible redox wave was observed for 1 in acetonitrile at E1/2 = 0.64 V (Fig. 3). The chemical, as well as electrochemical, reversibility was confirmed by UV/vis absorption (Fig. 4) and FTIR spectroelectrochemistry (ESI, Fig. S1 and S2†), which showed formation of 2 (i.e. the spectrum obtained, Fig. 4 (red), matched that of the independently prepared complex 2 in acetonitrile) and complete recovery of the spectrum of 1 upon reduction.
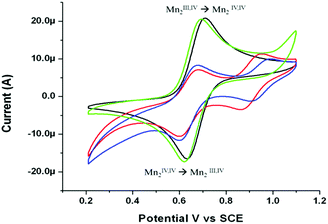 | ||
| Fig. 3 Cyclic voltammogram of 1 (1 mM, black) in acetonitrile (0.1 M TBAPF6), with CH2BrCO2H (green), CCl3CO2H (red) or CF3CO2H (blue) (at 0.1 M), at a GC electrode at 0.1 V s−1. See also Fig S3 in ESI.† | ||
The effect of addition of carboxylic acids on the cyclic voltammetry of 1 was examined to assess the propensity for exchange of the acetato bridging ligand. Addition of CCl3CO2H or CF3CO2H resulted in a decrease in current at E1/2 0.64 V and the appearance of a new redox wave at ca. E1/2 0.9 V, with the more electron withdrawing CF3CO2− moving the redox wave to a more positive potential than CCl3CO2−. Comparison with the cyclic voltammogram of [Mn2III,IV(μ-CF3CO2)(μ-O)2(Me4dtne)](PF6)2 (see ESI, Fig. S3†) confirms this assignment. The increase in redox potential of 270 mV is consistent with the changes previously observed for substitution of the acetato bridging ligands of the analogous Me3tacn based complex 4, where the exchange of two acetato ligands for trichloroacetato ligands resulted in a shift of 420 mV.10
By contrast the addition of other acids, such as CH2BrCO2H, benzoic acid and its derivatives, which would be expected to show a shift of 50 to 100 mV to more positive potentials,10 did not show a significant effect (20 mV) on the cyclic voltammetry of 1, indicating that ligand exchange does not occur in those cases (Fig. 4 and 5), in agreement with UV/vis spectroscopic data (vide supra). The electrochemical data indicate that the influence of the carboxylato ligands on the visible absorption spectrum is negligible and hence that exchange of carboxylato ligands cannot be determined easily by UV/vis absorption spectroscopy (vide supra).
UV resonance Raman spectroscopy of 1 and 2 in acetonitrile
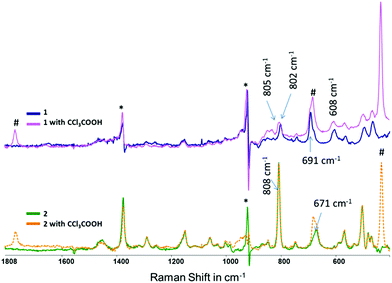
Resonance Raman spectroscopy was employed to characterise the nature of the electronic transitions responsible for the UV and visible absorption bands of both 1 and 2. Excitation at wavelengths longer than 473 nm did not result in resonance enhancement of the Raman modes consistent with the assignment of those absorption bands as metal centred transitions. Excitation at 405 nm and 355 nm, by contrast, provided resonantly enhanced spectra with bands at less than 1000 cm−1 Raman shift showing the most pronounced enhancements.The resonance Raman spectra (λexc 355 nm) of 1 and 2 in CH3CN are shown in Fig. 6. Strongly enhanced bands are observed at 608, 691 and 802 cm−1 for 1. The band at 802 cm−1 is assigned tentatively to Mn–O–Mn vibrational mode, albeit these modes are at 100 cm−1 higher frequency than those observed for complexes such as 3 (701 cm−1).22 The band at ca. 691 cm−1 is assigned tentatively to a vibrational mode centred on the Mn–O–C(R)–O–Mn unit. As for the UV/vis absorption spectrum of 1, addition of 100 eq. of CCl3CO2H had relatively little effect on the Raman spectrum except for the appearance of several bands due to CCl3CO2H, with the band at 682 cm−1 overlapping with bands of 1 and 2 (Fig. 6).
The Raman spectrum of 2 in CH3CN at λexc 355 nm is more intense than that of 1 primarily due to the higher molar absorptivity of 2 at 355 nm (Fig. 6). For 2 a strong band at 808 cm−1 and a broadened band at 671 cm−1 are observed. These bands are comparable with bands observed for 1. However, in contrast to 1, several bands at greater than 1000 cm−1 are observed, which are assigned to the Me4dtne ligand. Hence, the absorption band at 350 nm can be described as LMCT in character with substantial involvement of the Me4dtne ligand. Addition of CCl3CO2H to a solution of 2 in CH3CN did not result in a change to the spectrum except for additional bands due to the acid itself (e.g., at 682 cm−1).
UV/vis absorption spectroscopy and cyclic voltammetry in water
The UV/vis absorption spectrum of 1 in water at pH 6, 8 and 11 is shown in Fig. 7. The two absorption bands in the visible region (at ca. 550 and 630 nm) shift hypsochromically as the pH increases. As 1 has no acidic protons, the changes are therefore indicative of either a change in coordination mode or oxidation state as the pH is increased. The shift between pH 6 and 8 is relatively minor with the absorption at 637 nm shifting by 225 cm−1 to the higher energy, while the shift observed between pH 6 and 11 is ca. 1137 cm−1.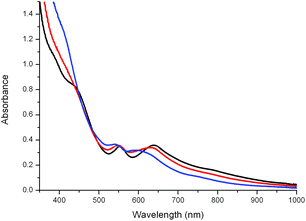 | ||
| Fig. 7 UV/vis absorption spectrum of 1 (1 mM) in water at pH 6.6 (black), 8.2 (red) and 11.1 (blue). The pH was adjusted with NaOH(aq). | ||
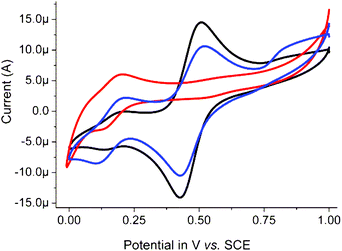
In contrast to that observed in acetonitrile, in water two reversible redox waves are observed at pH 6 and 8 (Fig. 8). The redox wave at 0.49 V is assigned to 1, while the weaker redox wave at ca. 0.16 V is tentatively ascribed to an analogue of 1 in which the acetato ligand is replaced by a carbonate bridge between the two manganese centres (vide infra). At pH 11, the redox wave at 0.49 V is essentially absent and two ill-resolved redox waves are observed at ca. 0.0 and 0.16 V. The former redox wave is assigned to a complex in which the carboxylato bridge of 1 is replaced partially or fully by hydroxido ligands and the latter where a carbonato is bound in place of an acetato ligand (vide infra).
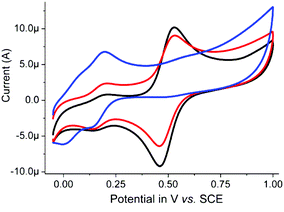 | ||
| Fig. 8 Cyclic voltammetry of 1 (1 mM) in 0.1 M KNO3(aq) at a GC electrode at pH 6 (black), pH 8 (red) and pH 11 (blue). Sweep rate: 100 mV s−1. | ||
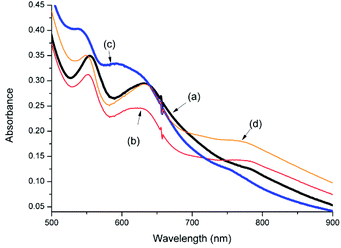
The pH dependent changes in the UV/vis absorption spectra and cyclic voltammetry are not fully reversible. On returning the pH from 11 to 6, the UV/vis absorption spectrum of 1 undergoes a bathochromic shift and is similar but not identical to the initial spectrum (Fig. 9). Similarly, the redox wave at 0.49 V reappears but its intensity relative to the redox wave at 0.16 V is less than initially observed (Fig. 10). The lack of complete reversibility, together with confirmation that oxidation is not occurring by comparison with 2, indicates that the changes are due to ligand exchange (i.e. reversible exchange of the acetato ligand for a carbonato ligand, vide infra).
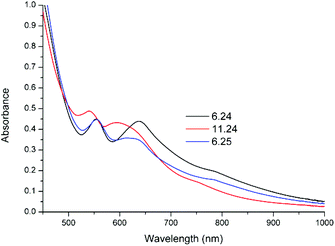 | ||
| Fig. 9 UV/vis absorption spectra of 1 (1 mM) in water at, initially, pH 6.24, then pH 11.24 and finally pH 6.25. The pH was adjusted using NaOH(aq) and H2SO4(aq), respectively. | ||
pH dependence of the EPR spectrum of 1
The effect of changes in pH on the EPR spectrum of 1 and 2 at 77 K was investigated (Fig. 11). EPR spectra were obtained in water–tBuOH (5![[thin space (1/6-em)]](https://www.rsc.org/images/entities/char_2009.gif) :
:![[thin space (1/6-em)]](https://www.rsc.org/images/entities/char_2009.gif) 1 v/v)23 to obtain glasses at 77 K of sufficient quality to allow for measurements. The 16-line EPR spectra of 1 were centred at a g-value of ca. 2 with hyperfine coupling constants (aMn = 70 G at pH 6 and pH 8 and 76 G at pH 11), consistent with spectra reported for 1 earlier (aMn = 75 G).7 The differences in the hyperfine coupling observed for 1 at pH 6 and at pH 11 confirm that a change in coordination mode (either monodentate acetate or complete dissociation) has occurred and are comparable with differences between spectra reported for the one electron oxidised form of complex 4 (i.e. in the Mn2III,IV oxidation state, aMn = 76 G) and the one electron reduced form of 3 (i.e. in the Mn2III,IV oxidation state, aMn = 69 G).22 Notably, cycling the pH between pH 6.2, 11.2 and 6.2 was accompanied by a change in the hyperfine coupling from 70 to 76 G and then back to 70 G, respectively.
1 v/v)23 to obtain glasses at 77 K of sufficient quality to allow for measurements. The 16-line EPR spectra of 1 were centred at a g-value of ca. 2 with hyperfine coupling constants (aMn = 70 G at pH 6 and pH 8 and 76 G at pH 11), consistent with spectra reported for 1 earlier (aMn = 75 G).7 The differences in the hyperfine coupling observed for 1 at pH 6 and at pH 11 confirm that a change in coordination mode (either monodentate acetate or complete dissociation) has occurred and are comparable with differences between spectra reported for the one electron oxidised form of complex 4 (i.e. in the Mn2III,IV oxidation state, aMn = 76 G) and the one electron reduced form of 3 (i.e. in the Mn2III,IV oxidation state, aMn = 69 G).22 Notably, cycling the pH between pH 6.2, 11.2 and 6.2 was accompanied by a change in the hyperfine coupling from 70 to 76 G and then back to 70 G, respectively.
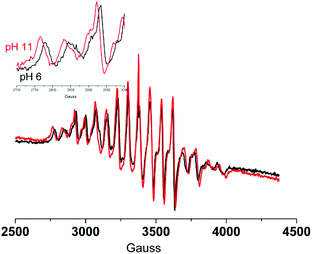 | ||
Fig. 11 EPR spectra of 1 (1 mM) in water–tBuOH (5![[thin space (1/6-em)]](https://www.rsc.org/images/entities/char_2009.gif) : :![[thin space (1/6-em)]](https://www.rsc.org/images/entities/char_2009.gif) 1 v/v) at pH 6 (black) and at pH 11 (red). At a g-value of ca. 2. 1 v/v) at pH 6 (black) and at pH 11 (red). At a g-value of ca. 2. | ||
Effect of bicarbonate on the speciation of complex 1 at pH 6 and pH 11
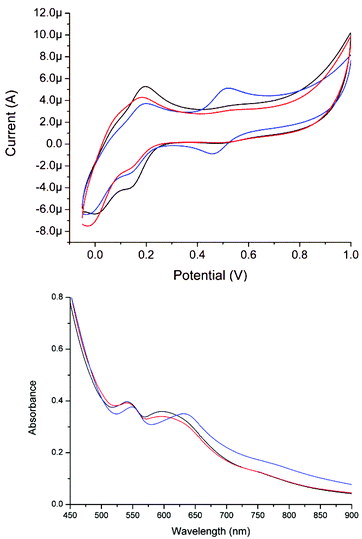
Speciation analysis of complex 1 at concentrations (i.e. 0.1 mM) closer to the concentrations used in the catalytic oxidation of chrysin (i.e. 1 μM, vide infra) by UV/vis absorption spectroscopy showed that the blue shift observed at 1 mM concentration upon an increase in pH from 6 to 11 did not occur. This initially surprising difference is tentatively ascribed to the fact that at a concentration of 0.1 mM of complex 1, the extent of CO2 absorption from the atmosphere provides sufficient carbonate to displace the acetate ligand of 1. This is especially the case at pH 11 where CO2 is absorbed rapidly from the atmosphere (and can cause a decrease in pH concomitant with formation of carbonates).Addition of NaHCO3 (to 0.1 M) to a solution of complex 1 (1 mM) at pH 6 resulted in complete disappearance of the redox wave at 0.49 V and the previously minor redox wave at 0.16 V increases concomitantly (Fig. 12). The effect of addition of carbonate on the UV/vis spectrum of 1 at pH 6 is relatively minor but is consistent with the changes observed after the pH jumps from pH 6 to 11 and back to pH 6 (vide supra).
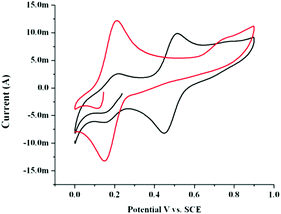 | ||
| Fig. 12 Cyclic voltammetry at a GC electrode (100 mV s−1) of 1 (1 mM) in 0.1 M KNO3(aq) at pH 6.0 before (black) and after (red) addition of NaHCO3 (to 0.1 M). | ||
At pH 11, the effect of addition of carbonate solution (for which the pH had been adjusted to pH 11 with NaOH) on the UV/vis spectrum is more pronounced with the spectrum reverting to that expected for a carboxylato bridged complex (Fig. 13). In addition the redox wave at 0.16 V increases in current density at the expense of the redox wave at 0.05 V (Fig. 14). Similar changes were observed in the Raman spectrum of 1, see ESI† for details.
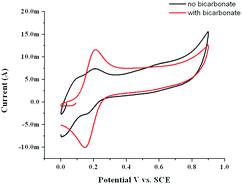 | ||
| Fig. 14 Cyclic voltammetry at a GC electrode (100 mV s−1) of 1 (1 mM) in 0.1 M KNO3(aq) at pH 11.0 before (black) and after (red) addition of NaHCO3 (to 0.1 M). | ||
Effect of carboxylates on the speciation of 1 at pH 6 and pH 11
As with acetonitrile, addition of either CH3COONa or CCl3COONa has only a minor effect (0.1 M at pH 6) on the UV/vis absorption spectrum of 1 (1 mM) in water (data not shown). By contrast, substantial changes to the cyclic voltammetry of 1 were observed. Addition of CH3COONa results in a decrease in the intensity of the minor redox wave at ca. 0.16 V with a concomitant increase in current for the redox wave at ca. 0.49 V (Fig. 15). Addition of CCl3COONa by contrast results in a large decrease in current response at 0.51 V and the appearance of a new redox wave at ca. 0.75 V, consistent with ligand exchange of the acetato ligand with a trichloroacetato ligand.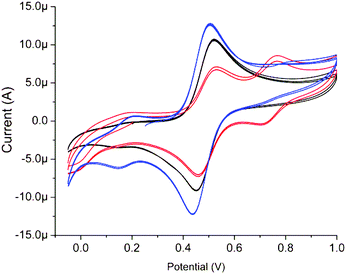 | ||
| Fig. 15 Cyclic voltammogram of 1 (1 mM) in 0.1 M KNO3(aq) at, initially, pH 6.2 (blue), with 0.1 M CH3CO2Na (black) and with 0.1 M CCl3CO2Na (red). At a GC electrode vs. SCE, at 100 mV s−1. | ||
At pH 11 (Fig. 16), the UV/vis absorption spectrum and cyclic voltammogram of 1 are largely unperturbed by addition of CCl3COONa. By contrast, addition of CH3COONa (while maintaining pH 11) results in a change in the UV/vis absorption spectrum towards that observed at pH 6 and the reappearance of the redox wave at ca. 0.49 V. These changes indicate partial recovery of the acetato bridged complex 1.
As for the UV/vis absorption spectra, the EPR spectrum of 1 at pH 6 is unaffected by the addition of carboxylate salts except for the appearance of a weak contribution from a 6 line signal indicating the presence of traces of Mn(II) salts (data not shown).
UV resonance Raman of 1 and 2 in water
The resonance Raman spectrum (λexc 355 nm) of 1 (at 0.1 and 1 mM) was recorded in water at pH 6 and 11. At 0.1 mM, the resonance enhanced Raman spectrum of 1 shows bands at 1072, 806 and 682 cm−1 at both pH 6 and pH 11 with only the relative intensities varying. At 1 mM, the spectra of 1 show a higher S/N ratio and additional modes from the Me4dtne ligand are also observed (Fig. 17).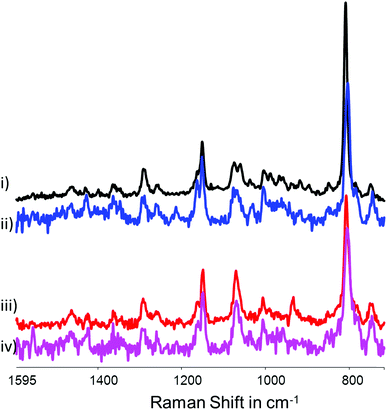 | ||
| Fig. 17 Resonance Raman spectra of (i) 2 and (ii) 1 at pH 6.0 and of (iii) 2 and (iv) 1 at pH 11 (1 mM at λexc 355 nm). Spectra are solvent subtracted and a multipoint baseline was applied. | ||
As expected, there are substantial differences between the spectra of 1 and 2 in water at pH 6. The resonance Raman spectrum of 2 obtained at pH 6 is similar to that obtained in acetonitrile with an intense band at 808 cm−1 and a moderately intense band at 670 cm−1 in addition to modes assignable to the Me4dtne ligand. At pH 11, the spectrum changes with a shift of the 808 and 670 cm−1 bands to 803 and 650 cm−1, respectively. Indeed at pH 11 the spectra of both complexes are essentially identical, in particular with regard to the most intense band at 803 cm−1. This lack of a pH dependence is due to the coordination of carbonate in place of acetate at pH 11 (vide supra, see also ESI†).
pH and carboxylate concentration dependence of the spectroscopy and electrochemistry of 2
Complex 2 was isolated and characterised (vide supra) in the present study to explore its (redox) stability under conditions relevant to oxidation chemistry at high pH.24 At pH 4.5, as expected, at 77 K signals from 2 are not observed by EPR spectroscopy and higher absorption is observed in the UV region compared with 1 (Fig. 18). Increasing the pH to 6 and 11 resulted in the appearance of the characteristic 16-line signal of a Mn2III,IV complex in each case indicating facile reduction of 2 under these conditions. The EPR spectrum changes with the increase in pH to resemble closely that of 1 (aMn = 70 G). Subsequent lowering of the pH to 5.5 did not lead to a reversal of the changes observed, consistent with reduction of 2 to 1.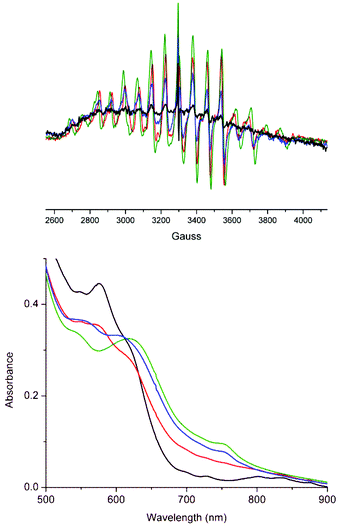 | ||
| Fig. 18 EPR and UV/vis absorption spectra of 2 in water at (initially) pH (black) 4.5, (red) 6.0, (green) 11.0 and finally (blue) 5.5. At a g-value of ca. 2. | ||
The cyclic voltammetry of 2 in water at pH 6.25 was similar to that of 1, as expected, albeit with the open circuit potential at potential 0.57 V (Fig. 19). At pH 11, the voltammetry changes to that observed for 1 at pH 11 and upon returning to pH 6.20 the redox wave at 0.47 V recovered partially and an additional redox wave was observed at ca. 0.16 V. In addition, the open circuit potential was less positive than 0.47 V, confirming a change in the redox state from Mn2(IV,IV) to Mn2(III,IV).
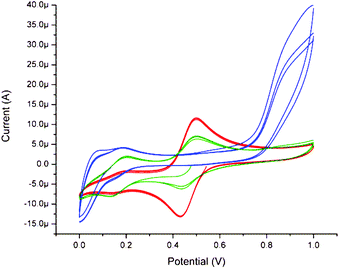 | ||
| Fig. 19 Cyclic voltammetry of 2 (1 mM) in 0.1 M KNO3(aq) at pH 6.25 (red), 11.4 (blue) and subsequently pH 6.20 (green). At a GC electrode vs. SCE, at 100 mV s−1. | ||
Oxidation of chrysin with H2O2 catalysed by 1
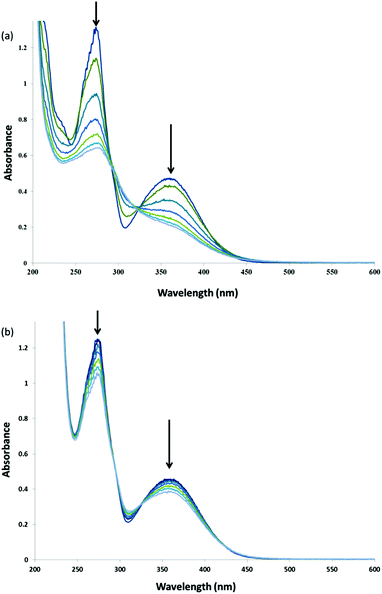
Complex 1 has shown remarkable stability and activity in the bleaching of substrates with H2O2 at high pH (pH > 11) and with substantial reduction in the temperatures required.17 In the present study the flavone chrysin was employed as a model for the dyes present in raw cotton. This flavone was selected because it is much less readily oxidised in comparison with its structural analogues and shows minimal pH dependence on its absorption spectrum (and hence on its protonation state) between pH 8 and 11, allowing for a comparison of the activity of 1 in catalysing its oxidation across this pH range.The rate of bleaching of aqueous solutions of chrysin by H2O2 catalysed by 1 shows a pronounced dependence on pH between pH 9 and 11 with rapid oxidation observed at pH 11 compared with that observed at lower pH (Fig. 20). In the absence of 1, the rate of oxidation is negligible over the time scale examined. Notably, at pH 11 in the presence of 0.5 M sodium acetate the rate of oxidation is reduced dramatically (Fig. 21), although over long time periods the same overall conversion is observed.
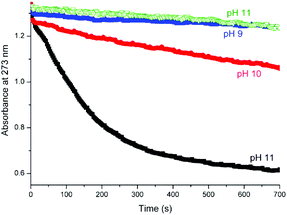 | ||
| Fig. 20 Oxidation of chrysin (40 μM) with H2O2 (400 μM) in the presence of 1 (1 μM) at pH 9 (blue), 10 (red) and at pH 11 (black) and at pH 11 without 1 (green). | ||
The effect of addition of bicarbonate on the rate of oxidation of chrysin is similar to that of addition of acetate at pH 11, with the rate of oxidation reduced substantially (see ESI, Fig. S6†)
Discussion
Although only minor changes to the UV/vis absorption spectroscopy of 1 in CH3CN are observed upon addition of carboxylic acids, cyclic voltammetry reveals that for certain carboxylic acids, ligand exchange of the μ-acetato ligand occurs followed by the partial loss of the carboxylato bridge from the complex over time. In water similar changes are observed, in particular at pH > 10, with the dominant change being the reversible dissociation of the μ-acetato ligand. This assignment is supported by the effect of acetate at high pH where partial recovery of the original spectral features and redox wave of 1 was observed upon addition of acetate (0.1 M). It is also important to note that carbonate can coordinate in a similar fashion as acetate and addition of carbonate at both low and high pH results in formation of carbonate bridged analogues of complex 1. The thermodynamic stability of the μ-oxido bridge in the Mn2III,IV oxidation state is not unexpected and is consistent with observations by Cooper et al., who noted that μ-O exchange occurred only at elevated temperatures for [(bpy)4Mn2III/IV(μ-O)2](ClO4)3 (bpy = 2,2′-bipyridine) and [(phen)4Mn2III/IV(μ-O)2](ClO4)3 (phen = 1,10-phenanthroline) in aqueous solution.25 This stability is in contrast to 4 (Fig. 1), which undergoes rapid exchange of the μ-oxido oxygen at room temperature.10Importantly with respect to catalysis, the Mn2III,IV oxidation state is thermodynamically most stable at neutral pH and higher and hence species such as 2 can be excluded as resting states in any proposed catalytic cycle.
The ability of 1 to catalyse the oxidation of substrates with H2O2 depends on the availability of exchangeable coordination sites on the complex. In the case of complexes such as 4, the opening of the μ-oxido bridge provides for this.10 The increase in activity of 1 when the pH is raised above pH 10, together with the spectral changes observed over this pH range, suggests that a change in coordination mode is required for 1 to act as a catalyst in the oxidation of substrates with H2O2. The data indicate that at higher pH values (i.e. above pH 10) the acetate ligand dissociates partly and/or wholly providing complex 5 and/or 6, respectively (Fig. 22). The lack of sensitivity of the redox waves at ca. 0.00 V and 0.16 V to addition of CCl3CO2H supports the conclusion that complete dissociation has occurred. Addition of acetate drives the equilibrium towards the initial structure 1, thereby blocking vacant coordination sites for 1 to react with H2O2. The effect of acetate, and indeed carbonate, on the catalytic activity of 1 correlates with its effect on the UV/vis absorption spectra and cyclic voltammetry.
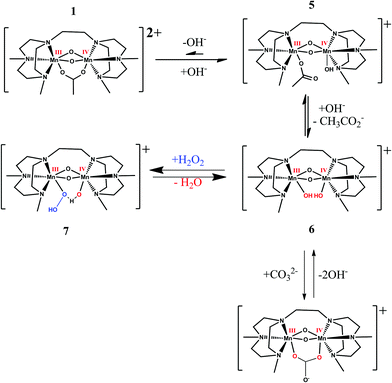 | ||
| Fig. 22 Equilibrium between 1 and the acetate dissociated forms (5 and 6) present at high pH and possible structure of hydroperoxy intermediate (7) formed at high pH. | ||
Conclusions
The effect of acetate and carbonate on the activity of the complex may also provide insight into the effect of sequestrants on the activity of 1, in particular DTPA, which bears multiple carboxylate groups. These data indicate that optimisation of the concentrations of such additives should take into consideration both the suppression of disproportionation of H2O2 by free metal ions (through sequestration by, e.g., DTPA) and the opposing reduction in the catalytic activity of 1. This conclusion also highlights the complexity faced in designing catalyst systems for bulk applications where multiple goals (e.g., bleaching, delignification etc.) are to be achieved in a single processing step that involves multiple reactive species.From a mechanistic perspective, the data presented here highlight the fact that, although catalysts such as 1, 3 and 4 are structurally analogous, a priori mechanistic understanding gained with one system, i.e. the critical role played by carboxylates in controlling selectivity by acting as ligands in the case of 3/4, cannot be extrapolated to related systems, i.e.1, where the loss of the carboxylato ligand is key to achieving activity.
Experimental section
Materials
Commercially available chemicals were used without further purification unless stated otherwise. Solvents for electrochemical and spectroscopic measurements were of UVASOL (Merck) grade or better. H2O2 was 50% w/w in water. [MnIII,IV2(μ-CH3COO)(μ-O)2(Me4dtne)](Cl)2 and [MnIII,IV2(μ-CH3COO)(μ-O)2(Me4dtne)](PF6)2 were received as a gift from Catexel BV.26 ESI-MS m/z 270.7 [MnIII,IV2(μ-CH3COO)(μ-O)2(Me4dtne)]2+, 686.2 [MnIII,IV2(μ-CH3COO)(μ-O)2(Me4dtne) + (PF6)]+. Elemental analysis (calc. for Mn2C20H43N6O4P2F12): C 28.89% (28.89%), H 5.26% (5.21%), N 10.11% (10.11%).6,7 Complex [MnIII,IV2(μ-CF3CO2)(μ-O)2(Me4dtne)](PF6)2 was prepared according to the general procedure described elsewhere,26 elemental analysis (calc. for Mn2C20H40N6O4P2F15): C 27.25% (27.13%), H 4.60% (4.55%), N 9.58% (9.49%), ESI-MS m/z 297.8 [MnIII,IV2(μ-CF3CO2)(μ-O)2(Me4dtne)]2+, 740.3 {[MnIII,IV2(μ-CF3CO2)(μ-O)2(Me4dtne)](PF6)}1+.Instrumentation
UV/vis absorption spectra were recorded with a HP8453 spectrophotometer or a Specord600 (AnalytikJena) in 1 cm pathlength quartz cuvettes. Electrochemical measurements were carried out using a model CHI760B Electrochemical Workstation (CH Instruments). Analyte concentrations were typically 1 mM. The pH was controlled by addition of aqueous NaOH or H2SO4. CV were reported in water containing 0.1 M potassium nitrate and, unless stated otherwise, a 3 mm-diameter Teflon-shrouded glassy carbon working electrode (CH Instruments), a Pt wire auxiliary electrode, and an SCE reference electrode were employed. Cyclic voltammograms were obtained at a sweep rate of 100 mV s−1 unless stated otherwise. All potential values are quoted with respect to SCE. Redox potentials are ±10 mV (Epa, anodic peak potential; Epc, cathodic peak potential; E1/2 = (Epa + Epc)/2). Spectroelectrochemistry was carried out using an OTTLE cell27 (a liquid IR cell modified with Infrasil windows, a platinum mesh working and counter electrode and a Ag/AgCl reference electrode, University of Reading) mounted in a Specord600 UV/vis spectrometer with the potential controlled by a CHI760C potentiostat. The Ag/AgCl reference electrode of the OTTLE cell was prepared by anodisation at 9 V with a platinum wire cathode in 3 M KCl(aq). FTIR spectra were recorded on a Perkin Elmer spectrum 400 equipped with a liquid nitrogen cooled MCT detector.ESI-MS spectra recorded on a Triple Quadrupole LC/MS/MS mass spectrometer (API 3000, Perkin-Elmer Sciex Instruments). Mass spectra in tBuOH–H2O solvent mixtures were recorded in positive mode and in the range m/z 100–900. Samples were prepared using doubly distilled water and the pH was adjusted using aqueous H2SO4 and NaOH solutions.
EPR spectra (X-band, 9.46 GHz) were recorded on a Bruker ECS106 spectrometer in liquid nitrogen (77 K). Samples for measurement (0.25 mL) were transferred to EPR tubes, which were frozen immediately in liquid nitrogen.
Raman spectra were recorded at λexc 355 nm (8 mW at sample, Cobolt Lasers) in a 135° backscattering arrangement. Raman scattering was collected and collimated by a 2.5 cm diameter 7.5 mm focal length plano convex lens and filtered by a 355 nm edge filter (Semrock) before refocusing into the spectrograph (Shamrock500i spectrograph, Andor Technology with a 1800 L mm−1 grating blazed at 300 nm) using a 2.5 cm diameter 17.5 cm focal length plano convex lens and acquired with a DV420A-BU2 CCD camera (Andor Technology). The spectrometer slit width was set to 11 μm. Each spectrum was accumulated, typically 60 or 120 times with 5 s acquisition time, resulting in a total acquisition time of between 5 and 10 min per spectrum. Data were recorded and processed using Solis (Andor Technology) with spectral calibration performed using the Raman spectrum of acetonitrile–toluene 50![[thin space (1/6-em)]](https://www.rsc.org/images/entities/char_2009.gif) :
:![[thin space (1/6-em)]](https://www.rsc.org/images/entities/char_2009.gif) 50 (v
50 (v![[thin space (1/6-em)]](https://www.rsc.org/images/entities/char_2009.gif) :
:![[thin space (1/6-em)]](https://www.rsc.org/images/entities/char_2009.gif) v). Samples were held in 10 mm pathlength quartz cuvettes. For pH dependent resonance Raman studies, aqueous NaOH solutions were employed to adjust the pH.
v). Samples were held in 10 mm pathlength quartz cuvettes. For pH dependent resonance Raman studies, aqueous NaOH solutions were employed to adjust the pH.
Acknowledgements
Financial support is acknowledged from the Netherlands Fund for Technology and Science STW (11059, SA, NMB, WRB), the European Research Council (ERC consolidator grant 279549, WRB), and the Ministry of Education, Culture and Science (Gravity program 024.001.035, WRB). COST Action CM1003 “Biological oxidation reactions – mechanism and design of new catalyst” is acknowledged for support and discussion.Notes and references
- C. S. Mullins and V. L. Pecoraro, Coord. Chem. Rev., 2008, 252, 416–443 CrossRef CAS PubMed
.
-
(a) K. Wieghardt, U. Bossek, D. Venturm and J. Weiss, Chem. Commun., 1985, 347–349 RSC
; (b) K. Wieghardt, U. Bossek, J. Bonvoisin, P. Beauvillain, J. J. Girerd, B. Nuber, J. Weiss and J. Heinze, Angew. Chem., Int. Ed. Engl., 1986, 25, 1030–1031 CrossRef PubMed
; (c) K. Wieghardt, I. Tolksdorf and W. Herrmann, Inorg. Chem., 1985, 24, 1230–1235 CrossRef CAS
; (d) K. Wieghardt, U. Bossek, L. Zsolnai, G. Huttner, G. Blondin, J. J. Girerd and F. Babonneau, J. Chem. Soc., Chem. Commun., 1987, 651–653 RSC
; (e) K. Wieghardt, E. Schoffman, B. Nuber and J. Weiss, Inorg. Chem., 1986, 25, 4877–4883 CrossRef CAS
; (f) P. Chaudhuri and K. Wieghardt, Prog. Inorg. Chem., 1987, 35, 329–436 CrossRef CAS PubMed
; (g) K. Wieghardt, U. Bossek, B. Nuber, J. Weiss, J. Bonvoisin, M. Corbella, S. E. Vitols and J. J. Girerd, J. Am. Chem. Soc., 1988, 110, 7398–7411 CrossRef CAS
; (h) H. R. Chang, H. Diril, M. J. Nilges, X. Zhang, J. A. Potenza, H. J. Schugar, D. N. Hendrickson and S. S. Isied, J. Am. Chem. Soc., 1988, 110, 625–627 CrossRef CAS
; (i) U. Bossek, T. Weyhermüller, K. Wieghardt, B. Nuber and J. Weiss, J. Am. Chem. Soc., 1990, 112, 6387–6388 CrossRef CAS
; (j) H. Diril, H. R. Chang, M. J. Nilges, X. Zhang, J. A. Potenza, H. J. Schugar, S. S. Isied and D. N. Hendrickson, J. Am. Chem. Soc., 1989, 111, 5102–5114 CrossRef CAS
; (k) U. Bossek, T. Weyhermüller, K. Wieghardt, B. Huber and J. Weiss, J. Am. Chem. Soc., 1990, 112, 6387–6388 CrossRef CAS
; (l) U. Bossek, M. Saher, T. Weyhermüller and K. Wieghardt, J. Chem. Soc., Chem. Commun., 1992, 1780–1782 RSC
; (m) J. H. Koek, S. W. Russell, L. van der Wolf, R. Hage, J. B. Warnaar, A. L. Spek, J. Kerschner and L. J. Delpizzo, J. Chem. Soc., Dalton Trans., 1996, 353–362 RSC
; (n) A. Darovsky, V. Kererashvili, P. Coppens, T. Weyhermüller, H. Hummel and K. Wieghardt, Inorg. Chem., 1996, 35, 6916–6917 CrossRef CAS
; (o) U. Bossek, H. Hummel, T. Weyhermüller, K. Wieghardt, S. Russell, L. van der Wolf and U. Kolb, Angew. Chem., Int. Ed. Engl., 1996, 35, 1552–1554 CrossRef CAS PubMed
; (p) G. D. Fallon, G. A. McLachlan, B. Moubaraki, K. S. Murray, L. O'Brien and L. J. Spiccia, J. Chem. Soc., Dalton Trans., 1997, 2765–2769 RSC
; (q) S. J. Brudenell, L. Spiccia, A. M. Bond, G. D. Fallon, D. C. R. Hockless, G. Lazarev, P. J. Mahon and E. R. T. Tiekink, Inorg. Chem., 2000, 39, 881–892 CrossRef CAS
.
- N. Kitajima, M. Osawa, M. Tanaka and Y. Morooka, J. Am. Chem. Soc., 1991, 113, 8952–8953 CrossRef CAS
.
-
(a) J. Limburg, J. S. Vrettos, H. Chen, J. C. de Paula, R. H. Crabtree and G. W. Brudvig, J. Am. Chem. Soc., 2001, 123, 423–430 CrossRef CAS PubMed
; (b) N. Kitajima, U. P. Singh, H. Amagai, M. Osawa and Y. Morooka, J. Am. Chem. Soc., 1991, 113, 7757–7758 CrossRef CAS
; (c) H. Chen, R. Tagore, G. Olack, J. S. Vrettos, T. C. Weng, J. Penner-Hahn, R. H. Crabtree and G. W. Brudvig, Inorg. Chem., 2007, 46, 34–43 CrossRef CAS PubMed
; (d) R. Ruiz-Garcia, E. Pardo, M. C. Muñoz and J. Cano, Inorg. Chim. Acta, 2007, 360, 221–232 CrossRef CAS PubMed
; (e) P. E. M. Siegbahn and R. H. Crabtree, J. Am. Chem. Soc., 1999, 121, 117–127 CrossRef CAS
.
-
(a) S. R. Cooper, G. C. Dismukes, M. P. Klein and M. Calvin, J. Am. Chem. Soc., 1978, 100, 7248–7252 CrossRef CAS
; (b) M. Stebler, A. Ludi and H. B. Burgi, Inorg. Chem., 1986, 25, 4743–4750 CrossRef CAS
; (c) M. A. Collins, D. J. Hodgson, K. Michelsen and D. T. Towle, J. Chem. Soc., Chem. Commun., 1987, 1659–1660 RSC
; (d) D. K. Towle, C. A. Bostford and D. J. Hodgson, Inorg. Chim. Acta, 1988, 141, 167–168 CrossRef CAS
; (e) M. Suzuki, S. Tokura, M. Suhara and A. Uehara, Chem. Lett., 1988, 477–480 CrossRef CAS
; (f) K. S. Hagen, W. H. Armstrong and H. Hope, Inorg. Chem., 1988, 27, 967–969 CrossRef CAS
; (g) J. E. Sheat, R. S. Czernuszewicz, G. C. Dismukes, A. L. Rheingold, V. Petroules, J. Stubbe, W. H. Armstrong, R. H. Beer and S. J. Lippard, J. Am. Chem. Soc., 1987, 109, 1435–1444 CrossRef
.
- T. Weyhermüller and K. Wieghardt, J. Inorg. Biochem., 1991, 43, 371 CrossRef
.
- K. Schäfer, R. Bittl, W. Zweygart, F. Lendzian, G. Haselhorst, T. Weyhermüller, K. Wieghardt and W. Lubitz, J. Am. Chem. Soc., 1998, 120, 13104–13120 CrossRef
.
- R. Hage, J. E. Iburg, J. Kerschner, J. H. Koek, E. L. M. Lempers, R. J. Martens, U. S. Racherla, S. W. Russell, T. Swarthoff, M. R. P. van Vliet, J. B. Warnaar, L. van der Wolf and B. Krijnen, Nature, 1994, 369, 637–639 CrossRef CAS PubMed
.
- V. B. Romakh, B. Therrien, G. Suess-Fink and G. B. Shul'pin, Inorg. Chem., 2007, 46, 1315–1331 CrossRef CAS PubMed
.
- J. W. de Boer, W. R. Browne, J. Brinksma, P. L. Alsters, R. Hage and B. L. Feringa, Inorg. Chem., 2007, 46, 6353–6372 CrossRef CAS PubMed
.
- J. W. de Boer, J. Brinksma, W. R. Browne, A. Meetsma, P. L. Alsters, R. Hage and B. L. Feringa, J. Am. Chem. Soc., 2005, 127, 7990–7991 CrossRef CAS PubMed
.
- J. W. de Boer, P. L. Alsters, A. Meetsma, R. Hage, W. R. Browne and B. L. Feringa, Dalton Trans., 2008, 44, 6283–6295 RSC
.
- J. W. de Boer, W. R. Browne, S. R. Harutyunyan, L. Bini, T. D. Tiemersma-Wegman, P. L. Alsters, R. Hage and B. L. Feringa, Chem. Commun., 2008, 3747–3749 RSC
.
- C. Zondervan, R. Hage and B. L. Feringa, Chem. Commun., 1997, 419–420 RSC
.
-
(a) A. Berkessel and C. A. Sklorz, Tetrahedron Lett., 1999, 40, 7965–7968 CrossRef CAS
; (b) D. E. De Vos and T. Bein, J. Organomet. Chem., 1996, 520, 195–200 CrossRef CAS
; (c) D. E. De Vos, B. F. Sels, M. Reynaers, Y. V. S. Rao and P. A. Jacobs, Tetrahedron Lett., 1998, 39, 3221–3224 CrossRef CAS
; (d) J. Brinksma, L. Schmieder, G. van Vliet, R. Boaron, R. Hage, D. E. De Vos, P. L. Alsters and B. L. Feringa, Tetrahedron Lett., 2002, 43, 2619–2622 CrossRef CAS
; (e) G. B. Shul'pin, G. Suss-Fink and J. R. Lindsay Smith, Tetrahedron, 1999, 55, 5345–5385 CrossRef CAS
; (f) G. B. Shul'pin, G. Suss-Fink and L. S. Shul'pina, J. Mol. Catal. A: Chem., 2001, 170, 17–34 CrossRef CAS
; (g) J. R. L. Smith, B. C. Gilbert, A. M. I. Payeras, J. Murray, T. R. Lowdon, J. Oakes, R. P. I. Prats and P. H. Walton, J. Mol. Catal. A: Chem., 2006, 251, 114–122 CrossRef PubMed
; (h) P. Saisaha, L. Buettner, M. van der Meer, R. Hage, B. L. Feringa, W. R. Browne and J. W. de Boer, Adv. Synth. Catal., 2013, 355, 2591–2603 CrossRef CAS PubMed
.
- P. Saisaha, J. W. de Boer and W. R. Browne, Chem. Soc. Rev., 2013, 42, 2059–2074 RSC
.
- R. Hage and A. Lienke, Angew. Chem., Int. Ed., 2006, 45, 206–222 CrossRef CAS PubMed
.
-
(a) L. Kuhne, J. Odermatt, R. Pratt and O. Kordsachia, Pulp. Pap. Can., 2001, 102, 26–29 CAS
; (b) L. Kuhne, J. Odermatt and T. Wachter, Holzforschung, 2000, 54, 407–412 CrossRef CAS
; (c) R. Patt, H.-J. Mielisch, J. Odermatt, K. Wieghardt and T. Weyhermuller, Patent US2001/0025695, 2001 Search PubMed
; (d) R. Hage, J. W. de Boer, F. Gaulard and K. Maaijen, Adv. Inorg. Chem., 2013, 65, 85–116 CrossRef
.
-
(a) Y. Cui, P. Puthson, C.-L. Chen, J. S. Gratzl and A. G. Kirkman, Holzforschung, 2000, 54, 413–419 CrossRef CAS
; (b) Y. Cui, C.-L. Chen, J. S. Gratzl and R. Patt, J. Mol. Catal. A: Chem., 1999, 144, 411–417 CrossRef CAS
; (c) C.-L. Chen, E. A. Capanema and H. S. Gracz, J. Agric. Food Chem., 2003, 51, 1932–1941 CrossRef CAS PubMed
.
- G. C. Dismukes, Chem. Rev., 1996, 96, 2909–2926 CrossRef CAS PubMed
; V. K. Yachandra, K. Sauer and M. P. Klein, Chem. Rev., 1996, 96, 2927–2950 CrossRef PubMed
.
-
(a) J. P. McEvoy and G. W. Brudvig, Chem. Rev., 2006, 106, 4455–4483 CrossRef CAS PubMed
; (b) F. A. Armstrong, Philos. Trans. R. Soc., B: Biol. Sci., 2008, 363, 1263–1270 CrossRef CAS PubMed
; (c) G. W. Brudvig, Philos. Trans. R. Soc., B: Biol. Sci., 2008, 363, 1211–1218 CrossRef CAS PubMed
.
- R. Hage, B. Krijnen, J. B. Warnaar, F. Hartl, D. J. Stufkens and T. L. Snoeck, Inorg. Chem., 1995, 20, 4973–4978 CrossRef
.
- The cyclic voltammetry, EPR and UV/vis absorption spectra of 1 and 2 in water at neutral and basic pH were identical in the absence and presence of both tBuOH (20% v/v) and KNO3 (0.1 M).
- It should be noted that ESI-MS studies at pH 6, 8 and 11 were attempted both in water and water–tBuOH mixtures. However, although signals assignable to complexes 5 and 6 (Fig. 22) were observed, the inability to control pH under the conditions of ESI-MS and to limit reduction with the electrospray preclude the drawing of conclusions from the data available. See ESI for additional data and discussion.
- S. R. Cooper and M. Calvin, J. Am. Chem. Soc., 1977, 99, 6623–6630 CrossRef CAS
.
-
R. Hage, J. H. Koek, S. W. Russell, X. Wang, L. van der Wolf, J. Zhang and W. Zhao (Unilever), WO2012/003712, 2012 Search PubMed
.
- M. Krejčík, M. Daněk and F. Hartl, J. Electroanal. Chem. Interfacial Electrochem., 1991, 317, 179–187 CrossRef
.
Footnote |
| † Electronic supplementary information (ESI) available. See DOI: 10.1039/c3dt53174k |
| This journal is © The Royal Society of Chemistry 2014 |

