 Open Access Article
Creative Commons Attribution 3.0 Unported Licence
Novel cobalt zinc oxide Fischer–Tropsch catalysts synthesised using supercritical anti-solvent precipitation
Raimon P.
Marin
ab,
Simon A.
Kondrat
a,
Thomas E.
Davies
a,
David J.
Morgan
a,
Dan I.
Enache
b,
Gary B.
Combes
b,
Stuart H.
Taylor
a,
Jonathan K.
Bartley
a and
Graham J.
Hutchings
*a
aCardiff Catalyst Institute, School of Chemistry, Cardiff University, Park Place, Cardiff, CF10 3AT, UK. E-mail: Hutch@cardiff.ac.uk
bJohnson Matthey Plc., PO Box 1, Belasis Avenue, Billingham, Cleveland, TS23 1LB, UK
First published on 8th April 2014
Abstract
Cobalt zinc oxide catalysts have been prepared by anti-solvent precipitation in supercritical CO2 and investigated for CO hydrogenation. Here we show how the textural and catalytic properties of the catalyst can be tailored by the addition of water to the initial solution of cobalt and zinc acetates in methanol. Characterization of the catalysts by powder X-ray diffraction, infra-red and Raman spectroscopy showed that in the absence of water a high surface area mixed acetate was produced which upon calcination formed wurtzite type Zn1−xCoxO and spinel type ZnxCo3−xO4. The addition of 5 vol.% water resulted in a phase separated Co3O4/ZnO catalyst and enhanced active cobalt surface area as a result of disruption of the solvent/CO2 phase equilibrium during precipitation.
Introduction
The use of supercritical anti-solvent (SAS) precipitation as a method of catalyst synthesis offers a route to novel materials with properties intrinsic to the method of preparation. High diffusion and mass transfer rates possible within supercritical media mean that highly regular nanoparticulate materials can be synthesized with a narrow particle size distribution. Multi-element systems can be produced with an exceptional degree of nanoscale mixing between the relevant elements. In addition, the process offers a nitrate free route to catalyst synthesis through the use of a recycled CO2 anti-solvent waste stream cutting out the need for expensive post treatment of waste.SAS precipitation has been used extensively for the synthesis of explosives, polymers, semiconductor materials1–6 and for membrane modification7 but it is only in the last ten years or so that the technique has been applied to the generation of catalytic materials. Previous studies have investigated the synthesis of single metal oxides for use as catalyst supports6,8 and catalysts9 as well as mixed metal oxides.10,11 We have previously shown that SAS prepared TiO2![[thin space (1/6-em)]](https://www.rsc.org/images/entities/char_2009.gif) 8 and CeO2
8 and CeO2![[thin space (1/6-em)]](https://www.rsc.org/images/entities/char_2009.gif) 12 supports enhance the dispersion of active metals resulting in increased turnover rates.
12 supports enhance the dispersion of active metals resulting in increased turnover rates.
The synthesis of binary metal oxides using this method can be challenging due to the varying precipitation rates and solubilities of the precursor compounds. However, the intimate mixing afforded, in combination with high surface area, mean that the SAS precipitation technique offers a clean, efficient and green method of accessing unique materials with enhanced catalytic activities. The intimate mixing can overcome the kinetic restrictions of metastable phase formation in solid-state reactions allowing access to new polymorphs with unique properties. Residue and solvent free methods of catalyst preparation have been investigated previously employing nanocasting,13 mechanochemical14,15 and nanodispersion16 techniques. Methods such as these seek to overcome the kinetic limitation of forming these metastable compounds by ensuring effective mixing on the nanoscale. Supercritical anti-solvent precipitation is a superb method to obtain well-mixed precursor materials for mixed metal oxide catalysts, overcoming the limit of inter-diffusion over atomic distances. Furthermore, careful control of the precipitation parameters such as solvent composition, temperature, pressure, flow rates and nozzle size allows the product to be tuned towards a specific material with desired properties.
Cobalt zinc oxide has traditionally been used in dyes and pigments,17,18 as gas sensors and adsorbents for Cl2, H2O and H2S,19,20 semiconductors21,22 and as a potential anode material in lithium ion batteries.23 Recently there has been interest in its potential as a catalyst for alcohol oxidation, ethanol reforming and Fischer–Tropsch (FT) synthesis. FT chemistry has been an important field since its inception in 1923 and is undergoing resurgence due to diminishing oil reserves and the development of alternative feedstocks such as biomass and natural gas. Cobalt is used as an FT catalyst because of its resistance to deactivation and efficiency for long chain hydrocarbon synthesis. However, the activity is strongly dependent upon a number of factors including particle size, dispersion, promoters, poisons and metal support interaction effects to name but a few. The most common supports are those based on refractory metal oxides such and TiO2, SiO2, Al2O3![[thin space (1/6-em)]](https://www.rsc.org/images/entities/char_2009.gif) 24 and more recently carbon nanotubes25 and activated carbon.26 The use of ZnO as a support has received little attention in the recent literature, although a number of patents do exist.27 Coville et al. have shown how Zn not only enhances the reducibility of the cobalt but also acts as a sulfur scavenger, increasing activity and selectivity in sulfur rich streams.28–30
24 and more recently carbon nanotubes25 and activated carbon.26 The use of ZnO as a support has received little attention in the recent literature, although a number of patents do exist.27 Coville et al. have shown how Zn not only enhances the reducibility of the cobalt but also acts as a sulfur scavenger, increasing activity and selectivity in sulfur rich streams.28–30
In this work we have synthesized cobalt zinc oxide nanocomposites and shown how phase-separation can be induced by modification of the supercritical phase system with water, resulting in an increase in cobalt surface area relative to the standard co-precipitated material. These materials have then been tested as catalysts for CO hydrogenation.
Experimental
Catalyst precipitation was conducted using purpose built SAS equipment. The high pressure, stainless steel precipitation vessel (Jerguson Gauge 13-R-32) was submerged in a water bath to control the temperature. A coaxial nozzle (CO2 outer nozzle, i.d. 736 μm; solution inner nozzle, i.d. 250 μm) was used to deliver the CO2 and solution to the precipitation vessel. CO2 was introduced using an air-driven pump (Haskel MS-71) and the solution delivered using an HPLC pump (Agilent Technologies Series 1200) to maintain a molar ratio of CO2![[thin space (1/6-em)]](https://www.rsc.org/images/entities/char_2009.gif) :
:![[thin space (1/6-em)]](https://www.rsc.org/images/entities/char_2009.gif) methanol equal to 40
methanol equal to 40![[thin space (1/6-em)]](https://www.rsc.org/images/entities/char_2009.gif) :
:![[thin space (1/6-em)]](https://www.rsc.org/images/entities/char_2009.gif) 1 at 120 bar and 40 °C. Three solutions were prepared with 7 mg ml−1 (2.8 × 10⁻⁵ mol ml−1) of Co(CH3COO)2·4H2O and 35 mg ml−1 (1.6 × 10⁻⁴ mol ml−1) of Zn(CH3COO)2·2H2O in 0, 5 and 15 vol.% H2O/methanol. The CO2 and solution were pumped concurrently for a period of 1.5 h, after which CO2 alone was pumped for 0.5 h to remove any residual solvent. The resultant precursors prepared with differing amounts of H2O, 0, 5 and 15 vol.% were designated SAS-0-P, SAS-5-P and SAS-15-P respectively and calcined at 350 °C and 500 °C prior to catalyst testing. These materials were designated SAS-0-350, SAS-5-350, SAS-15-350 or SAS-0-500, SAS-5-500, SAS-15-500 according to the calcination temperature used.
1 at 120 bar and 40 °C. Three solutions were prepared with 7 mg ml−1 (2.8 × 10⁻⁵ mol ml−1) of Co(CH3COO)2·4H2O and 35 mg ml−1 (1.6 × 10⁻⁴ mol ml−1) of Zn(CH3COO)2·2H2O in 0, 5 and 15 vol.% H2O/methanol. The CO2 and solution were pumped concurrently for a period of 1.5 h, after which CO2 alone was pumped for 0.5 h to remove any residual solvent. The resultant precursors prepared with differing amounts of H2O, 0, 5 and 15 vol.% were designated SAS-0-P, SAS-5-P and SAS-15-P respectively and calcined at 350 °C and 500 °C prior to catalyst testing. These materials were designated SAS-0-350, SAS-5-350, SAS-15-350 or SAS-0-500, SAS-5-500, SAS-15-500 according to the calcination temperature used.
The SAS precipitated material was compared with a standard co-precipitated material. The initial nitrate metal solutions (Co(NO3)2·6H2O = 10 g l−1 and Zn(NO3)2·6H2O = 72 g l−1) were pumped by peristaltic pumps at 1000 l h−1 and an aqueous solution of NH4CO3 (NH4CO3 = 154 g l−1) was delivered at the same flow rate. Both solutions were mixed inside a stirred vessel (300 r.p.m.) maintained at pH 5.8 and 60 °C. The resultant material was washed with 1500 ml of deionised water five times and dried overnight at 120 °C followed by a final calcination at 350 °C or 500 °C. These materials were designated CP-P, CP-350 and CP-500, respectively.
X-ray diffraction studies were performed using a Panalytical X'pert Pro instrument using Ni filtered CuKα radiation (40 kV and 40 mA). Scans were carried out over the range 10–120° 2θ. All patterns were matched using the ICDD database (International Centre for Diffraction Data, Pennsylvania, USA). H2 chemisorption experiments were performed using a Micromeretics ASAP 2020. 0.5 g of catalyst was reduced in situ at 425 °C for 6 h under a 200 ml min−1 flow of H2 (BOC 99.99%) with a ramp rate of 3 °C min−1. After reduction the sample was evacuated for 2 h at 450 °C to remove residual H2. The H2 chemisorption experiments were then carried out at 150 °C, 0.1–1 bar. The cobalt content of the materials was determined by atomic absorption spectroscopy (AAS) using a Varian SpectrAA 55B equipped with an air-acetylene flame. FTIR was carried out using a Jasco FT/IR 660 Plus spectrometer in transmission mode over the range 400–4000 cm−1. Samples were diluted with anhydrous KBr and pressed into self-supporting discs prior to analysis. Thermogravimetric analysis (TGA) and differential temperature analysis (DTA) were performed using a Setaram Labsys instrument. 10–30 mg of sample were loaded into an alumina crucible and heated to 550 °C at 20 °C min−1 in air (BOC 99.99%). BET surface areas were measured by nitrogen physisorption using a Micromeritics Gemini 2360. All samples were degassed at 120 °C for 2 h prior to analysis. Temperature programmed reduction (TPR) was performed using a Quantachrome Chembet 3000 equipped with a TCD detector, using a 10% H2/Ar gas mixture at a flow rate of 20 ml min−1. Catalysts were investigated over a temperature range of 50–900 °C with a ramp rate of 5 °C min−1.
Catalyst testing was performed using six parallel fixed bed reactors consisting of 1/4" o.d. stainless steel tubes housed in a brass block within a forced N2 recirculating furnace. A thermocouple was positioned in contact with the wall of the reactor at the level of the catalyst bed and the difference in temperature between the six reactors was 0.8 °C at 210 °C. The catalyst (0.13 g diluted with 0.5 g of SiC) was packed in the reactor and reduced in situ under flowing H2 at 400 °C for 16 h. The reaction was performed at 20 bar, 210–250 °C. The syngas mixture Ar (3.5%) CO (32.17%) H2 (64.33%) was fed at an initial GSVH = 13 l gcat−1 h−1 to equilibrate the catalysts. After 24 hours the gas feed was adjusted to a GHSV value of 4.3 l gcat−1 h−1. The reactors were then held under these conditions for 100 h. The temperature was then increased in 10 °C increments and held at each temperature for 48 h, before increasing the temperature to the next point. After testing at 245 °C, the temperature was reduced to 210 °C to assess the deactivation of the catalyst. Liquid and wax traps were situated post reactor and the contents analysed by off-line gas chromatography, with the gaseous products analysed using on-line gas chromatography.
Results and discussion
Catalyst preparation and characterisation
FT-IR of the precursor materials (Fig. 1) was performed to investigate the effect of water addition on the chemical nature of the cobalt and zinc SAS precipitated salts. The co-precipitated material (CP-P) exhibited bands at ca. 1500, 1390 and 830 cm−1 associated with metal hydroxycarbonates.31,32 SAS preparation without additional water (SAS-0-P) produced a spectra that could be assigned to metal acetates, due to the characteristic symmetric and asymmetric carbonyl bands at 1415 and 1560 cm−1. The addition of water (SAS-5-P, SAS-15-P) resulted in the presence of distinct carbonate bands at 1500 and 830 cm−1. Carbonate formation has been previously observed in SAS prepared CuMnOx systems and is attributed to the reaction of the acetates with carbonic acid which is formed by the diffusion of CO2 into the water containing precursor solution. However, even at 15 vol.% water addition (SAS-15-P), bands associated with acetates could still be observed in the CoZn system, indicating that anion exchange between acetate and carbonate was not complete.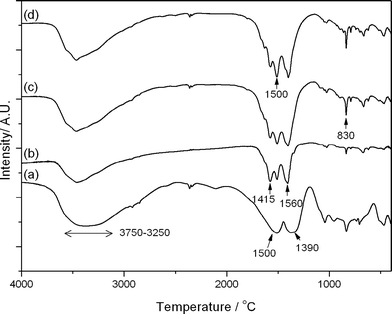 | ||
| Fig. 1 FT-IR analysis of SAS and co-precipitated uncalcined precursors: (a) CP-P; (b) SAS-0-P; (c) SAS-5-P; (d) SAS-15-P. | ||
TGA and DTA, shown in Fig. 2, were performed on the SAS and co-precipitated materials to elucidate suitable calcination temperatures and to give greater insight to the composition of the precursors. The weight loss was observed to occur at <350 °C for all the SAS prepared materials with additional weight loss for the co-precipitated material observed at 350–500 °C. Consequently, the SAS precipitated and co-precipitated materials were all calcined at both 350 and 500 °C, with the lower temperature potentially affording greater retention of the fine structure provided by the SAS process. Two distinct TGA profiles were observed; one type for the SAS prepared materials and another for the co-precipitated material. The co-precipitated material had one principal weight loss centered ca. 280 °C, which was endothermic in nature. The SAS prepared materials showed weight losses <120 °C were attributed to physisorbed water and methanol from the sample preparation and an endothermic weight loss ca. 150–225 °C attributed to the decomposition of hydroxycarbonates.20 The shift of this endothermic peak towards higher temperature with increased water content of the starting solution is attributed to the formation of crystalline species that require more thermal energy to decompose.10 As observed in Fig. 2a the total percentage weight loss attributed to this phase increased with higher amounts of water. The disrupted phase system emerging as a consequence of introducing water as co-solvent could promote crystal growth, hence the formation of crystalline carbonates. The SAS prepared materials also had exothermic weight losses ca. 250–325 °C that can be assigned to the acetate decomposition. This confirms the findings from FT-IR analysis, that acetate anions are still present in all the SAS materials prepared with water as co-solvent. Gradual weight gains observed above 350 °C are due to a partial re-oxidation of the sample. It is known that metal acetates form a reducing atmosphere on thermal decomposition, leading to the reduction of the respective metals.33 This reduction is apparent even in oxygen containing atmospheres, although the metal quickly re-oxidises.
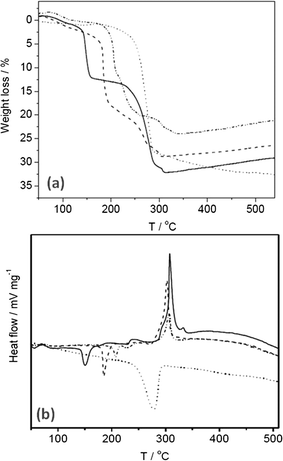 | ||
| Fig. 2 Thermal analysis of the uncalcined cobalt zinc precursors: (a) TGA; (b) DTA. Dotted line CP-P; solid line SAS-0-P; dash line SAS-5-P; dot-dash line SAS-15-P. | ||
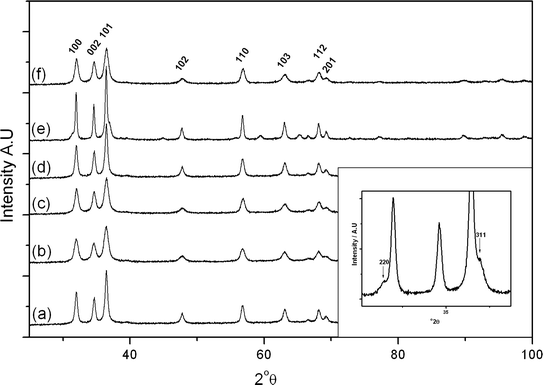
X-ray diffraction patterns of the freshly precipitated and calcined cobalt zinc oxides are shown in Fig. 3 and 4 respectively. The precursor precipitated using the SAS procedure without additional water (SAS-0-P) was amorphous, while the addition of water resulted in the formation of crystalline materials. The degree of crystallinity was found to increase as the water concentration in the preparation was increased, as previously noted in SAS prepared CuMn2O4.10 Calcination of the catalyst at 350 °C resulted in the formation of zinc oxide wurtzite (ZnO, ICDD 01-070-2551) and the expected cobalt product, a cubic spinel compound of ZnCo2O4 or Co3O4, was not observed. The lack of observable Co3O4 phases could be also explained by the formation of a metastable cobalt substituted ZnO of the type Zn1−xCoxO which has previously been synthesized from intimately mixed metal oxalates.34 However, determination of Co incorporation as a result of induced lattice strain in ZnO is difficult due to the similar ionic radii of divalent Co (0.58 Å) and divalent Zn (0.60 Å) in tetrahedral coordination.
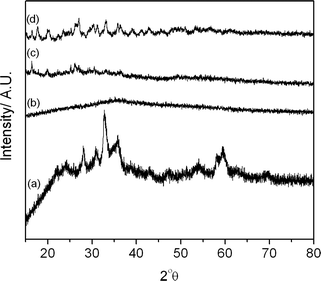 | ||
| Fig. 3 X-ray diffraction patterns of the uncalcined cobalt zinc precursors: (a) CP-P; (b) SAS-0-P; (c) SAS-5-P; (d) SAS-15-P. | ||
Calcination at 500 °C did not form different phases with the exception of SAS-5-500 which showed the presence of a cubic spinel phase. Significant overlap of the reflections makes it difficult to unequivocally assign the pattern to Co3O4 or ZnCo2O4. This is consistent with work conducted by Baird et al. on co-precipitated Co/Zn/O catalysts which found the structure of the bulk to be monophasic ZnO at low Co concentrations with ZnCo2O4 prominent at the surface, whereas at higher Co concentrations a biphasic Co3O4 and ZnO system was formed.35
Raman spectra of the calcined samples are shown in Fig. 5 and 6, along with individual metal oxide standards prepared under the same conditions. The ZnO standard (Fig. 5a and 6a) shows the typical Raman modes for space group C46v–E2 (high) at 439 cm−1, A1 (TO) at 382 cm−1, E2 (high)-E2 (low) at 332 cm−1. The Co3O4 standard (Fig. 5b and 6b) displays the theoretical Raman modes for a metal oxide spinel (space group Fd3m (O7h)) (Eg at 484 cm−1, F2g at 523 cm−1, F2g at 622 cm−1 and A1g at 693 cm−1).36 In contrast to the XRD analysis the calcined materials prepared using the SAS process show only weak peaks from the ZnO component (E2 (high) at 439 cm−1) with the main vibrations attributed to the strongly scattering spinel phase. This demonstrates that Co3O4 or ZnxCo3−xO4 is present in all samples, in a poorly crystalline state that is not observable by XRD. It was noted that the SAS and co-precipitated prepared materials had a significant blue shift in the spinel Raman bands, relative to the Co3O4 standard. This has previously been observed when Zn2+ is incorporated into the Co3O4 lattice.17,37,38 The most significant shift occurs for the A1g mode corresponding to oxygen vibrations in the CoO6 octahedral unit in Co3O4. Recently Rubio-Marcos et al. synthesised ZnCo2O4via a dry mixing method. They reported that temperatures of 500 °C and annealing times of up to 36 h were required to overcome the kinetic restriction of Zn diffusion through the lattice.16 In this study, ZnxCo3−xO4 was formed in all samples at temperatures as low as 350 °C after just 2 h calcination. However, weak peaks at ca. 689 cm−1 from residual Co3O4 are still visible, indicating incomplete formation of the mixed phase in CP-350 and SAS preparations with additional water. However, the lack of this band in SAS-0-350 indicates the intimate mixing of Co and Zn afforded by the SAS process aids the formation of the mixed metal oxide at much lower temperatures than traditional synthesis methods. The presence of phase separated single metal oxides when water was added is due to a change in the phase system for the SAS process. Water addition limits the miscibility of CO2 and methanol resulting in surface tension of the precursor solution droplet in the system. Consequently there will be a significant diffusion gradient as the CO2 diffuses into the precursor solution. As the cobalt and zinc salts have differing solubilities in a CO2-solvent mixture, this diffusion gradient results in different nucleation rates of the respective salts and therefore a phase segregated material.
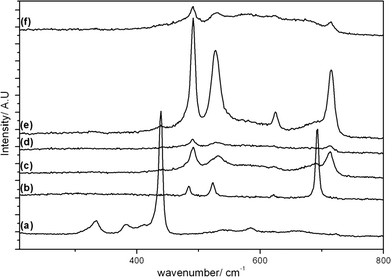 | ||
| Fig. 5 Raman spectra of the cobalt zinc oxide catalysts calcined at 350 °C: a) ZnO; b) Co3O4; c) CP-350; d) SAS-0-350; e) SAS-5-350; f) SAS-15-350. | ||
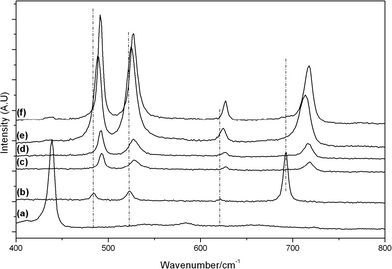 | ||
| Fig. 6 Raman spectra of the cobalt zinc oxide catalysts calcined at 500 °C: a) ZnO; b) Co3O4; c) CP-500; d) SAS-0-500; e) SAS-5-500; f) SAS-15-500. | ||
Calcination of the materials at 500 °C resulted in almost complete formation of ZnxCo3−xO4, with minimal Co3O4 observed by Raman spectroscopy. Although a blue shift of the Raman bands was observed for the spinel phase in all samples, the extent of the shift was markedly less in the SAS-5-500. This demonstrates that the addition of 5 vol% water has a greater degree of Co and Zn phase separation, as confirmed by the observable spinel phase in XRD analysis.
The surface areas of the precursors and the calcined catalysts are presented in Table 1. Addition of 5 vol.% water to the methanol solution increased the surface area of the precursor from 28 to 100 m2 g−1 but this decreased to 37 m2 g−1 at higher water concentration. It has previously been noted that high water concentrations (>10 vol.%) tend to result in a disruption of the CO2-solvent phase equilibrium due to the poor miscibility between CO2 and H2O.39 This results in lower product yields, a broad particle size distribution, reduced surface area and particle agglomeration through wetting.
![[thin space (1/6-em)]](https://www.rsc.org/images/entities/char_2009.gif) :
:![[thin space (1/6-em)]](https://www.rsc.org/images/entities/char_2009.gif) Zn ratios for uncalcined and calcined catalysts
Zn ratios for uncalcined and calcined catalysts
| Catalyst | Co loadinga (wt.%) | BET surface areab (m2 g−1) | Co surface areac | ||
|---|---|---|---|---|---|
| Precursor | Calcined 350 °C | (m2 g−1) | (m2 gCo−1) | ||
| a Determined by atomic absorption spectroscopy. b Determined by N2 physisorption at 77 K. c Determined by H2 chemisorption. | |||||
| SAS-0-350 | 18.5 | 28 | 44 | 3.7 (± 0.4) | 21.2 (±2.9) |
| SAS-0-500 | 17 | 1.7 (±0.2) | 9.7 (±1.4) | ||
| SAS-5-350 | 17.1 | 101 | 46 | 5.6 (±0.6) | 32.8 (±4.6) |
| SAS-5-500 | 18 | 2.5 (±0.3) | 14.6 (±2.0) | ||
| SAS-15-350 | 14.5 | 37 | 47 | 5.6 (±0.6) | 38.5 (±5.4) |
| SAS-15-500 | 18 | 1.7 (±0.2) | 11.7 (±1.6) | ||
| CP-350 | 10.4 | 17 | 17 | 1.3 (±0.1) | 12.5 (±1.8) |
| CP-500 | 19 | 1.5 (±0.2) | 14.4 (±2.0) | ||
Calcination of the SAS precursors at 350 °C resulted in surface areas of ca. 45 m2 g−1 for all catalysts, whereas higher temperature calcination at 500 °C lowered the surface area to ca. 18 m2 g−1 which are comparable to the co-precipitated sample surface area. Previous studies by Baird et al. found the same total surface area values for low cobalt loaded samples (<20 at.%).20 Previous catalyst preparations using SAS precipitation found that the addition of water during the synthesis prevented the decrease in surface area on calcination.10 This was attributed to the formation of carbonic acid in the precipitation vessel, yielding metal carbonate products that decompose endothermically helping to maintain the surface area of the precursor. This effect was not observed in the current work, which is probably due to the significant presence of acetate in all samples, as observed by IR spectroscopy.
Cobalt content of the catalysts was determined by AAS (Table 1), with all SAS samples having loadings between 14.5 and 18.5 wt.% Co, while the co-precipitated material had a lower loading of 10.4 wt.%. This lower loading in the co-precipitated sample could be due to the hygroscopic nature of cobalt nitrate, resulting in a slightly reduced Co concentration than targeted. The cobalt metal surface areas were determined using H2 chemisorption and are presented in Table 1. The catalysts prepared using SAS precipitation and calcined at 350 °C all display higher active metal surface areas when compared to the standard co-precipitated material. The addition of water resulted in an area increase from 3.7 (±0.4) to 5.6 (±0.6) m2 g−1 which is over four times higher than the cobalt surface area of the co-precipitated material. The trend of SAS prepared catalysts having higher cobalt surface area was still retained when the data was normalized to Co mass. Calcination at 500 °C had the expected effect of lowering the active metal surface area through a combination of particle sintering and migration of Co into the ZnO bulk, forming a solid solution. These findings are consistent with the Raman and XRD data that showed an enhanced phase separation with 5 vol.% water addition.
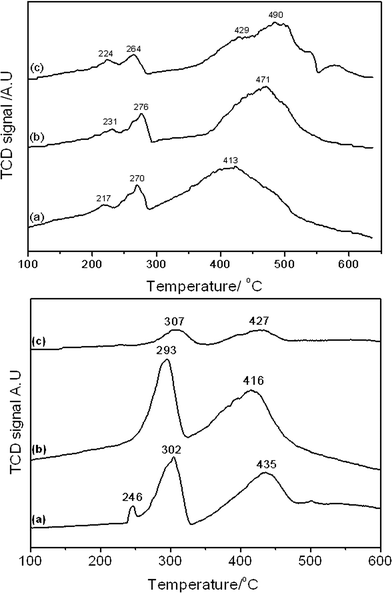
Reducibility of the samples was determined by temperature programmed reduction and the results shown in Fig. 7 and Table 3. The reduction profile of all catalysts was indicative of the two stage reduction of Co3O4 to CoO (260–310 °C) and CoO to Co (400–500 °C).40 The lower temperature reduction at ca. 220–250 °C, observed in all catalysts calcined at 350 °C and SAS-0-500, could be attributable to decomposition of residual cobalt(II) acetate or carbonate species or reduction of a CoOOH species.41 The presence of significant amounts of residual cobalt(II) salts are not apparent from the TGA data (Fig. 2), which shows no mass loss above 325 °C, though small amounts of surface stabilised cobalt(II) species may remain.
| Catalyst | CO conversion (10−6 mol s−1) | C5+ selectivity (%) | ||||
|---|---|---|---|---|---|---|
| 225 °C | 235 °C | 245 °C | 225 °C | 235 °C | 245 °C | |
| SAS-0-350 | 0.01 | 0.57 | 1.46 | — | 61 | 69 |
| SAS-5-350 | 0.51 | 1.70 | 1.66 | 62 | 76 | 54 |
| SAS-15-350 | 0.13 | 0.68 | 1.31 | 70 | 74 | 63 |
| CP-350 | 0 | 0.38 | 1.54 | — | 70 | 74 |
| SAS-0-500 | 0.06 | 0.32 | 1.02 | 78 | 0 | 45 |
| SAS-5-500 | 0.28 | 0.59 | 1.30 | 15 | 34 | 47 |
| SAS-15-500 | 0 | 0 | 0 | — | — | — |
| CP-500 | 0.46 | 0.90 | 1.16 | 0 | 0 | 34 |
| Sample | Co3+ reduction to Co2+ | Co2+ reduction to Co | Reduction peak ratioa (Co3+ → Co2+)![[thin space (1/6-em)]](https://www.rsc.org/images/entities/char_2009.gif) : :![[thin space (1/6-em)]](https://www.rsc.org/images/entities/char_2009.gif) (Co2+ → Co) (Co2+ → Co) |
|---|---|---|---|
| Temperature (°C) | Temperature (°C) | ||
a Theoretical value for pure Co3O4 is 1![[thin space (1/6-em)]](https://www.rsc.org/images/entities/char_2009.gif) : :![[thin space (1/6-em)]](https://www.rsc.org/images/entities/char_2009.gif) 3. 3.
|
|||
| SAS-0-350 | 224 and 264 | 413 | 1![[thin space (1/6-em)]](https://www.rsc.org/images/entities/char_2009.gif) : :![[thin space (1/6-em)]](https://www.rsc.org/images/entities/char_2009.gif) 3.3 3.3 |
| SAS-0-500 | 231 and 276 | 471 | 1.1![[thin space (1/6-em)]](https://www.rsc.org/images/entities/char_2009.gif) : :![[thin space (1/6-em)]](https://www.rsc.org/images/entities/char_2009.gif) 1 1 |
| SAS-5-350 | 217 and 270 | 429 and 490 | 1![[thin space (1/6-em)]](https://www.rsc.org/images/entities/char_2009.gif) : :![[thin space (1/6-em)]](https://www.rsc.org/images/entities/char_2009.gif) 5 5 |
| SAS-5-500 | 246 and 302 | 435 | 1![[thin space (1/6-em)]](https://www.rsc.org/images/entities/char_2009.gif) : :![[thin space (1/6-em)]](https://www.rsc.org/images/entities/char_2009.gif) 1.5 1.5 |
| SAS-15-350 | 293 | 416 | 1![[thin space (1/6-em)]](https://www.rsc.org/images/entities/char_2009.gif) : :![[thin space (1/6-em)]](https://www.rsc.org/images/entities/char_2009.gif) 5 5 |
| SAS-15-050 | 307 | 427 | 1![[thin space (1/6-em)]](https://www.rsc.org/images/entities/char_2009.gif) : :![[thin space (1/6-em)]](https://www.rsc.org/images/entities/char_2009.gif) 1.1 1.1 |
A clear difference in the reduction profile of the catalysts calcined at the different temperatures is observed. Theoretically pure Co3O4 would reduce to Co according to the two-step reaction shown in eqn (1) and (2).
| Co3O4 + H2 → 3 CoO + H2O | (1) |
| 3 CoO + 3 H2 → 3 Co + 3 H2O | (2) |
This results in hydrogen consumption and water production at a ratio of 1![[thin space (1/6-em)]](https://www.rsc.org/images/entities/char_2009.gif) :
:![[thin space (1/6-em)]](https://www.rsc.org/images/entities/char_2009.gif) 3 for the respective Co3+ and Co2+ reduction steps. The catalysts calcined at 350 °C were found to have ratios of the low temperature (Co3+) and high temperature (Co2+) reduction peaks (Co3O4 reduction and the reduction peak at ca. 220–250 °C have been combined) of ca. 1
3 for the respective Co3+ and Co2+ reduction steps. The catalysts calcined at 350 °C were found to have ratios of the low temperature (Co3+) and high temperature (Co2+) reduction peaks (Co3O4 reduction and the reduction peak at ca. 220–250 °C have been combined) of ca. 1![[thin space (1/6-em)]](https://www.rsc.org/images/entities/char_2009.gif) :
:![[thin space (1/6-em)]](https://www.rsc.org/images/entities/char_2009.gif) 5. The variance from the theoretical value of 1
5. The variance from the theoretical value of 1![[thin space (1/6-em)]](https://www.rsc.org/images/entities/char_2009.gif) :
:![[thin space (1/6-em)]](https://www.rsc.org/images/entities/char_2009.gif) 3 can be explained by the presence of an excess of Co2+ not in the Co3O4, potentially as CoO. Catalysts calcined at 500 °C had far lower ratios, indicating more oxidised materials containing less Co2+.
3 can be explained by the presence of an excess of Co2+ not in the Co3O4, potentially as CoO. Catalysts calcined at 500 °C had far lower ratios, indicating more oxidised materials containing less Co2+.
As reducibility of cobalt oxides is related to FT activity, since it is metallic Co that is the active phase, the final reduction temperature can give an indication of the potential of the FT catalyst. Given that the in-situ reduction temperature prior to FT testing was 400 °C, the extent of reduction of the catalysts under testing conditions can be estimated. As catalysts were reduced under a more reducing pure H2 atmosphere prior to testing while TPR analysis was performed using 10% H2/Ar, care must be taken in overinterpreting the TPR reduction temperatures. What is clear is that the CoO reduction peak temperature for the 350 °C calcined materials increased, significantly above 400 °C, with the water content in the catalyst preparation. This suggests that SAS-0-350 could have a greater fraction of metallic cobalt and so be more active, though it does have the lowest Co surface area of the 350 °C calcined materials. Catalysts calcined at 500 °C all had similar CoO reduction temperatures at ca. 420 °C.
Catalyst testing
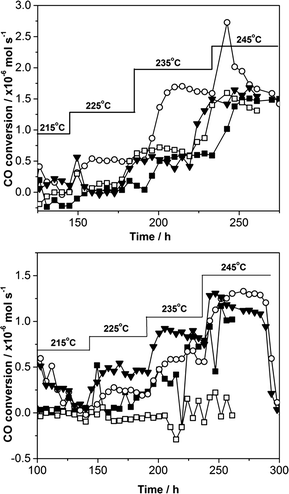
The materials were tested as FT catalysts using a standard procedure developed at Johnson Matthey and the data are presented in Table 2 and Fig. 8. As small amounts of catalyst were tested conversions were relatively low, however a standard co-precipitated catalyst was also tested to benchmark the SAS precipitated materials performance. At low conversion the conversion appears to be 0% ± 0.25. These should be considered to show zero conversion and the deviation from zero is due small fluctuations in the peak areas used to calculate conversion that gives an indication of the error in the testing results.It should be noted that no previous work has been reported in the literature for zinc oxide supported cobalt FT catalysts, as described here. Therefore, the observable formation of desired C5+ products demonstrates the potential of cobalt zinc oxide systems for FT synthesis without the presence of traditional support materials, such as Al2O3, TiO2, SiO2 and activated carbon.
It is clear from the results that both calcination temperature and the amount of water co-solvent are crucial to the performance of the SAS precipitated materials. The optimum calcination was found to be 350 °C with 5 vol.% water addition giving the most active catalysts. Calcination at 500 °C resulted in a decrease in the SAS prepared catalysts activity and in some cases loss of stability. This loss of activity on higher temperature calcination corresponds to the generally observed decrease in cobalt surface area on 500 °C calcination. The performance of the SAS precipitated materials compared favourably with the standard co-precipitated catalysts – particularly at low temperature. At higher temperature (245 °C) deactivation occurred, which was much faster for the catalysts calcined at high temperature and can be attributed to the reduction in both the bulk and cobalt surface areas. The minimal change in activity of the co-precipitated catalysts calcined at different temperatures correlated with a minimal change in surface area. Although the cobalt surface area is clearly important, the most active catalyst (SAS-5-350) has a comparable cobalt surface area to the less active SAS-15-350 and so it is not the only key parameter for these catalysts. Previously it has been shown that the hcp/fcc ratio of the Co is important,40 but this could not be determined from the XRD data in this study. It was noted in analysis of TPR data that SAS-5-350 was slightly more reducible than SAS-15-350. Another important factor is the separation between cobalt and zinc phases. Evidence for this can be found in the Raman spectra of the SAS-5-350 catalyst, which shows an observable amount of non-blue shifted, pure Co3O4. Further evidence of this phase separation can be inferred from Raman and XRD analysis of the 500 °C calcined material. The observed phase separation by XRD in SAS-5-500 catalyst would have been present in the lower temperature calcined material, but was made observable due to the sintering of the cobalt oxide.
Conclusions
Cobalt zinc oxide catalysts have been prepared by precipitation using supercritical CO2 as an anti-solvent and characterized by XRD, TPR and FTIR. The SAS precipitated material prepared without additional water was amorphous and comprised a mixture of metal acetates. FTIR indicated that the addition of water to the supercritical phase facilitates the formation of carbonates through the generation of carbonic acid species, though exchange of acetate was not complete. The addition of water to the precursor solution altered the mixture critical point of the system changing the mechanism of precipitation promoting the formation of higher surface area precursors with spherical and needle-like particles morphologies. XRD analysis of the calcined catalyst found that the main phase present was ZnO with the presence of small amounts Co3O4 or a mixed ZnCo2O4 observable by Raman analysis. The degree of phase separation can be modified through altering the water concentration in the initial start solution, with the addition of 5 vol.% water resulted in a greater degree of separation. The water modified SAS precipitation facilitated the enhanced phase separation and high cobalt surface area of the catalysts, afforded by calcinations at 350 °C, which was found to be favourable for the formation of C5+ products in the FT reaction.Acknowledgements
The Cardiff Catalysis Institute would like to thank Johnson Matthey Plc for the catalyst testing and cobalt surface area analysis. Also we would like to thank the UK Technology Strategy Board for funding.References
- D. Andreeva, I. Ivanov, L. Ilieva and M. V. Abrashev, Appl. Catal., A, 2006, 302, 127–132 CrossRef CAS PubMed.
- P. M. Gallagher, M. P. Coffey, V. J. Krukonis and N. Klasutis, ACS Symp. Ser., 1989, 406, 334–354 CrossRef CAS PubMed.
- D. J. Dixon, G. Luna-Bárcenas and K. P. Johnston, Polymer, 1994, 35, 3998–4005 CrossRef CAS.
- A. O'Neil, C. Wilson, J. M. Webster, F. J. Allison, J. A. K. Howard and M. Poliakoff, Angew. Chem., Int. Ed., 2002, 41, 3796–3799 CrossRef CAS.
- C. N. Field, P. A. Hamley, J. M. Webster, D. H. Gregory, J. J. Titman and M. Poliakoff, J. Am. Chem. Soc., 2000, 122, 2480–2488 CrossRef CAS.
- E. Reverchon, G. Della Porta, D. Sannino and P. Ciambelli, Powder Technol., 1999, 102, 127–134 CrossRef CAS.
- Z. Xinli, H. Xiaoling, G. Ping and L. Guozheng, J. Supercrit. Fluids, 2009, 49, 111–116 CrossRef PubMed.
- Z.-R. Tang, J. K. Bartley, S. H. Taylor and G. J. Hutchings, Stud. Surf. Sci. Catal., 2006, 162, 219–226 CrossRef CAS.
- E. Reverchon, G. D. Porta, D. Sannino, L. Lisi and P. Ciambelli, Stud. Surf. Sci. Catal., 1998, 118, 349–358 CrossRef CAS.
- Z. R. Tang, S. A. Kondrat, C. Dickinson, J. K. Bartley, A. F. Carley, S. H. Taylor, T. E. Davies, M. Allix, M. J. Rosseinsky, J. B. Claridge, Z. Xu, S. Romani, M. J. Crudace and G. J. Hutchings, Catal. Sci. Technol., 2011, 1, 740–746 Search PubMed.
- G. J. Hutchings, J. A. Lopez-Sanchez, J. K. Bartley, J. M. Webster, A. Burrows, C. J. Kiely, A. F. Carley, C. Rhodes, M. Hävecker, A. Knop-Gericke, R. W. Mayer, R. Schlögl, J. C. Volta and M. Poliakoff, J. Catal., 2002, 208, 197–210 CrossRef CAS.
- P. J. Miedziak, Z. Tang, T. E. Davies, D. I. Enache, J. K. Bartley, A. F. Carley, A. A. Herzing, C. J. Kiely, S. H. Taylor and G. J. Hutchings, J. Mater. Chem., 2009, 19, 8619–8627 RSC.
- A. H. Lu and F. Schüth, Adv. Mater., 2006, 18, 1793–1805 CrossRef CAS.
- H. Yang, Y. Hu, X. Zhang and G. Qiu, Mater. Lett., 2004, 58, 387–389 CrossRef CAS.
- T. E. Davies, T. Garcia, B. Solsona and S. H. Taylor, Chem. Commun., 2006, 3417–3419 RSC.
- F. Rubio-Marcos, V. Calvino-Casilda, M. A. Bañares and J. F. Fernandez, J. Catal., 2010, 275, 288–293 CrossRef CAS PubMed.
- G. V. Bazuev and O. I. Gyrdasova, Phys. Status Solidi B, 2008, 245, 1184–1190 CrossRef CAS.
- C. Ai, M. Yin, C. Wang and J. Sun, J. Mater. Sci., 2004, 39, 1077–1079 CrossRef CAS.
- X. Niu, W. Du and W. Du, Sens. Actuators, B, 2004, 99, 405–409 CrossRef CAS PubMed.
- T. Baird, K. C. Campbell, P. J. Holliman, R. W. Hoyle, D. Stirling, B. P. Williams and M. Morris, J. Mater. Chem., 1997, 7, 319–330 RSC.
- M. Schumm, M. Koerdel, J. F. Morhange, Z. Golacki, K. Grasza, P. Skupinski, W. Szuszkiewicz, H. Zhou, V. Malik, H. Kalt, C. Klingshirn and J. Geurts, J. Phys.: Conf. Ser., 2007, 92, 012149 CrossRef.
- N. H. Perry, T. O. Mason, C. Ma, A. Navrotsky, Y. Shi, J. S. Bettinger, M. F. Toney, T. R. Paudel, S. Lany and A. Zunger, J. Solid State Chem., 2012, 190, 143–149 CrossRef CAS PubMed.
- W. Y. Li, L. N. Xu and J. Chen, Adv. Funct. Mater., 2005, 15, 851–857 CrossRef CAS.
- E. Iglesia, Appl. Catal., A, 1997, 161, 59–78 CrossRef CAS.
- A. Tavasoli, R. M. M. Abbaslou, M. Trepanier and A. K. Dalai, Appl. Catal., A, 2008, 345, 134–142 CrossRef CAS PubMed.
- W. P. Ma, Y. J. Ding and L. W. Lin, Ind. Eng. Chem. Res., 2004, 43, 2391–2398 CrossRef CAS.
- C. R. Baijense, G. Johnson and A. Moini, Core-shell catalyst, its preparation and use thereof for fischer-tropsch synthesis, WO 2005/116167 A1 2009 Search PubMed.
- N. N. Madikizela and N. J. Coville, J. Mol. Catal. A: Chem., 2002, 181, 129–136 CrossRef CAS.
- N. N. Madikizela-Mnqanqeni and N. J. Coville, Appl. Catal., A, 2004, 272, 339–346 CrossRef CAS PubMed.
- N. N. Madikizela-Mnqanqeni and N. J. Coville, J. Mol. Catal. A: Chem., 2005, 225, 137–142 CrossRef CAS PubMed.
- R. Wahab, S. G. Ansari, Y. S. Kim, M. A. Dar and H.-S. Shin, J. Alloys Compd., 2008, 461, 66–71 CrossRef CAS PubMed.
- Z. Nickolov, G. Georgiev, D. Stoilova and I. Ivanov, J. Mol. Struct., 1995, 354, 119–125 CrossRef CAS.
- S. A. Kondrat, T. E. Davies, Z. Zu, P. Boldrin, J. K. Bartley, A. F. Carley, S. H. Taylor, M. J. Rosseinsky and G. J. Hutchings, J. Catal., 2011, 281, 279–289 CrossRef CAS PubMed.
- A. S. Risbud, N. A. Spaldin, Z. Q. Chen, S. Stemmer and R. Seshadri, Phys. Rev. B: Condens. Matter Mater. Phys., 2003, 68, 205202 CrossRef.
- T. Baird, K. C. Campbell, P. J. Holliman, R. W. Hoyle, M. Huxam, D. Stirling, B. Peter Williams and M. Morris, J. Mater. Chem., 1999, 9, 599–605 RSC.
- V. G. Hadjiev, M. N. Iliev and I. V. Vergilov, J. Phys. C: Solid State Phys., 1988, 21, L199 CrossRef.
- K. Samanta, P. Bhattacharya, R. S. Katiyar, W. Iwamoto, P. G. Pagliuso and C. Rettori, Phys. Rev. B: Condens. Matter Mater. Phys., 2006, 73, 245213 CrossRef.
- N. H. Perry, T. O. Mason, C. Ma, A. Narvrotsky, Y. Shi, J. S. Joanna, M. F. Toney, T. R. Tula, S. Lany and A. Zunger, J. Solid State Chem., 2012, 190, 143 CrossRef CAS PubMed.
- C. Duarte, A. N. A. Aguiar-Ricardo, N. Ribeiro, T. Casimiro and M. N. Da Ponte, Sep. Sci. Technol., 2000, 35, 2187–2201 CrossRef CAS PubMed.
- W. Chu, P. A. Chernavskii, L. Gengembre, G. A. Pankina, P. Fongarland and A. Y. Khodakov, J. Catal., 2007, 252, 215–230 CrossRef CAS PubMed.
- J. van de Loosdrecht, S. Barradas, E. A. Caricato, N. G. Ngwenya, P. S. Nkwanyana, M. A. S. Rawat, B. H. Sigwebela, P. J. van Berge and J. L. Visagie, Top. Catal., 2003, 26, 121–127 CrossRef CAS.
| This journal is © The Royal Society of Chemistry 2014 |

