 Open Access Article
Hydrogen-bond memory and water-skin supersolidity resolving the Mpemba paradox
Xi
Zhang
*ab,
Yongli
Huang
*c,
Zengsheng
Ma
c,
Yichun
Zhou
c,
Ji
Zhou
d,
Weitao
Zheng
e,
Qing
Jiang
e and
Chang Q.
Sun†
*a
aNOVITAS, School of Electrical and Electronic Engineering, Nanyang Technological University, Singapore 639798. E-mail: ecqsun@ntu.edu.sg
bCenter for Coordination Bond and Electronic Engineering, College of Materials Science and Engineering, China Jiliang University, Hangzhou 310018, China
cKey Laboratory of Low-Dimensional Materials and Application Technologies (Ministry of Education) and Faculty of Materials, Optoelectronics and Physics, Xiangtan University, Hunan 411105, China
dState Key Laboratory of New Ceramics and Fine Processing, Department of Materials Science and Engineering, Tsinghua University, Beijing 100084, China
eSchool of Materials Science, Jilin University, Changchun 130012, China
First published on 9th September 2014
Abstract
The Mpemba paradox, that is, hotter water freezes faster than colder water, has baffled thinkers like Francis Bacon, René Descartes, and Aristotle since B.C. 350. However, a commonly accepted understanding or theoretical reproduction of this effect remains challenging. Numerical reproduction of observations, shown herewith, confirms that water skin supersolidity [Zhang et al., Phys. Chem. Chem. Phys., DOI: 10.1039/C1034CP02516D] enhances the local thermal diffusivity favoring heat flowing outwardly in the liquid path. Analysis of experimental database reveals that the hydrogen bond (O:H–O) possesses memory to emit energy at a rate depending on its initial storage. Unlike other usual materials that lengthen and soften all bonds when they absorb thermal energy, water performs abnormally under heating to lengthen the O:H nonbond and shorten the H–O covalent bond through inter-oxygen Coulomb coupling [Sun et al., J. Phys. Chem. Lett., 2013, 4, 3238]. Cooling does the opposite to release energy, like releasing a coupled pair of bungees, at a rate of history dependence. Being sensitive to the source volume, skin radiation, and the drain temperature, the Mpemba effect proceeds only in the strictly non-adiabatic ‘source–path–drain’ cycling system for the heat “emission–conduction–dissipation” dynamics with a relaxation time that drops exponentially with the rise of the initial temperature of the liquid source.
1 Introduction
A commonly accepted explanation or numerical reproduction of the Mpemba paradox remains challenging despite efforts made since the age of Aristotle.1–5 Proposed factors explaining this effect include evaporation,6 frosting,7 solutes,8 supercooling,7,9 thermal convection,10,11etc. According to the winner12 of a competition held in 2012 by the Royal Society of Chemistry, thermal convection rationalizes the energy “emission–conduction–dissipation” dynamics in the “source–path–drain” system in which the Mpemba paradox takes place. However, little attention has yet been paid to the intrinsic nature and the relaxation dynamics of the hydrogen bond (O:H–O)13 as the primary component of the liquid source for heat emission and the liquid path for heat conduction. In this communication, we show quantitatively that the O:H–O bond memory and the water-skin supersolidity14,15 resolve this paradox with reproduction of the observed attributes.2,122 Numerical solution: water-skin supersolidity
2.1 Fourier thermal-fluid equation
We firstly conducted numerical calculation by introducing the skin supersolidity14,15 into the path of heat conduction. Molecular under coordination shortens and stiffens the H–O bond and meanwhile lengthens and softens the O:H nonbond through Coulomb repulsion between electron pairs on adjacent oxygen ions. This process turns the skin of water and ice into the supersolid phase that is elastic, polarized, thermally stable, highly tensile, hydrophobic, and self-lubricant.14,16 A mass density of 0.75 g cm−3, a high-frequency phonon of 3450 cm−1, an O 1s binding energy of 538.1 eV and a melting point of 315 K compared to the bulk values listed in Table 1 characterize the skin supersolidity.The Fourier equation17 with appropriate initial-and-boundary conditions best describes the process of thermal-fluid transportation in the liquid water but the skin-supersolidity is necessary. In order to examine all possible factors contributing to the Mpemba effect, we solved this initial-and-boundary condition problem using the finite element calculation method. Fig. 1 illustrates the adiabatically walled, open-ended, one-dimensional tube cell containing water at the initial temperature θi. We divide the tube cell into the bulk (B, from −l1 = −9 mm to 0) and the skin (S, from 0 to l2 = 1 mm) region along the x-axis and cool it in the drain of constant temperature θf. The θf is subject to variation.
 | ||
| Fig. 1 Water in the adiabatically walled, open-ended, one-dimensional tube cell at initial temperature θi is cooled in the drain of θf. The liquid source is divided into the bulk (B (−l1 = −9 mm, 0) and the skin (S (0, l2 = 1 mm)) in the right-hand side) region along the x-axis with thermal diffusivity αB and αS and the mass density ratio of ρS/ρB = 3/414,16 in the respective region. x = 0 is the bulk–skin interface. hj is the heat transfer (radiation) coefficient at the tube ends with the absence (j = 1) and presence (j = 2) of the skin. | ||
The rate of temperature change in any point (x) of the partitioned tube cell follows the step-function, for simplicity, and the initial-and-boundary conditions:
 | (1) |
The boundary conditions represent that at t > 0, both the temperature θ and its gradient θx = ∂θ/∂x continue at the skin–bulk interface (x = 0) and the thermal flux h(θf − θ) are conserved at both ends of the tube. The velocity field of heat convection takes the bulk value of vS = vB = 10−4 or 0 m s−1 for examination. As the heat transfer (through radiation) coefficient hj depends linearly on the thermal conductivity κ in the respective region,18 we took the standard value of h1/κB = h2/κS = 30 w m−2 K−1 (ref. 19) in solving the problem. The h2/κS term contains the boundary heat reflection that is also negligible. The h2/h1 ratio > 1 describes the possible effect of thermal radiation of the skin.
2.2 Examination of the thermal convection and diffusivity
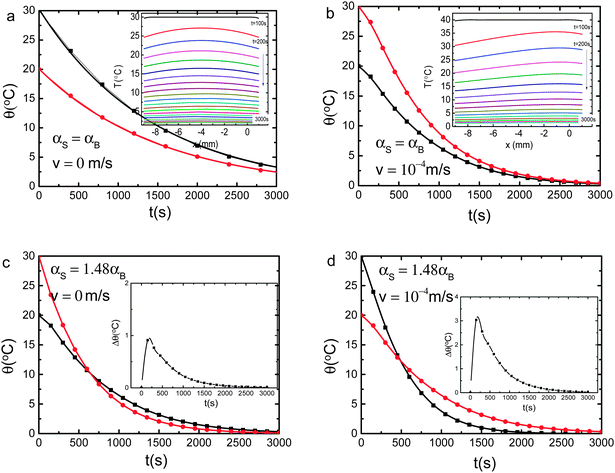
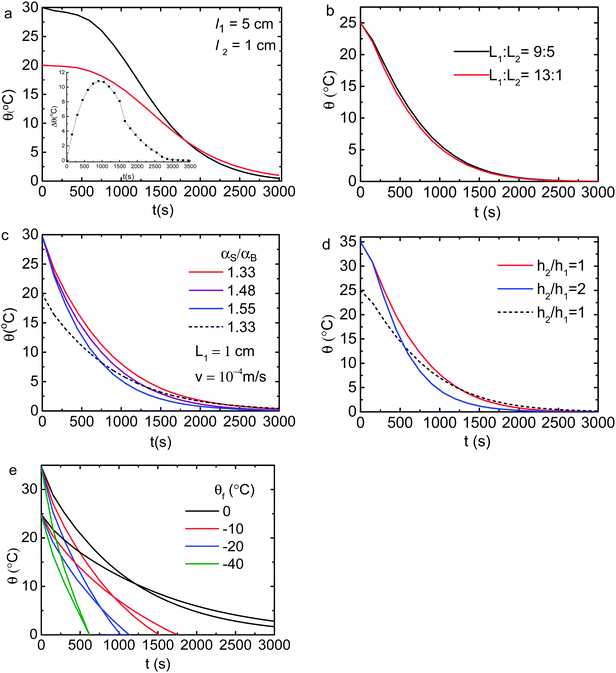
The computer reads in the digitized ρ(θ), κ(θ), and Cp(θ) in Fig. 8 to compose the αB(θ) before each iteration of calculating the partitioned elemental cells. Besides the thermal diffusivity and the convection velocity field in the Fourier equation, we examined all possible parameters in the initial-and-boundary conditions. Results in Fig. 2 and 3 revealed the following:(1) Characterized by the crossing temperature of the relaxation θ(θi, t) curves, the Mpemba effect occurs only in the presence of the skin supersolidity (αS/αB > 1) disregarding the thermal convection.
(2) Complementing the skin supersolidity, thermal convection raises only slightly the skin–bulk temperature difference, Δθ, and the crossing temperature.
(3) The Mpemba effect is sensitive to the source volume, the αS/αB ratio, the radiation h2, and the drain temperature θf.
(4) The bulk/skin thickness (l1![[thin space (1/6-em)]](https://www.rsc.org/images/entities/char_2009.gif) :
:![[thin space (1/6-em)]](https://www.rsc.org/images/entities/char_2009.gif) l2) ratio and the thermal convection velocity have little effect on observations.
l2) ratio and the thermal convection velocity have little effect on observations.
For instance, increasing the liquid volume may annihilate the Mpemba effect because of the non-adiabatic process of heat dissipation. It is understandable that cooling one drop of 1 mL water needs shorter time than cooling one cup of 200 mL water at the same θi under the same conditions. Higher skin radiation h2/h1 > 1 promotes the Mpemba effect. Therefore, conditions for the Mpemba effect are indeed very critical, which explains why the Mpemba effect occurs infrequently.
2.3 Reproduction of the Mpemba attributes
Fig. 4 shows numerical reproduction of the observed Mpemba attributes (insets),2,12 which confirmed the following: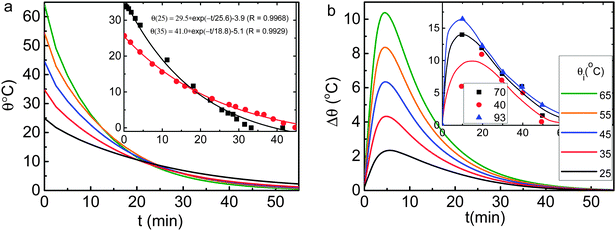 | ||
| Fig. 4 Numerical reproduction of the measured (insets) (a) thermal relaxation θ(θi,t) and (b) skin–bulk temperature difference Δθ(θi,t) curves2,12 for water cooling from different θi. Results were obtained using the conditions given in Fig. 3. | ||
(1) Hotter water freezes faster than colder water does under the same conditions;
(2) The liquid temperature θ drops exponentially with cooling time (t) for transiting water into ice with a relaxation time τ that drops as the θi is increased;
(3) The water skin is warmer than sites inside the liquid and the skin of hotter water is even warmer throughout the course of cooling.
3 Experimental revelation: O:H–O bond memory
3.1 θ i dependence of the H–O bond linear velocity
The following formulates the decay curve θ(θi, t) shown in Fig. 4a12 | (2) |
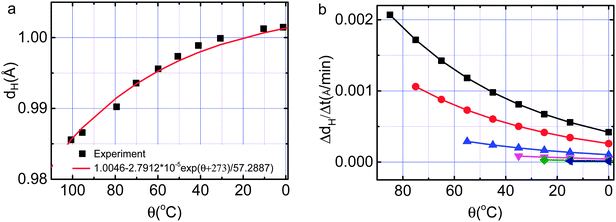
Excitingly, the documented experimental profiles of θ(θi, t)12 (Fig. 4a) and dH(θ)16 (Fig. 5a) allow us to show directly the memory of the O:H–O bond without needing any assumption or approximation. The θ(θi, t) curve provides the slope of dθ/dt = −τi−1θ and the dH(θ) = 1.0042–2.7912 × 10⁻⁵ exp[(θ + 273)/57.2887] (Å)16 curve formulates the measured θ dependence of the H–O bond relaxation. Multiplying slopes of both curves yields immediately the dH linear velocity under cooling.
The O:H nonbond is correlated with the H–O bond in relaxation by the equation in Table 1. As Ex = kx(Δdx)2/2 approximates the energy stored in the respective bond with kx being the force constant, one can obtain the velocities of dx and Ex readily (x = L and H denote the O:H and the H–O bond, respectively). For simplicity and concise, we will be focused on the instantaneous velocity of dH during relaxation:
 | (3) |
3.2 θ i dependence of the relaxation time
Solving the decay function (2) yields the relaxation time τi (ti, θi, θf), | (4) |
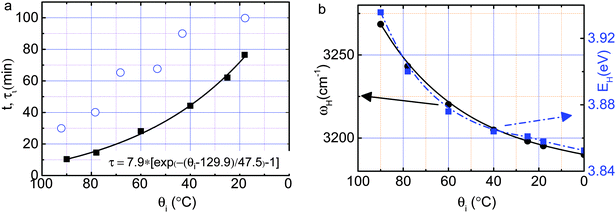 | ||
| Fig. 6 (a) Cooling time t (scattered circles) dependent relaxation time τi (fitted in solid line) is correlated with the (b) initial energy EH (solid black line) and vibration frequency ωH (dashed blue line)20 of the liquid source cooling at different θi. | ||
4 Discussion: heat “emission–conduction–dissipation”
4.1 Liquid source and path: Heat emission and conduction
The O:H–O bond approximates a pair of asymmetric, coupled, H-bridged oscillators with short-range interactions and memory.21Fig. 7 illustrates interactions and the cooperative relaxation of the O:H–O bond in water under thermal excitation cycling. An interplay of the O:H van der Waals (vdW-like) force, the H–O exchange interaction, the O–O inter-electron-pair repulsion (C-repulsion), and the specific heat disparity between the O:H and the H–O bond dislocate O atoms always in the same direction along the respective potential paths.22 The softer O:H(dL) nonbond always relaxes more in length than the stiffer H–O(dH) bond does.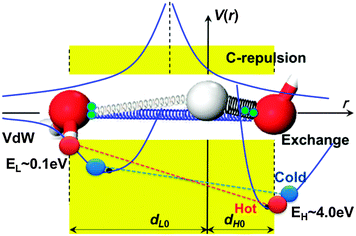 | ||
| Fig. 7 O:H–O bond short-range interactions and the O:H–O (denoted as dL and dH) cooperative relaxation dynamics.23,24dH0 and dL0 are the respective references at 4 °C. Indicated are the van der Waals like (vdW approaches the nonbonding interaction) interaction (EL ∼ 0.1 eV) of the O:H nonbond (left-handed side), the exchange interaction (EH ∼ 4.0 eV) of the H–O bond (right-handed side), and the Coulomb repulsion between electron pairs (paring green dots) on oxygen ions. A combination of these interactions and the specific heat disparity between the O:H and the H–O bond dislocate O atoms in the same direction by different amounts under cooling. The relaxation proceeds along the O:H–O bond potentials with H atoms (in grey) being the coordination origin under heating (red line linked spheres, denoted hot) or cooling (blue line linked spheres, denoted cold). Springs of different diameters represent the strengths of the respective interactions. | ||
Generally, heating stores energy into a substance by stretching all bonds involved. However, heating stores energy into water by shortening the H–O bond and stretching the O:H nonbond simultaneously, which is realized by the thermal expansion of the O:H nonbond that drags the H–O bond by weakening the Coulomb interaction between electron pairs on adjacent oxygen ions (red line linked spheres in Fig. 7). Cooling does oppositely (blue line linked spheres), like suddenly releasing a pair of coupled, highly deformed bungees from different extents of deformation – one is under stretching and the other under compressing, to emit energy at a rate of history dependence. Energy storage and emission of the entire O:H–O bond mainly through the H–O relaxation as EL (∼0.1 eV) of the O:H nonbond is only 2.5% of EH (∼4.0 eV).14 The O:H–O bond memory and the unusual way of energy ejection yield the history-dependent velocity of the H–O bond under cooling, given in Fig. 5b.
Molecular undercoordination effects the same to liquid heating upon the O:H–O bond relaxation, which shortens and stiffens the H–O bond and, meanwhile, lengthens and softens the O:H nonbond, depressing the local mass density and shifting the frequency of the respective phonons, as summarized in Table 1. Heating and molecular undercoordination enhance each other upon the O:H–O bond relaxation and the associated physical properties in the skin region. The lowered mass density raises the thermal diffusivity (see eqn (1)), which favors heat diffusion outwardly in the conduction path.
4.2 Source–drain interface: non-adiabatic cycling
It is necessary to emphasize that the Mpemba effect occurs only under the circumstance that the temperature drops abruptly from θi to θf at the source–drain interface. Fourier solution indicates that the Mpemba crossing temperature is sensitive to the volume of the liquid source (Fig. 3a). Too large liquid volume may prevent this effect by heat-dissipation hindering. As confirmed by Brownridge,7 any spatial temperature decay between the source and the drain could prevent the Mpemba effect from occurring. The procedures of decay include tube end sealing, oil film covering, source–drain vacuum isolation, connecting muffin-tin like containers, or putting multiple sources into the limited volume of a fridge. Conducting experiments under identical conditions is necessary to minimize artifacts such as radiation, source/drain volume ratio, exposing area, container material, etc.4.3 Other factors: supercooling, solutes, and evaporation
Supercooling is associated with the slower relaxation of the longer H–O bond at an initially lower temperature. It has been confirmed that EH determines the critical temperature for phase transition.22 Generally, superheating is associated with the shorter H–O bond pertained to water molecules with fewer than four neighbors such as those forming the skin, monolayer film, or droplet on a hydrophobic surface.25 Supercooling is associated with the longer H–O bond between molecules in contact with the hydrophilic surface26 or being compressed.22 A 210 MPa compression lowers the melting point to −22 °C according to the phase diagram.15 The supercooling of the colder water in the Mpemba process7 evidences that the initially longer H–O bond of colder water is slower than those in the warmer water to relax at icing because of the slower momentum of the relaxation – memory effect.The involvement of ionic solutes or impurities27,28 mediates the Coulomb coupling because of the alternation of charge quantities and ionic volumes.29,30 Salting shares the same effect of heating on the H–O phonon blue shift,31,32 which is expected to enhance the velocity of heat ejection under cooling. Mass loss due to evaporation of the liquid source3 affects the O:H–O relaxation little as the amount of evaporation is negligible under cooling. We have confirmed that the mass loss is only 1.5% or lower in repeating the experiments by freezing 75 °C water to −40 °C ice.
5 Conclusion
Reproduction of observations revealed the following pertaining to the Mpemba paradox:(1) O:H–O bond possesses memory, whose thermal relaxation defines intrinsically the rate of energy emission. Heating stores energy in water by O:H–O bond deformation. The H–O bond is shorter and stiffer in hotter water than in colder water. Cooing does oppositely to emit energy with a thermal momentum that is history dependent.
(2) Heating enhances the skin supersolidity and the skin thermal diffusivity by αS/αB ≥ ρB/ρS = 4/3. Convection alone produces no Mpemba effect but only raises the skin temperature slightly.
(3) A highly non-adiabatic ambient system is necessary to ensure the immediate energy dissipation at the source–drain interface. The Mpemba crossing temperature is not only sensitive to the volume of the liquid source but also to the drain temperature and to the radiation rate.
(4) The Mpemba effect takes place with a characteristic relaxation time that drops exponentially with the increase of the initial temperature or the initial energy storage of the liquid.
(5) The O:H–O bond memory may be implicated in living cells in which the hydrogen bond relaxation dominates the signaling, messaging, and damage recovery.
Appendix
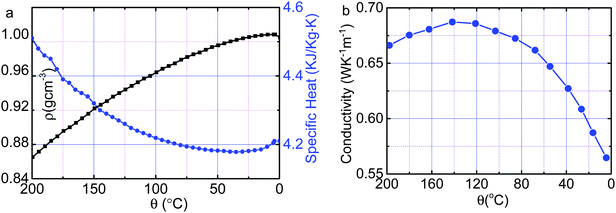 | ||
| Fig. 8 Temperature dependence33 of (a) the mass density ρ (in black) and specific heat Cp (in blue) and (b) the thermal conductivity κ (ref. 19) of liquid water, which form the thermal diffusivity of bulk water αB(θ) = κ(θ)/[ρ(θ)Cp(θ)]. | ||
| Water (298 K) | Ice (253 K) | Vapor | ||
|---|---|---|---|---|
| Bulk | Skin | Bulk | Monomer | |
a The phonon frequency shift is proportional to the square of bond stiffness:  with Y being the elastic modulus that is proportional to the energy density Ed−3.29 with Y being the elastic modulus that is proportional to the energy density Ed−3.29
|
||||
| O1s binding energy E1s (eV)35 | 536.6 | 538.1 | — | 539.7 |
| H–O bond energy EH (eV) | 3.9721 | 4.52–4.66 | — | 5.1036 |
| Melting point Tm (K) | 273 | 31537 | 273 | |
| H–O phonon frequency ωH (cm−1)38 | 3200 | 3450 | 3125 | 365039 |
| O:H phonon frequency ωL (cm−1)34 | 220 | ∼18014 | 210 | — |
| H–O bond length dH (Å)16 | 0.9981 | 0.8406 | 0.9676 | 0.8030 |
| O:H nonbond length dL (Å)16 | 1.6969 | 2.1126 | 1.8034 | ≥2.177 |
| O–O distance dOO (Å) | 2.70040 | 2.96541 | 2.77116 | 2.98041 |
| Mass density ρ (g cm−3)16 | 0.9945 | 0.7509 | 0.9242 | ≤0.7396 |
Acknowledgements
Critical reading by Yi Sun, assistance in confirming the mass loss (<1.5%) during Mpemba experiments by Lei Li, Hongwei Tian, and Xiaoming Zhang, and financial support from NSF (No. 21273191, 11274198, and 51102148) China and MOE (RG29/12) Singapore are gratefully acknowledged.References
- Aristotle, Meteorology 350 B.C.E: http://classics.mit.edu/Aristotle/meteorology.1.i.html.
- E. B. Mpemba and D. G. Osborne, Cool?, Phys. Educ., 1979, 14, 410–413 CrossRef.
- D. Auerbach, Supercooling and the Mpemba effect – when hot-water freezes quicker than cold, Am. J. Phys., 1995, 63(10), 882–885 CrossRef.
- M. Jeng, The Mpemba effect: when can hot water freeze faster than cold?, Am. J. Phys., 2006, 74(6), 514 CrossRef CAS.
- C. A. Knight, The Mpemba effect: the freezing times of hot and cold water, Am. J. Phys., 1996, 64(5), 524 CrossRef.
- M. Vynnycky and S. L. Mitchell, Evaporative cooling and the Mpemba effect, Heat Mass Transfer, 2010, 46(8–9), 881–890 CrossRef.
- J. D. Brownridge, When does hot water freeze faster then cold water? A search for the Mpemba effect, Am. J. Phys., 2011, 79(1), 78 CrossRef CAS.
- J. I. Katz, When hot water freezes before cold, Am. J. Phys., 2009, 77(1), 27–29 CrossRef CAS.
- P. Ball, Does hot water freeze first, Phys. World, 2006, 19(4), 19–21 CAS.
- H. Heffner, The Mpemba effect: http://www.mtaonline.net/∼http://hheffner/Mpemba.pdf, 2001.
- M. Vynnycky and N. Maeno, Axisymmetric natural convection-driven evaporation of hot water and the Mpemba effect, Int. J. Heat Mass Transfer, 2012, 55(23–24), 7297–7311 CrossRef PubMed.
- N. Bregović, Mpemba effect from a viewpoint of an experimental physical chemist, http://www.rsc.org/images/nikola-bregovic-entry_tcm18-225169.pdf, 2012.
- L. B. Kier and C. K. Cheng, Effect of Initial Temperature on Water Aggregation at a Cold Surface, Chem. Biodiversity, 2013, 10(1), 138–143 CAS.
- C. Q. Sun, X. Zhang, J. Zhou, Y. Huang, Y. Zhou and W. Zheng, Density, Elasticity, and Stability Anomalies of Water Molecules with Fewer than Four Neighbors, J. Phys. Chem. Lett., 2013, 4, 2565–2570 CrossRef CAS.
- X. Zhang, Y. Huang, Z. Ma, J. Zhou, Y. Zhou, W. Zheng and C. Q. Sun, A common superslid skin covering both water and ice, Phys. Chem. Chem. Phys., 2014 10.1039/C1034CP02516D.
- Y. Huang, X. Zhang, Z. Ma, Y. Zhou, J. Zhou, W. Zheng and C. Q. Sun, Size, separation, structure order, and mass density of molecules packing in water and ice, Sci. Rep., 2013, 3, 3005 Search PubMed.
- J. Fourier, The Analytical Theory of Heat, Dover Publications, New York, 1955 Search PubMed.
- J. R. Welty, C. E. Wicks, R. E. Wilson and G. L. Rorrer, Fundamentals of Momentum, Heat and Mass transfer, John Wiley and Sons, 2007 Search PubMed.
- Water Thermal Properties – The Engineering Toolbox [Online], available: http://www.engineeringtoolbox.com/water-thermal-properties-d_162.html.
- P. C. Cross, J. Burnham and P. A. Leighton, The Raman spectrum and the structure of water, J. Am. Chem. Soc., 1937, 59, 1134–1147 CrossRef CAS.
- Y. Huang, X. Zhang, Z. Ma, Y. Zhou, G. Zhou and C. Q. Sun, Hydrogen-bond asymmetric local potentials in compressed ice, J. Phys. Chem. B, 2013, 117(43), 13639–13645 CrossRef CAS PubMed.
- C. Q. Sun, X. Zhang and W. T. Zheng, Hidden force opposing ice compression, Chem. Sci., 2012, 3, 1455–1460 RSC.
- G. R. Desiraju, A Bond by Any Other Name, Angew. Chem., Int. Ed., 2011, 50(1), 52–59 CrossRef CAS PubMed.
- L. R. Falvello, The Hydrogen Bond, Front and Center, Angew. Chem., Int. Ed., 2010, 49(52), 10045–10047 CrossRef CAS PubMed.
- A. Uysal, M. Chu, B. Stripe, A. Timalsina, S. Chattopadhyay, C. M. Schlepütz, T. J. Marks and P. Dutta, What x rays can tell us about the interfacial profile of water near hydrophobic surfaces, Phys. Rev. B: Condens. Matter Mater. Phys., 2013, 88(3), 035431 CrossRef.
- F. G. Alabarse, J. Haines, O. Cambon, C. Levelut, D. Bourgogne, A. Haidoux, D. Granier and B. Coasne, Freezing of Water Confined at the Nanoscale, Phys. Rev. Lett., 2012, 109(3), 035701 CrossRef CAS.
- M. Freeman, Cooler Still, Phys. Educ., 1979, 14, 417–421 CrossRef.
- B. Wojciechowski, Freezing of Aqueous Solutions Containing Gases, Cryst. Res. Technol., 1988, 23, 843–848 CrossRef CAS.
- C. Q. Sun, Relaxation of the Chemical Bond, Springer Ser. Chem. Phys., vol. 108, Springer Press, Berlin, 2014, p. 550, ISBN: 978-981-4585-20-0 Search PubMed.
- J. D. Smith, R. J. Saykally and P. L. Geissler, The Effects of Dissolved Halide Anions on Hydrogen Bonding in Liquid Water, J. Am. Chem. Soc., 2007, 129, 13847–13856 CrossRef CAS PubMed.
- Q. Sun, Raman spectroscopic study of the effects of dissolved NaCl on water structure, Vib. Spectrosc., 2012, 62, 110–114 CrossRef CAS PubMed.
- S. Park and M. D. Fayer, Hydrogen bond dynamics in aqueous NaBr solutions, Proc. Natl. Acad. Sci. U. S. A., 2007, 104(43), 16731–16738 CrossRef CAS PubMed.
- M. Chaplin. Water structure and science: http://www.lsbu.ac.uk/water/.
- C. Q. Sun, X. Zhang, X. Fu, W. Zheng, J.-l. Kuo, Y. Zhou, Z. Shen and J. Zhou, Density and phonon-stiffness anomalies of water and ice in the full temperature range, J. Phys. Chem. Lett., 2013, 4, 3238–3244 CrossRef CAS.
- M. Abu-Samha, K. J. Borve, M. Winkler, J. Harnes, L. J. Saethre, A. Lindblad, H. Bergersen, G. Ohrwall, O. Bjorneholm and S. Svensson, The local structure of small water clusters: imprints on the core-level photoelectron spectrum, J. Phys. B: At., Mol. Opt. Phys., 2009, 42(5), 055201 CrossRef.
- S. A. Harich, D. W. H. Hwang, X. Yang, J. J. Lin, X. Yang and R. N. Dixon, Photodissociation of H2O at 121.6 nm: A state-to-state dynamical picture, J. Chem. Phys., 2000, 113(22), 10073–10090 CrossRef CAS PubMed.
- H. Qiu and W. Guo, Electromelting of Confined Monolayer Ice, Phys. Rev. Lett., 2013, 110(19), 195701 CrossRef.
- T. F. Kahan, J. P. Reid and D. J. Donaldson, Spectroscopic probes of the quasi-liquid layer on ice, J. Phys. Chem. A, 2007, 111(43), 11006–11012 CrossRef CAS PubMed.
- Y. R. Shen and V. Ostroverkhov, Sum-frequency vibrational spectroscopy on water interfaces: polar orientation of water molecules at interfaces, Chem. Rev., 2006, 106(4), 1140–1154 CrossRef CAS PubMed.
- U. Bergmann, A. Di Cicco, P. Wernet, E. Principi, P. Glatzel and A. Nilsson, Nearest-neighbor oxygen distances in liquid water and ice observed by x-ray Raman based extended x-ray absorption fine structure, J. Chem. Phys., 2007, 127(17), 174504 CrossRef PubMed.
- K. R. Wilson, R. D. Schaller, D. T. Co, R. J. Saykally, B. S. Rude, T. Catalano and J. D. Bozek, Surface relaxation in liquid water and methanol studied by x-ray absorption spectroscopy, J. Chem. Phys., 2002, 117(16), 7738–7744 CrossRef CAS PubMed.
- F. Mallamace, M. Broccio, C. Corsaro, A. Faraone, D. Majolino, V. Venuti, L. Liu, C. Y. Mou and S. H. Chen, Evidence of the existence of the low-density liquid phase in supercooled, confined water, Proc. Natl. Acad. Sci. U. S. A., 2007, 104(2), 424–428 CrossRef CAS PubMed.
Footnote |
| † Chang Q. Sun has honorary appointments in all affiliations. |
| This journal is © the Owner Societies 2014 |

