
 Open Access Article
 This Open Access Article is licensed under a Creative Commons Attribution-Non Commercial 3.0 Unported Licence
Graphene-mediated surface enhanced Raman scattering in silica mesoporous nanocomposite films†
Davide
Carboni
a,
Barbara
Lasio
a,
Valeria
Alzari
b,
Alberto
Mariani
b,
Danilo
Loche
c,
Maria F.
Casula
c,
Luca
Malfatti
a and
Plinio
Innocenzi
*a
aLaboratorio di Scienza dei Materiali e Nanotecnologie, CR-INSTM, DADU, Università di Sassari, Palazzo Pou Salid, Piazza Duomo 6, 07041 Alghero (SS), Italy. E-mail: plinio@uniss.it
bDipartimento di Chimica e Farmacia, Università di Sassari, Local INSTM Unit, Via Vienna 2, 07100 Sassari, Italy
cDipartimento di Scienze Chimiche e Geologiche, Università di Cagliari, 09042 Monserrato (CA), Italy
First published on 18th September 2014
Abstract
Silica mesoporous nanocomposite films containing graphene nanosheets and gold nanoparticles have been prepared via a one-pot synthesis using silicon tetrachloride, gold(III) chloride tetrahydrate, a 1-N-vinyl-2-pyrrolidone dispersion of exfoliated graphene and Pluronic F127 as a structuring agent. The composite films have shown graphene-mediated surface-enhanced Raman scattering (G-SERS). Graphene has been introduced as dispersed bilayer sheets while gold has been thermally reduced in situ to form nanoparticles of around 6 nm which preferentially nucleate on the surface of the graphene nanosheets. The presence of graphene and gold nanoparticles does not interfere with the self-assembly process and the formation of silica mesoporous films ordered as 2D hexagonal structures. The material has shown a remarkable analytical enhancement factor ranging from 80 up to 136 using rhodamine 6G as a Raman probe. The films have been characterised by grazing incidence X-ray diffraction, FTIR and UV-vis spectroscopy studies; transmission electron microscopy and spectroscopic ellipsometry have been used to study the morphology, thickness and porosities of the samples. Raman spectroscopy has been employed to characterise the graphene nanosheets embedded into the mesoporous films and the enhanced Raman scattering.
Introduction
Graphene is a bi-dimensional carbon-based material characterised by a honeycomb lattice structure,1 which in the last few years has become a hot topic because of its very interesting properties in different scientific fields spanning, for instance, from graphene-based micro-supercapacitors2 to graphene-based materials for optical sensing3 and environmentally responsive graphene systems.4 An interesting application of graphene has been envisaged after discovering its capability of enhancing the Raman scattering signal, an effect that has been indicated as graphene-mediated enhanced Raman scattering (GERS) since then.5 Graphene has a flat and smooth surface that is very suitable for homogeneously depositing molecules, especially aromatic, which can lead to π–π bonding interactions capable of promoting the charge transfer. Furthermore graphene has an easier preparation method, lower cost and higher biocompatibility when compared to metal surfaces, which are used for conventional surface-enhanced Raman scattering (SERS).6 One of the main limitations in the application of graphene for increasing the Raman scattering is the small enhancement factor (10–102) that characterizes this material due to the chemical mechanism (CM) which governs the charge transfer between graphene and the molecule that has to be detected. Recent studies, however, have demonstrated the possibility of coupling the GERS (essentially due to CM) with the more conventional SERS, mostly based on an electromagnetic mechanism (EM), to develop a combined effect called graphene-mediated surface-enhanced Raman scattering (G-SERS) where metal nanoparticles have been deposited on flat graphene surfaces.7 Moreover, it has been found that coupling metal nanoparticles with graphene layers has the great advantage of increasing the stability of the Raman probes, such as rhodamine 6G, since graphene is quite resistant to photo-induced damage because of small absorption in the UV-vis range and high thermal conductivity.8The development of graphene-mediated SERS devices is still a largely unexplored field and the simplest sensing architecture is based on growing metallic nanoparticles, which show SERS such as gold and silver, directly onto the surface of a graphene sheet. The molecule to be detected can be directly deposited on the surface and detected by Raman spectroscopy; a more advanced device could, however, be envisaged if the graphene with metallic nanoparticles is inserted into a porous matrix. The advantage of such a system, besides the higher stability, is the increase of the sensing surface and the possibility of building more complex devices based on detection of spots. A possible matrix for a graphene–metal nanoparticle system is represented by mesoporous oxides which are a class of versatile materials that can be nano-engineered at the mesoscale for a variety of applications especially when a specific pore organization and high surface area are required.9 The mesoporous materials can be easily processed through a template assisted self-assembly process as thin films with the specificity of an ordered structure of the pores; they represent an ideal host for metal nanoparticles that can be either loaded or let to grow into mesopores to control both the size and positioning, for instance, through a top-up process such as deep X-ray or UV-visible lithography.10 This method has been used to produce mesoporous nanocomposite films with metal gold or silver nanoparticles having SERS properties; this type of porous films has the intrinsic advantage of a high sensing surface area and easy integration in complex devices.11–14
Given the long-term experience in synthesizing mesoporous composite matrices, recently our laboratory has successfully embedded exfoliated graphene into highly ordered mesoporous titania films, showing remarkable self-cleaning properties.15 Graphene nanosheets have also been incorporated into dense silica films through sol–gel processing which is in general a difficult task because of the low solubility of graphene in the solvents used for sol–gel chemistry.16 In the present work we have used a self-assembly process to obtain an advanced nanocomposite, which is based on a mesoporous ordered silica matrix that hosts graphene sheets with gold nanoparticles. The high surface area of the mesoporous films combined with the presence of graphene and gold nanoparticles represent an ideal matrix for exploiting G-SERS for sensing devices.
Experimental
Chemicals
1-N-Vinyl-2-pyrrolidone (NVP, Sigma-Aldrich), graphite (Sigma-Aldrich), silicon tetrachloride (SiCl4 99.9%, Sigma-Aldrich), Pluronic F127 (PEO106–PPO70–PEO106, Aldrich) absolute ethanol (EtOH, 99.8% Fluka) and gold(III) chloride tetrahydrate (HAuCl4·4H2O) were used as received without further purification. The p-type/boron doped, (100) oriented, 400 μm thick silicon wafers (Si-Mat) and 1.2 mm thick silica slides (Heraeus, UV grade) were used as substrates.Exfoliated graphene (EG) dispersion in NVP
The exfoliated graphene (EG) dispersion was prepared starting from a NVP solution (50 cm3) containing 5 wt% of graphite flakes. The solution was placed in a tubular plastic reactor (15 mm inner diameter) and sonicated for 24 h at 25 °C (Ultrasound bath EMMEGI, 0.55 kW). The dispersion was centrifuged for 30 min at 4000 rpm to precipitate the remaining graphite flakes and the gray/black supernatant liquid was recovered. 25 cm3 of the liquid was then used to determine the graphene concentration; the liquid was filtered through poly-vinylidene fluoride filters (0.22 mm pore size) to directly weigh the amount of dispersed graphene. By using this method, a concentration of 2.27 mg cm−3 was obtained.Mesoporous silica films with embedded exfoliated graphene sheets
A solution of SiCl4 in EtOH was prepared by dissolving 1 cm3 of SiCl4 in 15 cm3 of absolute EtOH (SiCl4 stock). A silica precursor sol was prepared by dissolving F127 (0.656 g, 5 × 10⁻² mmol) in 7 cm3 of SiCl4 stock, diluted with 2 cm3 of absolute EtOH and then stirred for 30 minutes to dissolve the surfactant (SiCl4![[thin space (1/6-em)]](https://www.rsc.org/images/entities/char_2009.gif) :F127:EtOH = 1:10−2:39). After this time 0.500 cm3 of deionized water was added to the solution. 0.025 cm3 of graphene NVP dispersion was mixed with 2 cm3 of the silica sol precursor, kept under stirring for 10 minutes and then deposited on a silicon substrate by spin coating. The films with embedded gold nanoparticles (Au-NPs) were prepared by adding 0.0026 g (6.6 × 10⁻⁶ mmol) of HAuCl4 to the silica precursor sol with or without the addition of graphene-NVP dispersion. The films were deposited on silica and silicon substrates by casting 0.050 cm3 of precursor solution and spin coating them at 2000 rpm for 40 s first and then at 300 rpm for 30 s. The films were firstly treated at 100 °C for 12 h and then for further 2 h at 350 °C.
:F127:EtOH = 1:10−2:39). After this time 0.500 cm3 of deionized water was added to the solution. 0.025 cm3 of graphene NVP dispersion was mixed with 2 cm3 of the silica sol precursor, kept under stirring for 10 minutes and then deposited on a silicon substrate by spin coating. The films with embedded gold nanoparticles (Au-NPs) were prepared by adding 0.0026 g (6.6 × 10⁻⁶ mmol) of HAuCl4 to the silica precursor sol with or without the addition of graphene-NVP dispersion. The films were deposited on silica and silicon substrates by casting 0.050 cm3 of precursor solution and spin coating them at 2000 rpm for 40 s first and then at 300 rpm for 30 s. The films were firstly treated at 100 °C for 12 h and then for further 2 h at 350 °C.
Material Characterisation
The diffraction patterns were analyzed according to the Rietveld method17 by using the program MAUD version 2.33,18 running on a personal computer. The weighted pattern agreement index of the fit (Rw %) was 6.56.
The evaluation of the enhanced Raman scattering (ERS) effect was done using silica mesoporous films containing either graphene or gold nanoparticles or both. The samples used for SERS were thermally treated at 350 °C; rhodamine 6G (Rh6G) was used as a molecular probe by casting 10 μl of a 5 × 10⁻³ M ethanol solution on the film.
A laser excitation wavelength of 785 nm, 1 mW of nominal power and a 100× objective were used for the analysis. An equal amount of Rh6G solution was deposited on a bare mesoporous silica film to have a signal not affected by the ERS effect to be taken as a reference.
Results and discussion
In a recent work we have demonstrated the possibility of dispersing graphene nanosheets, obtained through chemical exfoliation of graphite by ultrasonication in 1-vinyl-pyrrolidone (NVP)19 into titania ordered mesoporous films by using supramolecular templates and sol–gel chemistry.15 We have also produced nanocomposite silica dense films via sol–gel, in both cases overcoming the problem of dispersing pristine graphene in the precursor sols.16 In the present work we have moved a step further by incorporating, in a one-pot route, exfoliated graphene nanosheets and gold nanoparticles into silica mesoporous films. To allow a clear comparison of the relative performances, we have prepared three types of nanocomposite silica mesoporous films; one embedding only graphene, a second only gold nanoparticles and the third embedding both graphene and gold nanoparticles. The silica mesoporous films have been prepared by self-assembly using as template, Pluronic F127, a non-ionic tri-block co-polymer characterised by the presence of polyethylene oxide (PEO) and polypropylene oxide (PPO) blocks. The synthesis that we have developed allows obtaining a solution of dispersed graphene with concentrations in the range of several mg ml−1; this solution is compatible both with sol–gel chemistry and the film self-assembly process while graphene remains well dispersed in the precursor sol. The graphene introduced into the matrix is obtained by physical exfoliation in the liquid phase and therefore it contains a lower amount of defects in its sp2-hybridized carbon structure with respect to reduced graphene oxide.20 Furthermore, the addition of HAuCl4 in the sol does not interfere with the film formation, enabling the fabrication of complex nanocomposites formed by a mesoporous ordered silica matrix containing graphene and gold nanoparticles via one-step.FTIR analysis of the nanocomposite materials has been performed on samples, thermally treated at 100 and 350 °C, to monitor the effect of thermal processing on the removal of the organic template and to determine the degree of densification of the silica matrix.
The FTIR spectra of films treated at 100 °C have shown that after this intermediate thermal treatment the organic surfactant Pluronic F127 is still present in all the samples (Fig. 1a); this is evidenced by the detection of three different bands between 3010 and 2800 cm−1 attributed to –CH3 asymmetric, –CH2 asymmetric, and –CH3 symmetric stretching modes, (Fig. 1b). In the same range a wide absorption band which peaks at around 3400 cm−1 is detected; this band is assigned to –OH stretching and has a shoulder at 3200 cm−1 which is due to –OH stretching of absorbed water. The same band shows a small peak at higher wavenumber which is assigned to isolated silanols. The presence of water, because of the hydrophilicity of the silica surface, is confirmed by the rise of the absorption peak at around 1640 cm−1 assigned to water bending.21 The signals due to carbon stretching, including those related to NVP, the graphene dispersing agent, completely disappeared in all the samples after the thermal treatment of 2 hours at 350 °C, which is required to stabilise the oxide matrix (Fig. 1c). The FTIR spectra in the 1800 to 850 cm−1 region (Fig. 1b) show two signals at 1725 cm−1 and 1649 cm−1, attributed to C![[double bond, length as m-dash]](https://www.rsc.org/images/entities/char_e001.gif) O stretching, which has to be correlated both with the oxidative decomposition of the surfactant chain, due to the thermal treatment at 100 °C and the amide groups in NVP.
O stretching, which has to be correlated both with the oxidative decomposition of the surfactant chain, due to the thermal treatment at 100 °C and the amide groups in NVP.
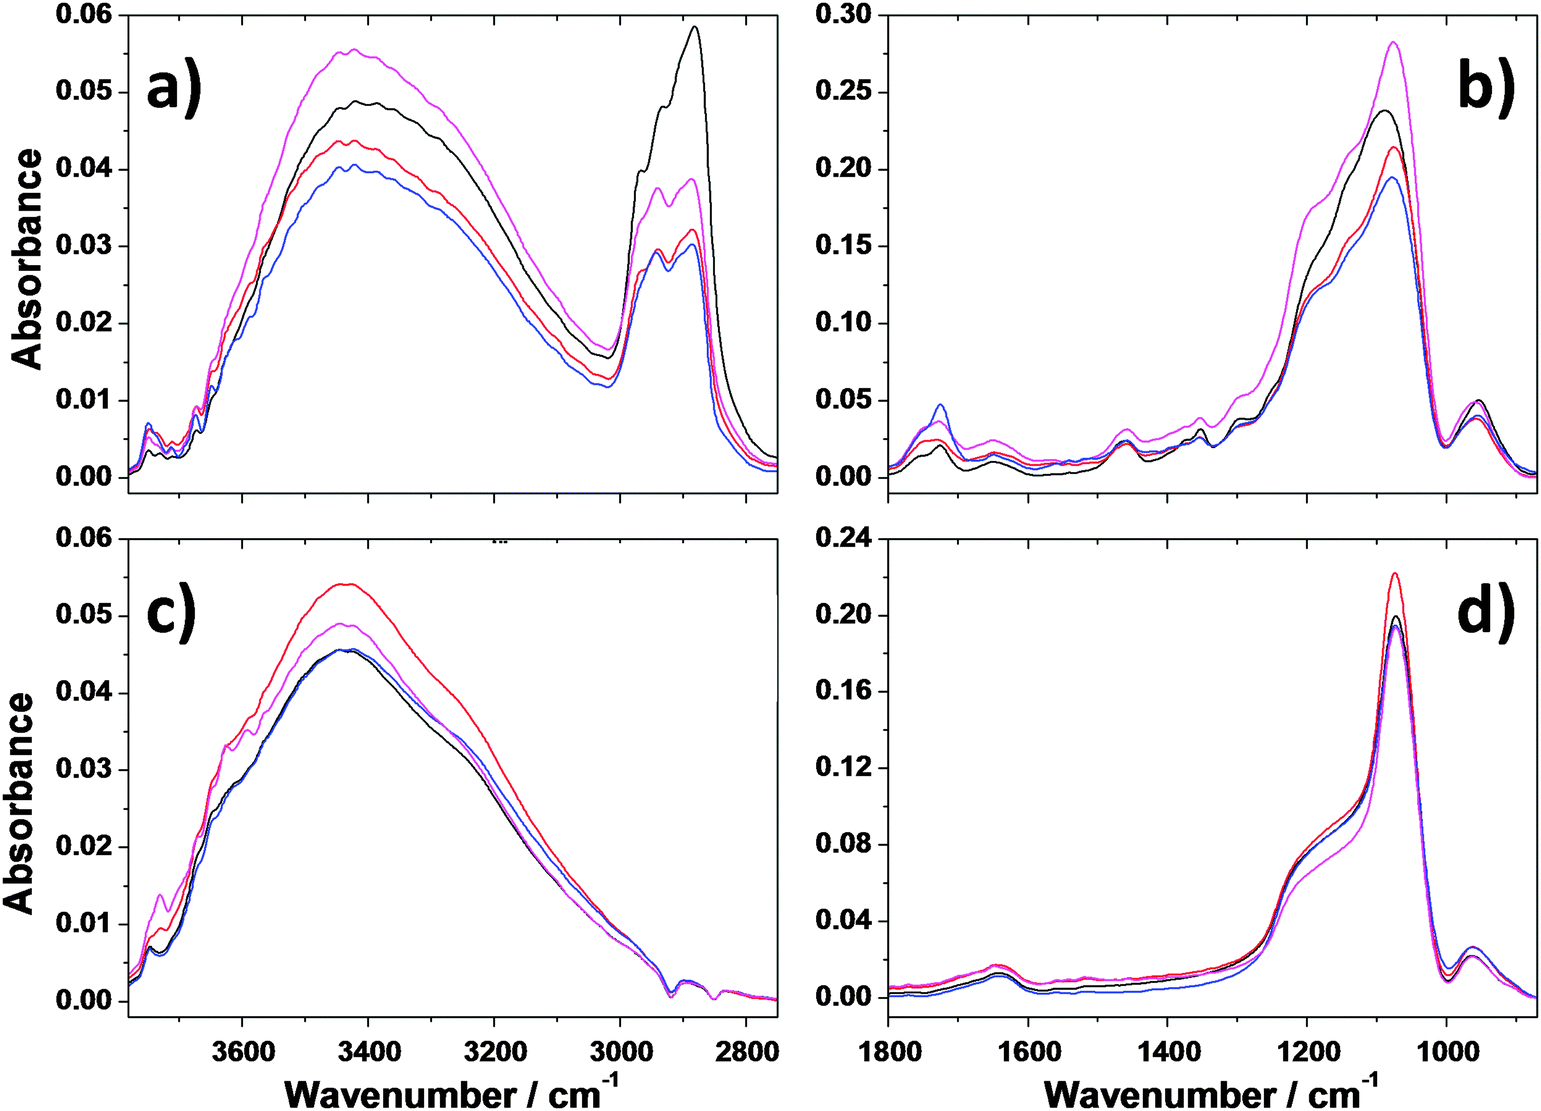 | ||
| Fig. 1 FTIR spectra of silica mesoporous films treated at 100 (a and b) and 350 °C (c and d). Black line: mesoporous silica films; red line: mesoporous silica films containing gold nanoparticles; blue line: mesoporous silica films containing exfoliated graphene; pink line: mesoporous silica films containing both exfoliated graphene and gold nanoparticles. | ||
The signal centred at 1077 cm−1 is attributed to the antisymmetric stretching of the Si–O–Si silica bond and that at 954 cm−1 to the stretching mode of Si–OH. Interestingly, the main silica band at 1077 cm−1 is characterised by two shoulders at 1138 and 1196 cm−1, which are assigned to the presence of unreacted silicon alkoxide species (Si–OC2H5) and to the signature of uncondensed silica.22 Given the low concentration of NVP graphene dispersion used to reduce aggregation, the infrared signals, associated with NVP and described in our previous work,16 are not detectable. The FTIR spectra of all the samples annealed for 2 hours at 350 °C are similar to the main Si–O–Si absorption band centred at 1077 cm−1 and a shoulder at around 1175 cm−1, which is the typical signature of porous silica.22 The annealing step at 350 °C allows the densification of the silica backbone through condensation reactions with removal of silanols (vide infra). It should be underlined that whilst the silica structure which forms the backbone of pores is largely condensed, the presence of residual silanols, shown by the Si–OH stretching band at 930 cm−1 and –OH stretching at 3400 cm−1, makes the film surface hydrophilic and favours the absorption of the solution containing the molecules to be probed by Raman spectroscopy. On the other hand, the structure and organization of the mesoporous silica films are not affected by the presence of graphene sheets and/or gold nanoparticles as shown by the FTIR spectra (Fig. 1d).
After annealing at 350 °C, the morphology of nanocomposite mesoporous silica films containing both exfoliated graphene and gold nanoparticles has been studied by transmission electron and atomic force microscopy. Fig. 2a and b show representative images of the silica mesoporous matrix and the bi-layered graphene aggregate with gold nanoparticles on the surface. Two additional TEM images are provided in the ESI† to give a broader view of the nanoparticle distribution (Fig. S1).
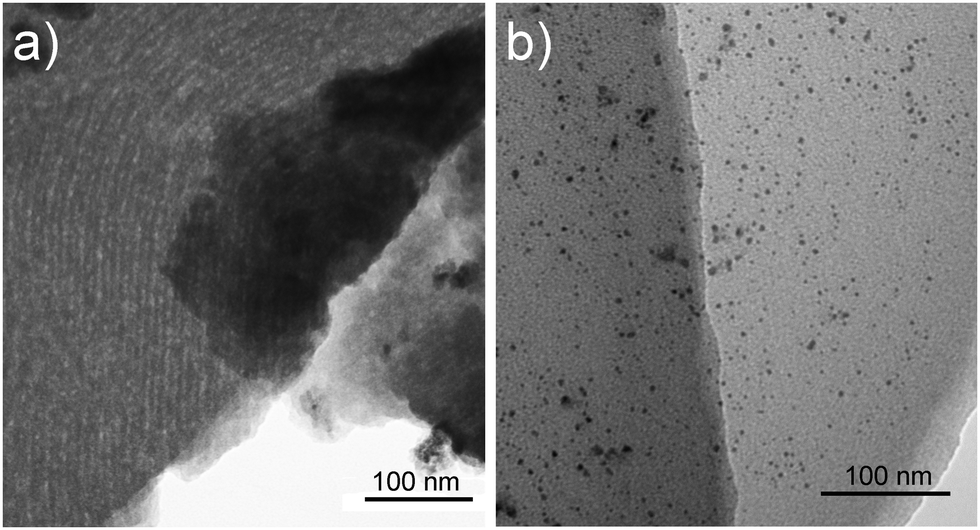 | ||
| Fig. 2 Bright field TEM characterization of silica mesoporous nanocomposite films containing both exfoliated graphene and gold nanoparticles. The images show the mesoporous ordered structure of the silica matrix (a) and the graphene bi-layered aggregate with gold nanoparticles on the surface (b). | ||
Bright field TEM characterization of the inorganic framework reveals a 2D hexagonal stack of micron-sized channels with a poor degree of organization (Fig. 2a). The channels have a pore-to-pore distance of around 9.0 ± 0.7 nm, as estimated by line profile analysis. The ordered domains, however, are curved and show a tilting of the channel axes.23 Remarkably, a large majority of the gold nanoparticles can be found around the graphene sheets, indicating that the nucleation of these objects preferentially occurs at the silica-graphene interface (Fig. 2b). From a statistic obtained over 450 nanoparticles, the average size has been estimated to be 6.0 ± 2.4 nm. No evidence of graphene nanosheets has been detected on the film surface through AFM characterization, either by topography and phase imaging (Fig. S2, ESI†).
To verify how the embedding procedure of exfoliated graphene and/or gold nanoparticles affected the thickness, porosity and refractive index of the mesoporous silica films, the samples have been analysed by spectroscopic ellipsometry. We have evaluated the thicknesses and porosities of the mesoporous silica samples containing graphene and/or gold nanoparticles before (100 °C) and after (350 °C) removal of the templating agent Pluronic F127 (Table 1).
| T (°C) | Sample | Thickness (nm) | MSE | Porosity (%) | Refractive index |
|---|---|---|---|---|---|
| 100 | Mesoporous silica (MS) | 403 ± 4 | 7.87 | 0 | 1.47 |
| MS–graphene | 429 ± 5 | 7.50 | 7.3± 1.0 | 1.43 | |
| MS–gold | 340 ± 2 | 3.51 | 0 | 1.47 | |
| MS–graphene–gold | 371 ± 4 | 7.95 | 4.3 ± 0.9 | 1.45 | |
| 350 | Mesoporous silica (MS) | 288 ± 1 | 1.25 | 21.1 ± 0.7 | 1.34 |
| MS–graphene | 284 ± 3 | 2.58 | 22.0 ± 1.5 | 1.34 | |
| MS–gold | 266 ± 2 | 1.64 | 16.5 ± 0.9 | 1.36 | |
| MS–graphene–gold | 265 ± 2 | 1.79 | 16.5 ± 0.9 | 1.36 | |
Table 1 proves that all the samples have a very good agreement between the experimental data and the theoretical model used to fit them. In fact, the MSE associated with the fittings is always lower than 8.0 for the samples still containing the template (since they are treated only at 100 °C) and lower than 2.5 for the samples heat-treated for 2 h at 350 °C to remove the surfactant. The presence of exfoliated graphene nanosheets does not seem to affect much the thickness of the composite films since the bare mesoporous silica is about 400 nm thick whilst the one containing graphene is 30 nm thicker (429 nm). In contrast, the addition of a gold precursor to the sol–gel decreases the film thickness by 15% (340 nm for mesoporous silica with gold nanoparticles and 371 nm for the one containing also graphene). However, interestingly, the presence of exfoliated graphene affects the porosity of the films, in fact, the samples treated at 100 °C, and therefore not yet fully condensed, have shown higher porosity when compared to the bare mesoporous silica (+7%) and mesoporous silica with gold nanoparticles (+4%). The different thicknesses shown by the films before the template removal is further confirmed by the analysis of the samples calcined at 350 °C. In fact, while the films not containing gold nanoparticles are about 280 nm thick, the thickness decreases (around 7%) upon addition of gold, likely because of the higher acidity of the sol which increases the condensation rate of silica. It is noteworthy that the porosity of the films fired at 350 °C increased dramatically compared to the same samples treated at 100 °C. In this case the big difference can be envisaged between the samples with and without gold nanoparticles since the latter are characterised by higher porosities (22% vs. 16% for the samples with both graphene and gold nanoparticles). These results lead to the conclusion that while the presence of low concentrations of exfoliated graphene nanosheets does not change much the film morphology (thickness and porosity), the addition of the gold nanoparticle precursor to the sol–gel decreases instead both thickness and porosity of the resulting films. An attempted explanation can be figured out by assuming that some residues of the gold precursor present in the films before the template removal could partially fill the mesopores that are left empty while the surfactant decomposes due to the thermal treatment at 350 °C.
The successful embedding of the gold nanoparticles into the mesoporous silica films has been verified by X-ray diffraction analysis and UV-vis spectroscopy. Fig. 3 shows the XRD pattern of a silica mesoporous film containing gold nanoparticles after treatment at 350 °C; the results have been analysed by Rietveld method to evaluate the cell parameters. The signal at 56°, as well as other smaller peaks, are attributed to the presence of the gold precursor, gold(III) chloride tetrahydrate (HAuCl4), in the monoclinic phase (JCPDS 73-1234). For this reason, the Rietveld refinement was performed taking into account both the cubic phase of gold and the monoclinic phase of the gold precursor. The experimental data are the black dots and the fit is the green continuous line; the fit is consistent with a Fm![[3 with combining macron]](https://www.rsc.org/images/entities/char_0033_0304.gif) m gold cubic phase with the cell parameter a = 4.080 Å, and a 0.003 microstrain, in good agreement with the JCPDS 04-0784 card. Despite that the resulting fit is affected by the large amount of the gold precursor, the estimated average size of the nanoparticles was ≈8.73 nm.
m gold cubic phase with the cell parameter a = 4.080 Å, and a 0.003 microstrain, in good agreement with the JCPDS 04-0784 card. Despite that the resulting fit is affected by the large amount of the gold precursor, the estimated average size of the nanoparticles was ≈8.73 nm.
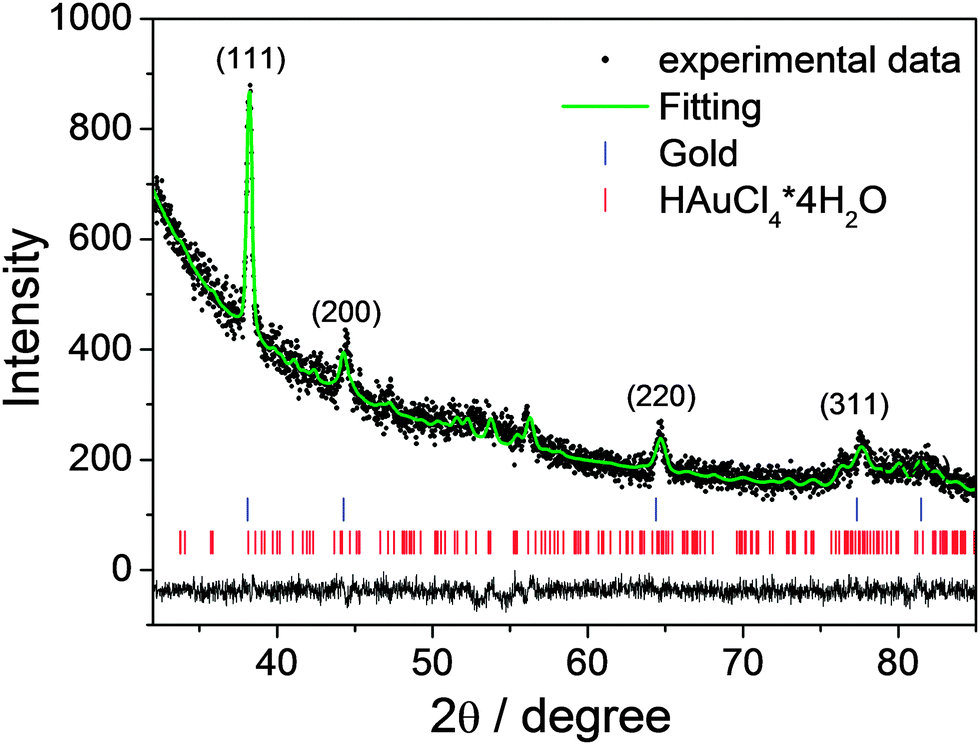 | ||
| Fig. 3 XRD pattern of silica mesoporous films containing gold nanoparticles after treatment at 350 °C. The experimental data are the black dots and the fit is the green continuous line. The blue and red ticks refer to the Au cubic and monoclinic HAuCl4 phases, respectively. The residuals plot is reported at the bottom of the figure. | ||
UV-vis analysis was performed on mesoporous silica films and films containing either graphene or gold or both graphene and gold nanoparticles after treatment at 100 (Fig. 4a) and 350 °C (Fig. 4b). The bare mesoporous silica films and also those containing 25 μl of graphene NVP dispersion are transparent in the visible region. The samples containing the gold nanoparticles instead show the plasmonic band due to the formation of gold nanoparticles with maximum absorbance centred at 611 and 614 nm for the films with and without graphene nanosheets, respectively, (Fig. 4a). After treating the samples at 350 °C (Fig. 4b), the mesoporous film containing graphene and gold nanoparticles has a maximum absorption band centred at 613 nm with no substantial difference from the value recorded before the thermal treatment.
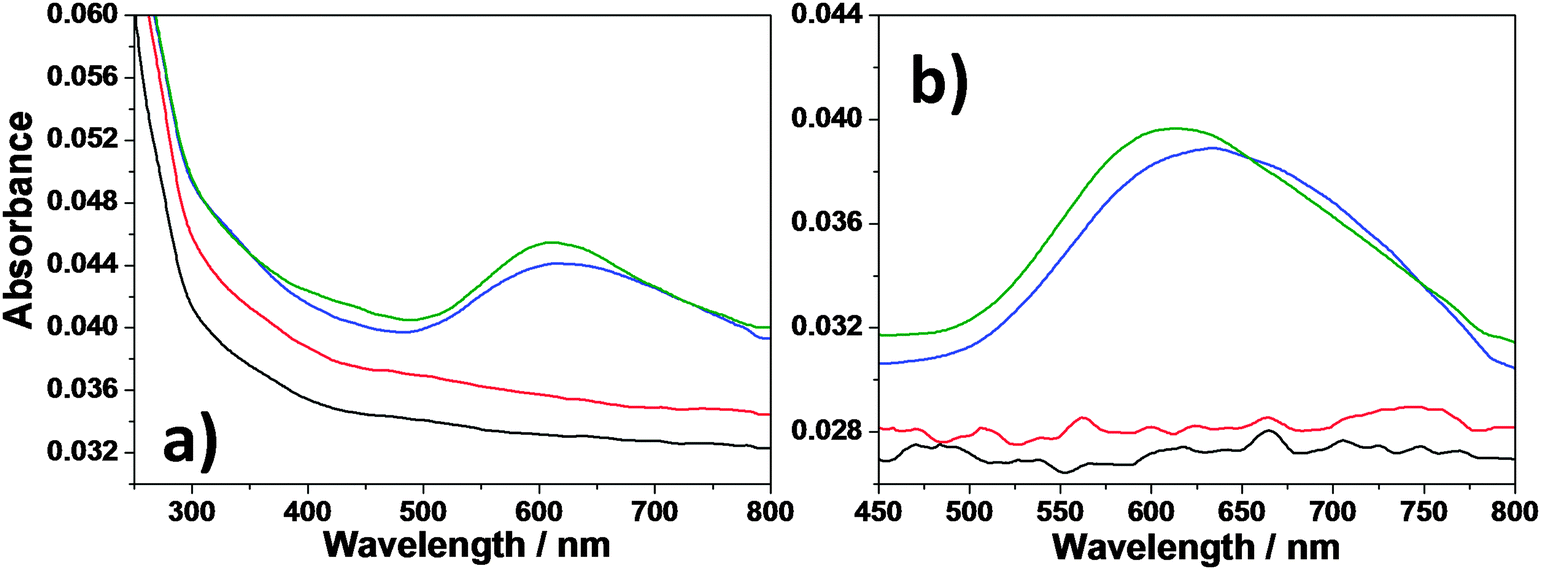 | ||
| Fig. 4 UV-vis spectra of mesoporous silica films (black line) and films containing graphene (red line), gold nanoparticles (blue line) and graphene and gold nanoparticles (green line), after 100 (a) and 350 °C thermal treatment (b). | ||
Raman analysis was performed on all the samples containing exfoliated graphene to evaluate the aggregation state of the graphene inside the silica mesoporous matrix. Fig. 5a and b show the Raman spectra of the films after thermal treatment at 100 and 350 °C, respectively. The presence of embedded graphene is confirmed by the characteristic Raman pattern; the breathing mode of k-point phonons of A1g symmetry (D band) at 1348 cm−1; the first-order scattering of the E2g mode of C sp2 atoms (G band) at 1583 cm−1; the D′ band at 1620 cm−1 which is overlapped with the G band and is attributed to Stokes scattering by a longitudinal optical phonon; the 2D band at 2706 cm−1 which is the first overtone of the D band and the sum of two phonons with opposite momenta; the D + D′ band at 2945 cm−1 and finally the 2D′ band at 3246 cm−1 which is the first overtone of the D′ band.16
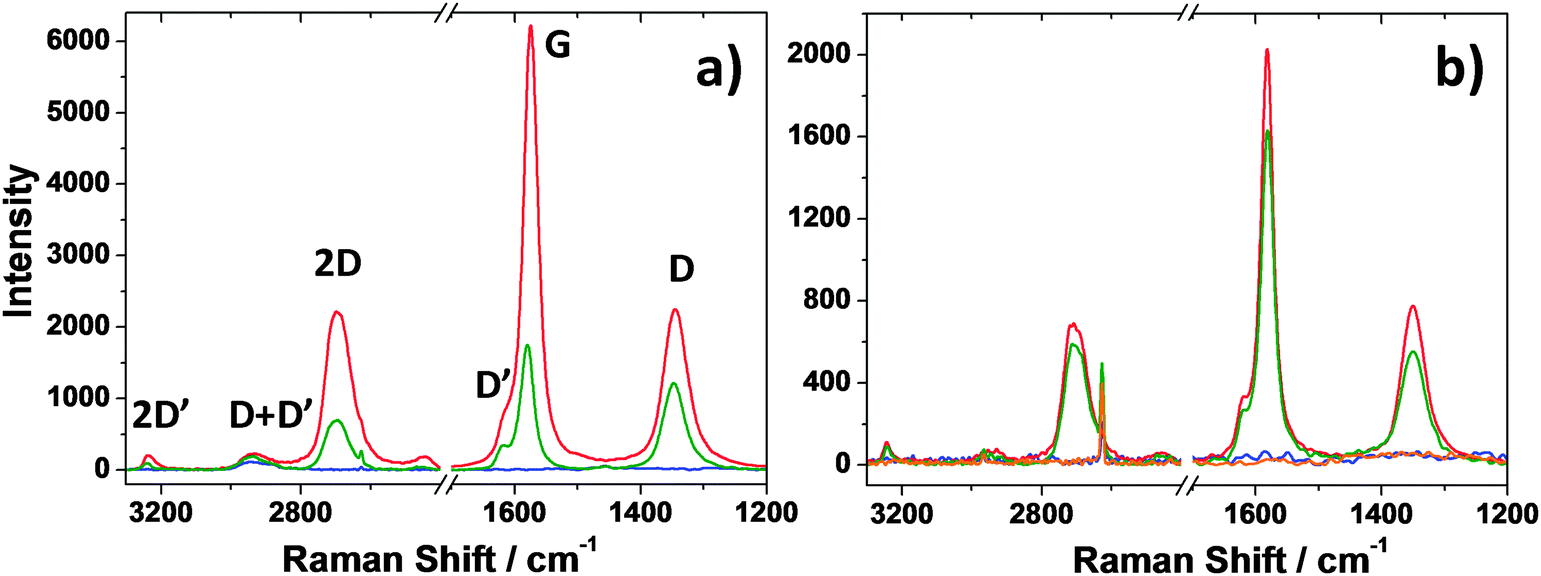 | ||
| Fig. 5 Raman spectra in the 3300–1200 cm−1 range of mesoporous silica films and films containing either graphene or gold or both, thermally treated at 100 (a) and 350 °C (b). Blue line: mesoporous silica films; red line: mesoporous silica films containing exfoliated graphene; orange line: mesoporous silica films containing gold nanoparticles; green line: mesoporous silica films containing both exfoliated graphene and gold nanoparticles. | ||
The Raman spectra can also be used to investigate the aggregation state of the graphene sheets inside the host matrix on the basis of the number of Lorentzian curves capable of fitting the graphene 2D band centred at about 2706 cm−1.24Fig. 6 shows the 2D graphene band acquired on mesoporous silica films containing both graphene nanosheets and gold nanoparticles after 350 °C thermal treatment. The band is best fitted with 4 Lorentzian curves plus a fifth component of a band peaking at 2627 cm−1 which is due to the silicon substrate; we have also considered this component to optimize the fit. The four component fit indicates that the graphene platelets are mostly present in the form of graphene bilayers and therefore they do not aggregate inside the mesoporous silica despite the presence of gold nano-particles.
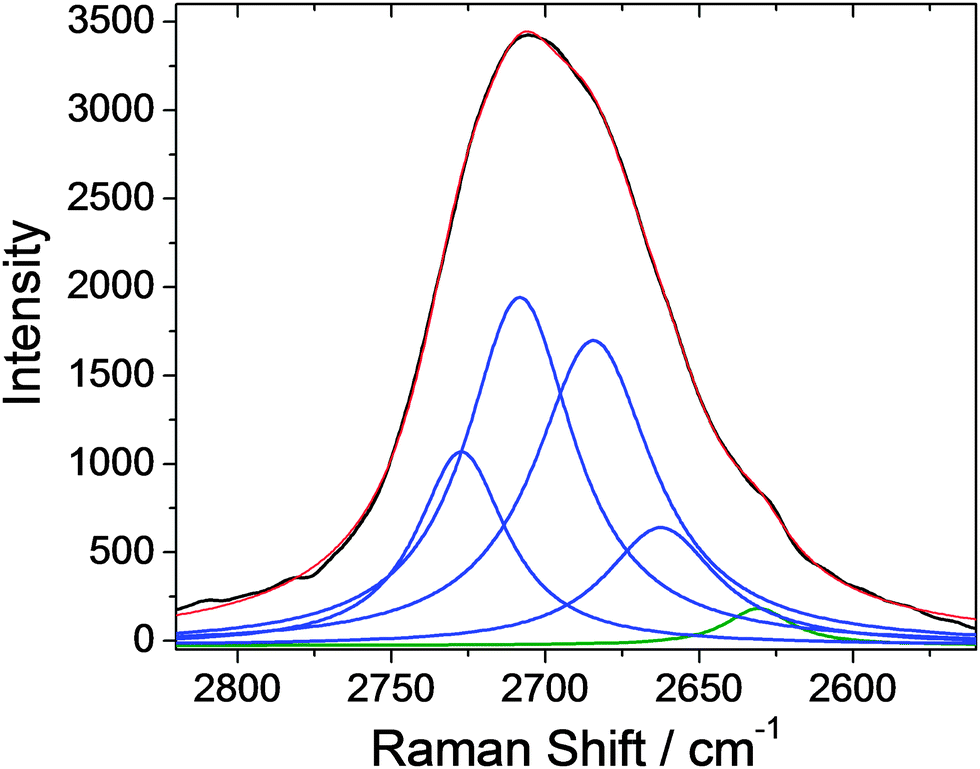 | ||
| Fig. 6 Raman spectra of mesoporous silica films in the range 2820–2560 cm−1 containing exfoliated graphene and gold nanoparticles, thermally treated at 350 °C. The black curve shows the acquired Raman spectrum while the red line describes the fitting obtained by combining the Lorentzian curves (blue curves). The green line centred at 2625 cm−1 is the fitted band of the silicon signal. | ||
The enhanced Raman scattering (ERS) properties of our nanocomposite films were evaluated by using rhodamine 6G as a probe. This molecule is characterised by several Raman bands associated with the aromatic C–C stretching modes (1648, 1572, 1547, 1505 and 1367 cm−1), an aromatic C–H bending mode at 775 cm−1 and a C–O–C stretching mode at 1190 cm−1 (Fig. 7 top).25 The band at 950 cm−1 is assigned to the presence of silanols, Si–OH, in accordance with FTIR spectra.26 These vibrational Raman modes can be used to estimate the enhancement factor (EF) due to different kinds of ERS, which characterize each of the silica mesoporous composite films. Besides the C–O–C stretching at 1184 cm−1, the aromatic C–C stretching modes can also be used to evaluate the EF since they do not suffer from the interference of the closely related signal of graphene when measuring with a laser wavelength of 785 nm and a nominal power of 1 mW.
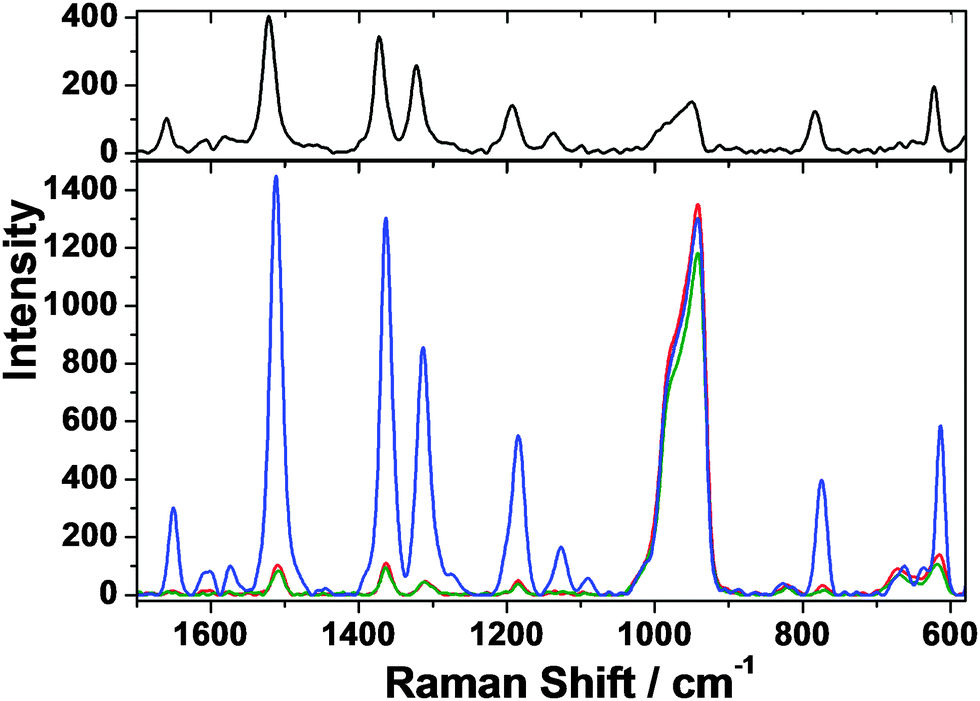 | ||
| Fig. 7 Raman spectra recorded in the range 1700–580 cm−1 of rhodamine 6G deposited on a silicon wafer (top black line) and of mesoporous silica films containing either graphene (red line) or gold (green line) or both (blue line), thermally treated at 350 °C. | ||
Fig. 7 shows that the rhodamine 6G signals acquired on the composite films prepared with either graphene nanosheets or gold nanoparticles have a much lower intensity, in comparison with those obtained by depositing the same amount of Rh6G onto mesoporous silica composites containing both graphene and gold. To obtain a correct comparison of these intensities, however, it is necessary to calculate the “enhancement factor”, EF. This is a parameter, associated with the ERS effect, used to compare different materials.27 Since ERS is strictly dependent on the ratio between the intensity IERS and the number of molecules accountable for that effect, NERS, a correct estimation of this value has to take into account both the intensity and the number of Rh6G molecules hit by the laser beam. For a given Raman mode, the EF is therefore calculated taking into account the ratio measured in the presence of ERS, IERS/NERS, with respect to the ratio determined in the absence of the ERS effect, Inon-ERS/Nnon-ERS. The purpose of this calculation is, in fact, that of determining the true enhancement of the Raman scattering per single molecule. On this basis the EF factor can be calculated using the following equation:28
 | (1) |
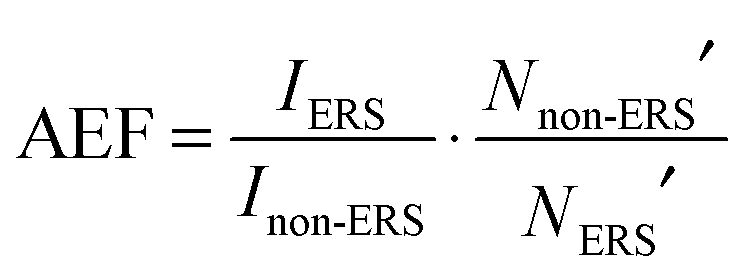 | (2) |
| N′ = VRh6G·s·h·P | (3) |
Since eqn (2) considers the ratio between Nnon-ERS′ and NERS′, and since both VRh6G and spot size s are constants, the equation can be simplified as:
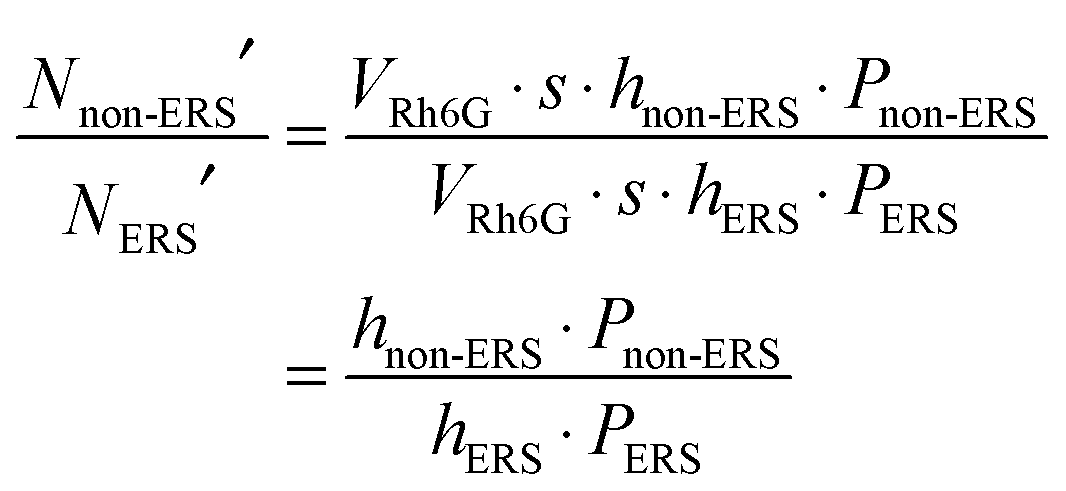 | (4) |
The AEF can thus be calculated using the following formula:
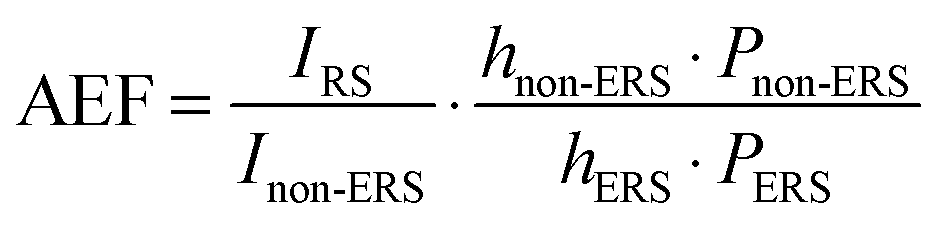 | (5) |
This equation returns a value, which is most likely an underestimation of the true EF since it does not take into account the real number of Rh6G molecules in solution that gives the not-enhanced Raman scattering. On the other hand, we have decided to use the AEF because we deemed that it represents a more direct parameter for a straight comparison between materials with similar morphologies that differ in the ERS features. For this reason we have determined the AEF of three composite silica mesoporous films that in principle should show three different ERS features: surface-ERS (films with embedded gold nanoparticles), graphene-ERS (films with embedded graphene nanosheets) and G-SERS (films embedded with both graphene nanosheets and gold nanoparticles).
Raman scattering measured on the ERS materials has been compared with that of bare mesoporous silica, obtained using the very same sol–gel procedure and that does not have any surface-enhancing properties. The AEF has been measured on three Rh6G bands: 1184 cm−1, (Fig. 8a), 1512 cm−1 (Fig. 8b) and 1650 cm−1 (Fig. 8c) and the resulting AEFs have been plotted in a bar graph for an easy comparison (Fig. 8d).
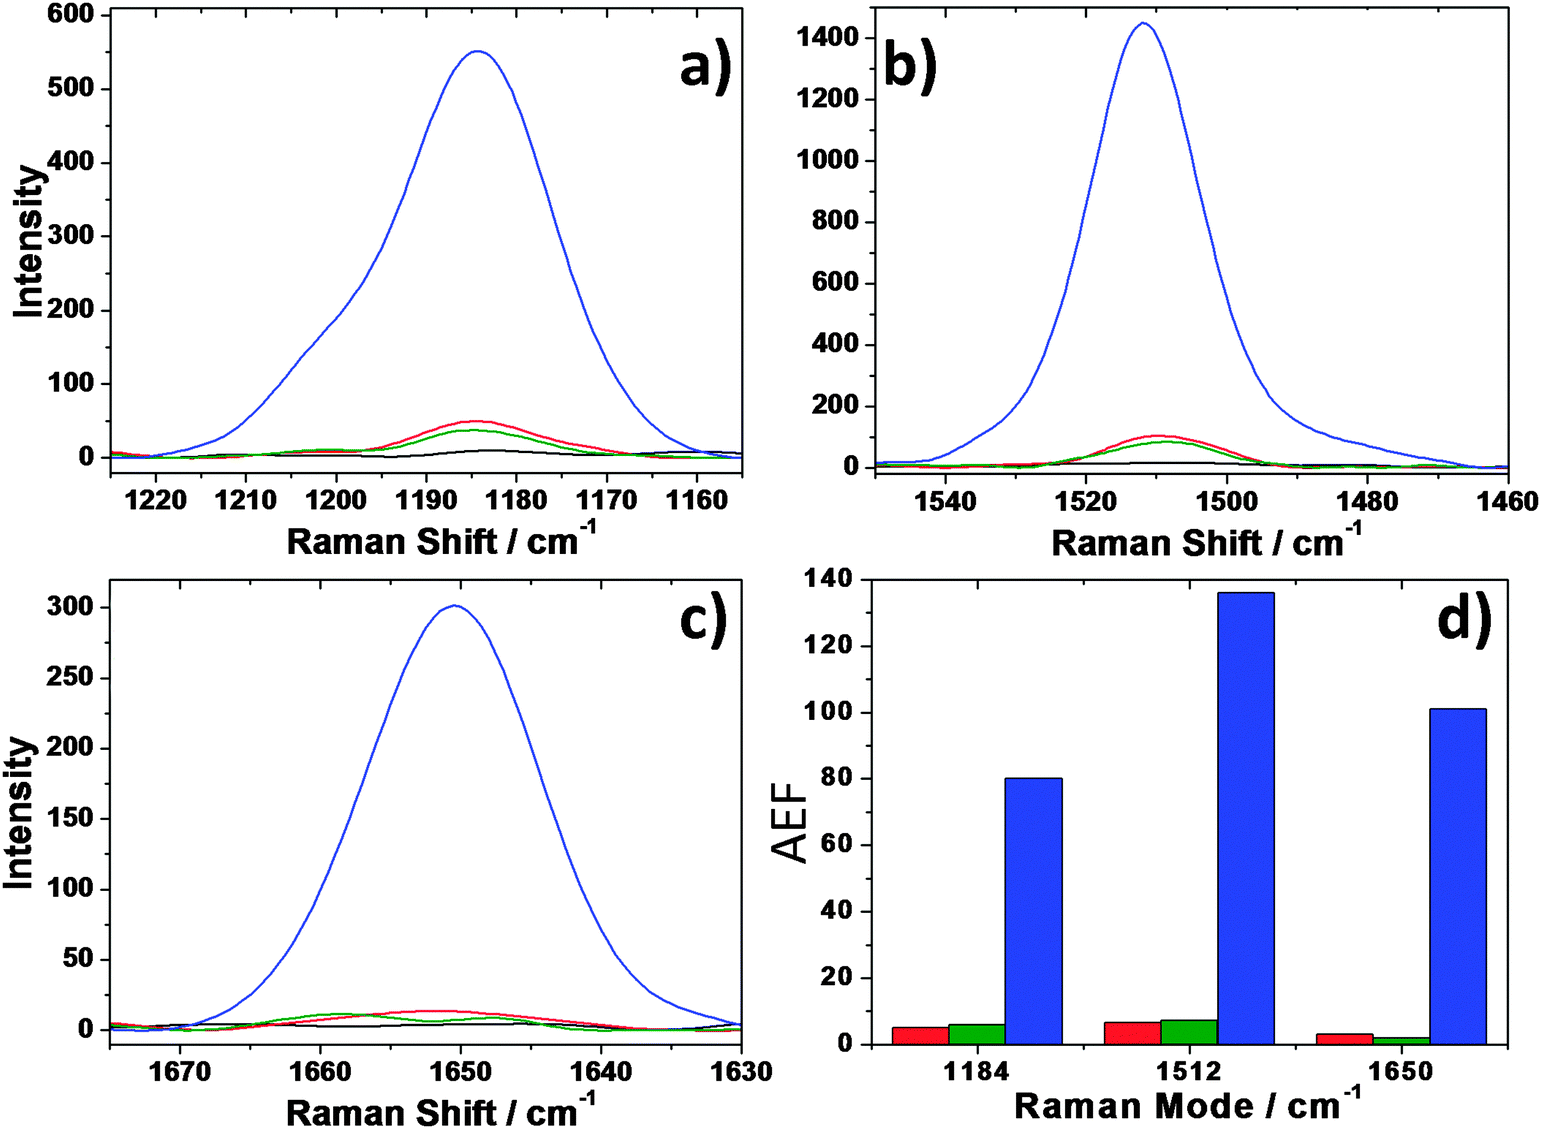 | ||
| Fig. 8 SERS enhancement of rhodamine 6G deposited on different mesoporous nanocomposite matrices relative to the 3 Raman modes centred at 1184 cm−1 (a), 1512 cm−1 (b) and 1650 cm−1 (c). Black line: Rh6G on mesoporous silica films; red line: Rh6G on mesoporous silica films containing exfoliated graphene; green line: Rh6G on mesoporous silica films containing gold nanoparticles; blue line: Rh6G on mesoporous silica films containing both exfoliated graphene and gold nanoparticles. (d) Analytical enhancement factors (AEF) as measured from the 3 Raman modes of Rh6G deposited on different mesoporous nanocomposite matrices. Red bars: mesoporous silica films containing exfoliated graphene; green bars: mesoporous silica films containing gold nanoparticles; blue bars: mesoporous silica films containing both exfoliated graphene and gold nanoparticles. | ||
Fig. 8d shows clearly that Raman scattering of Rh6G is poorly enhanced by the silica mesoporous films containing either graphene (red bars) or gold (green bars) that reach a maximum AEF equal to 6 for gold-embedded films measured at 1512 cm−1. On the other hand, the combined incorporation of gold nanoparticles and graphene nanosheets (blue bars) boosts the AEF in all the Raman modes ranging from an 80-fold increase of the signal at 1184 cm−1 to a 101-fold increase at 1650 cm−1 and 136-fold increase at 1512 cm−1. The AEF factor differs from each band, this is a side effect due to the amplification of the signal; some bands, in fact, appear formed by at least two overlapped components such as the band at 1184 cm−1, or even three in the signal at 1512 cm−1. The uncertainty in the determination of the number of overlapped modes does not allow a proper deconvolution of the spectra; at least the band at 1650 cm−1 has, however, a well-defined Gaussian shape which indicates that only one component can be associated with this signal.
Although the phenomenon of enhanced Raman scattering is not yet fully understood it is commonly accepted that it relies on two types of mechanisms: the electromagnetic mechanism (EM) and the chemical mechanism (CM).29 While the surface ERS seems to be influenced mostly by the EM and very little by the CM, on the opposite, as it resulted from some recent study, the graphene-mediated ERS seems to be almost completely controlled by the CM.30
The EM mechanism controls the ERS in gold-embedded mesoporous silica films, however, the amount of gold nanoparticles responsible for the amplification is not sufficient to show a significant enhancement of the Raman signal. In fact, the one-pot route used in the present work does not allow a controlled positioning of the nanoparticles (in the pore walls or onto the pore surface) and therefore a certain number of nanoparticles do not contribute to the SERS because these nanoparticles are buried in between the pore walls and cannot directly interact with the Raman probe (Rh6G).
In contrast, the graphene-mediated ERS relies solely upon the CM, which is accountable for lower EF when compared to the EM. Moreover, the AEF shown by the graphene composite material can be explained by the fact that the graphene nanosheets incorporated into the mesoporous matrix are in the form of bi-layer graphene. In fact, this type of nanosheets, when compared to single-layer graphene, can give a lower graphene-mediated ERS which can be even lower than the reference signal as in the case of highly organised pyrolitic graphite (HOPG). This evidence is also in agreement with the work reported by Ling et al.,30 where the intensities of the Raman signals decrease with the growing number of graphene layers.
The very interesting results obtained by the combined and synergistic effect of the gold nanoparticles and graphene nanosheets give rise to the so-called graphene-mediated surface enhanced Raman scattering (G-SERS) that, in our case, has been capable to boost the AEF by 136-fold. This can be due to the capability of the graphene layer to act as a multifunctional SERS mediator such as a spacer to avoid contact between the metal and molecules and as a stabiliser for both the substrate and the molecule to prevent damage upon laser exposure.31 These graphene properties improve upon the incorporation into mesoporous silica films taking advantage of the high surface area; this facilitates the diffusion of the Raman probe inside the matrix and the interaction with the metal nanoparticles responsible for the SERS effect minimising the loss of signal due to particle-to-particle contact.
Conclusions
Mesoporous ordered silica films containing bilayered graphene and gold nanoparticles have been synthesised through a one-pot route. The self-assembly process, which leads to mesoporous 2D hexagonal ordered films, is not affected by the addition of graphene to 1-N-vinyl-2-pyrrolidone. Gold nanoparticles with an average size of around 6 nm can be thermally grown in situ with preferential nucleation on the graphene surface. The synergistic effect of both graphene nanosheets and gold nanoparticles gives a very specific response to Raman scattering, defined as graphene-mediated surface-enhanced Raman scattering. The analytical enhancement factor (AEF) associated with the composite outclassed both the amplification of the Raman signal associated with the presence of only bilayered graphene nanosheets (GERS) or gold nanoparticles (SERS). Using rhodamine 6G as a molecular probe an AEF factor of 136 has been obtained.Acknowledgements
The Sardinian Regional Government (RAS) is kindly acknowledged for funding D. Carboni through P.O.R. SARDEGNA F.S.E. 2007–2013 – Obiettivo competitività regionale e occupazione, Asse IV Capitale umano, Linea di Attività l.3.1. The RAS is also acknowledged for funding this research through CRP 26449 P.O.R. FSE 2007–2013 L.R.7/2007.References
- K. S. Novoselov, A. K. Geim, S. V. Morozov, D. Jiang, Y. Zhang, S. V. Dubonos, I. V. Grigorieva and A. A. Firsov, Science, 2004, 306, 666 CrossRef CAS PubMed; A. K. Geim and K. S. Novoselov, Nat. Mater., 2007, 6, 183 CrossRef PubMed; R. F. Service, Science, 2009, 324, 875 CrossRef PubMed; A. K. Geim, Science, 2009, 324, 1530 CrossRef PubMed.
- G. Xiong, C. Meng, R. G. Reifenberger, P. P. Irazoqui and T. S. Fisher, Electroanalysis, 2013, 26, 30 CrossRef.
- X. Deng, H. Tang and J. Jiang, Anal. Bioanal. Chem., 2014 DOI:10.1007/s00216-014-7895-4 , ASAP.
- J. Zhang, L. Song, Z. Zhang, N. Chen and L. Qu, Small, 2014, 10, 2151 CrossRef CAS PubMed.
- X. Ling, L. Xie, Y. Fang, H. Xu, H. Zhang, J. Kong, M. S. Dresselhaus, J. Zhang and Z. Liu, Nano Lett., 2010, 10, 553 CrossRef CAS PubMed; S. Huh, J. Park, Y. S. Kim, K. S. Kim, B. H. Hong and J.-M. Nam, ACS Nano, 2011, 5, 9799 CrossRef PubMed; F. Yaghobian, T. Korn and C. Schüller, ChemPhysChem, 2012, 13, 4271 CrossRef PubMed.
- S. Schlücker, Angew. Chem., Int. Ed., 2014, 53, 4756 CrossRef PubMed.
- J. Lee, S. Shim, B. Kim and H. S. Shin, Chem. – Eur. J., 2011, 17, 2381 CrossRef CAS PubMed; W. Xu, X. Ling, J. Xiao, M. S. Dresselhaus, J. Kong, H. Xu, Z. Liu and J. Zhang, Proc. Natl. Acad. Sci. U. S. A., 2012, 109, 9281 CrossRef PubMed; W. Xu, J. Xiao, Y. Chen, Y. Chen, X. Ling and J. Zhang, Adv. Mater., 2013, 25, 928 CrossRef PubMed.
- Y. Zhao, Y. Xie, Z. Bao, Y. H. Tsang, L. Xie and Y. Chai, J. Phys. Chem. C, 2014, 118, 11827 CAS.
- P. Innocenzi, L. Malfatti and T. Kidchob, Chem. Mater., 2009, 21, 2555 CrossRef CAS; P. Innocenzi and L. Malfatti, Chem. Soc. Rev., 2013, 42, 4198 RSC.
- L. Malfatti, D. Marongiu, S. Costacurta, P. Falcaro, H. Amenitsch, B. Marmiroli, G. Grenci, M. F. Casula and P. Innocenzi, Chem. Mater., 2010, 22, 2132 CrossRef CAS; A. Pinna, B. Lasio, M. Piccinini, B. Marmiroli, H. Amenitsch, P. Falcaro, Y. Tokudome, L. Malfatti and P. Innocenzi, ACS Appl. Mater. Interfaces, 2013, 5, 3168 Search PubMed.
- L. Malfatti, P. Falcaro, B. Marmiroli, H. Amenitsch, M. Piccinini, A. Falqui and P. Innocenzi, Nanoscale, 2011, 3, 3760 RSC.
- S. Yang and X. Luo, Nanoscale, 2014, 6, 4438 RSC.
- S. Mura, G. Greppi, P. Innocenzi, M. Piccinini, C. Figus, M. L. Marongiu, C. Guo and J. Irudayaraj, J. Raman Spectrosc., 2013, 44, 35 CrossRef CAS.
- A. Wolosiuk, N. G. Tognalli, E. D. Martínez, M. Granada, M. C. Fuertes, H. Troiani, S. A. Bilmes, A. Fainstein and G. J. A. A. Soler-Illia, ACS Appl. Mater. Interfaces, 2014, 6, 5263 CAS.
- L. Malfatti, P. Falcaro, A. Pinna, B. Lasio, M. F. Casula, D. Loche, A. Falqui, B. Marmiroli, H. Amenitsch, R. Sanna, A. Mariani and P. Innocenzi, ACS Appl. Mater. Interfaces, 2014, 6, 795 CAS.
- P. Innocenzi, L. Malfatti, B. Lasio, A. Pinna, D. Loche, M. F. Casula, V. Alzari and A. Mariani, New J. Chem., 2014, 38, 3777 RSC.
- The Rietveld Method, ed. R. A. Young, University Press, Oxford, UK, 1993 Search PubMed.
- L. Lutterotti and S. Gialanella, Acta Mater., 1998, 46, 101 CrossRef CAS.
- D. Nuvoli, L. Valentini, V. Alzari, S. Scognamillo, S. Bittolo Bon, M. Piccinini, J. Illescas and A. Mariani, J. Mater. Chem., 2011, 21, 3428 RSC.
- Y. T. Liang, B. K. Vijayan, K. A. Gray and M. C. Hersam, Nano Lett., 2011, 11, 2865 CrossRef CAS PubMed.
- L. Malfatti, T. Kidchob, P. Falcaro, S. Costacurta, M. Piccinini, M. Cestelli Guidi, A. Marcelli, A. Corrias, M. F. Casula, H. Amenitsch and P. Innocenzi, Microporous Mesoporous Mater., 2007, 103, 113 CrossRef CAS PubMed.
- P. Innocenzi, J. Non-Cryst. Solids, 2003, 316, 309 CrossRef CAS.
- A. Zürner, J. Kirstein, M. Döblinger, C. Bräuchle and T. Bein, Nature, 2007, 450, 705 CrossRef PubMed.
- A. C. Ferrari, J. C. Meyer, V. Scardaci, C. Casiraghi, M. Lazzeri, F. Mauri, S. Piscanec, D. Jiang, K. S. Novoselov, S. Roth and A. K. Geim, Phys. Rev. Lett., 2006, 97, 187401 CrossRef CAS; L. M. Malard, M. A. Pimenta, G. Dresselhaus and M. S. Dresselhaus, Phys. Rep., 2009, 473, 51 CrossRef PubMed.
- M. Majoube and M. Henrya, Spectrochim. Acta, Part A, 1991, 47, 1459 CrossRef.
- A. G. Kalampounias, S. N. Yannopoulos and G. N. Papatheodorou, J. Non-Cryst. Solids, 2006, 352, 4619 CrossRef CAS PubMed.
- E. C. Le Ru, E. Blackie and M. Meyer, J. Phys. Chem. C, 2007, 111, 13794 Search PubMed; Y. Fang, N.-H. Seong and D. D. Dlott, Science, 2008, 321, 388 CrossRef CAS PubMed; E. J. Smythe, M. D. Dickey, J. Bao and G. M. Whitesides, Nano Lett., 2009, 9, 1132 CrossRef PubMed; S. Huh, J. Park, Y. S. Kim, K. S. Kim, B. H. Hong and J.-M. Nam, ACS Nano, 2011, 5, 9799 CrossRef PubMed.
- E. C. Le Ru, E. Blackie and M. Meyer, J. Phys. Chem. C, 2007, 111, 13794 CAS.
- A. Campion and P. Kambhampati, Chem. Soc. Rev., 1998, 27, 241 RSC.
- X. Ling, L. Xie, Y. Fang, H. Xu, H. Zhang, J. Kong, M. S. Dresselhaus, J. Zhang and Z. Liu, Nano Lett., 2010, 10, 553 CrossRef CAS PubMed.
- W. Xu, X. Ling, J. Xiao, M. S. Dresselhaus, J. Kong, H. Xu, Z. Liu and J. Zhang, Proc. Natl. Acad. Sci. U. S. A., 2012, 109, 9281 CrossRef CAS PubMed.
Footnote |
| † Electronic supplementary information (ESI) available. See DOI: 10.1039/c4cp03582h |
| This journal is © the Owner Societies 2014 |