 Open Access Article
Creative Commons Attribution 3.0 Unported Licence
Monitoring the reversible photoisomerization of an azobenzene-functionalized molecular triazatriangulene platform on Au(111) by IRRAS†
Hanne
Jacob
a,
Sandra
Ulrich
b,
Ulrich
Jung
c,
Sonja
Lemke
c,
Talina
Rusch
c,
Christian
Schütt
b,
Finn
Petersen
a,
Thomas
Strunskus
d,
Olaf
Magnussen
c,
Rainer
Herges
*b and
Felix
Tuczek
*a
aInstitut für Anorganische Chemie, Christian-Albrechts-Universität Kiel, Max-Eyth-Str. 2, 24118 Kiel, Germany. E-mail: ftuczek@ac.uni-kiel.de
bInstitut für Organische Chemie, Christian-Albrechts-Universität Kiel, Otto-Hahn-Platz 4, 24098 Kiel, Germany. E-mail: rherges@oc.uni-kiel.de
cInstitut für Experimentelle und Angewandte Physik der Christian-Albrechts-Universität Kiel, Leibnizstraße 11-19, 24118 Kiel, Germany
dTechnische Fakultät der Christian-Albrechts-Universität Kiel, Kaiserstraße 2, 24143 Kiel, Germany
First published on 17th September 2014
Abstract
Spectroscopic evidence of a reversible, photoinduced trans ↔ cis photoisomerization is provided for an azobenzene-functionalized triazatriangulene (TATA) platform on Au(111). As shown by scanning tunneling microscopy (STM) and X-ray photoelectron spectroscopy (XPS), these molecules form a well-ordered self-assembled monolayer (SAM) on Au(111). The surface-adsorbed azo-TATA platforms are also investigated by infrared reflection absorption spectroscopy (IRRAS); a methoxy marker group at the upper phenyl ring of the azo moiety is employed to monitor the switching state. The IRRAS data are analyzed by comparison with theoretical and transmission IR spectra as well as bulk and surface-enhanced Raman spectroscopic (SERS) data. IRRAS shows that the methoxy group is oriented perpendicular to the surface in trans- and tilted with respect to the surface normal in cis-configuration. This indicates that the photoswitching capability of the azobenzene moieties is retained on the gold surface. The lifetime of the cis-configuration is, however, reduced by a factor of ∼103 with respect to the homogeneous solution.
Introduction
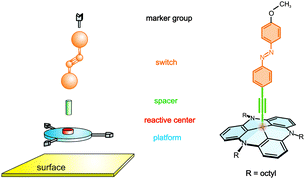
The functionalization of surfaces with monolayers of switchable molecules is both of fundamental importance and of significant interest with respect to applications as in data storage, sensors, and molecular electronics.1,2 While azobenzenes are a class of well investigated molecular switches exhibiting reversible cis–trans photoisomerization in homogeneous solution,3,4 switching of these molecules in monolayers on metal surfaces is more intricate. The main problems that arise are as follows: (i) azobenzene-modified alkylthiols form highly-packed monolayers, therefore the switching process may be sterically hindered;5 (ii) electronic coupling to the metal surface can efficiently quench the excited state;6–9 the lifetime of the photo-switched isomer thus may be short and the quantum yield of isomerization may be small. Triazatriangulene (TATA) platforms, in contrast, both reduce the electronic coupling with the surface and control the distance of the switchable units from each other as a function of the size of the side chains at the platforms.10 Moreover, the bare TATA cation as well as the azobenzene-functionalized TATA molecules form well-ordered and stable hexagonal monolayers on Au(111) surfaces with commensurate lattice constants.11 The “platform approach” is thus a suitable method to prepare self-assembled monolayers of functional molecules on, e.g., gold with control of intermolecular distances (Fig. 1).Here we present spectroscopic proof that our approach allows the deposition of well-defined SAMs of azobenzenes on Au(111) that retain their photoswitching capability. In previous publications we investigated the switching behaviour of functionalized TATA molecules on gold surfaces by means of electrochemistry and surface plasmon spectroscopy.12,13 Whereas the half-life of the thermal back-isomerization of the azobenzene unit from cis to trans is about 20 hours in solution, cyclic voltammetric measurements on the surface indicated half-lives that are shorter by 4–5 orders of magnitude. As a possible explanation for this finding an influence of the surface on the switching process was invoked.12 To further address this issue, we synthesized (E)-12c-[4-(4-methoxyphenyldiazenyl)-phenyl]ethynyl-4,8,12-tri-n-octyl-4,8,12-triazatriangulene (“methoxy-azo-TATA”), an azobenzene-TATA with a methoxy group in the para position to the azobenzene unit.14 Herein this molecule is investigated in solution by NMR and UV/Vis spectroscopy as well as adsorbed on a gold surface by STM, XPS and (PM-) IRRAS. The methoxy group is used as a spectroscopic marker to monitor the switching process on the Au surface. Based on an upright position of the azo group and the surface selection rule, the C(phenyl)–O stretching vibration in the IRRAS experiment exhibits a higher intensity in the trans as compared to the cis configuration of the azo group. The implications of our findings on the preparation of switchable monolayers on surfaces based on the platform concept are discussed.
Results and analysis
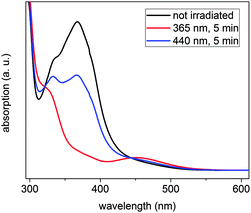
The switching behaviour of (E)-12c-[4-(4-methoxyphenyldiazenyl)-phenyl]ethynyl-4,8,12-tri-n-octyl-4,8,12-triazatriangulene (“meth-oxy-azo-TATA”) was first investigated by UV/Vis- and NMR spectroscopy in solution. Upon irradiation with UV light (365 nm) the trans isomer switches to the cis isomer.This can be monitored in the UV/Vis spectra by a decreasing intensity of the π → π* band at 333 nm and 368 nm and an increasing intensity of the n → π* band at 451 nm (Fig. 2). Furthermore, new sets of signals appear in the NMR spectra, which can be assigned to the cis isomer (Fig. 3).
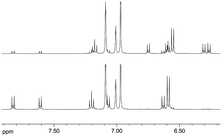 | ||
| Fig. 3 Aromatic region of the 1H-NMR spectra of methoxy-azo-TATA in trans (bottom) and after irradiation with UV light (365 nm) in cis (top) configuration in toluene under ambient conditions. | ||
Reisomerization from cis to trans either occurs thermally or can be initiated by irradiation with blue light (440 nm); this process has also been followed by UV/Vis and NMR spectroscopy. The maximum cis concentration was determined by comparing the integrals of specific 1H-NMR signals, and the half-life of the cis configuration under ambient conditions was obtained by following the decrease of the cis signals after irradiation for several days. The maximum cis concentration (74%) after irradiation with UV light (365 nm) of methoxy-azo-TATA is in good agreement with other azobenzene-functionalized TATA platforms,14 and thermal back-isomerization follows a first-order rate law with a half-life of 920 min (cf.Fig. 4).
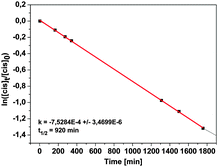 | ||
| Fig. 4 Plot of the natural logarithm of the cis concentration as a function of time to determine the half-life of methoxy-azo-TATA in toluene. | ||
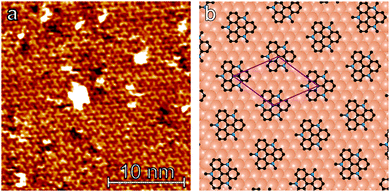
Having demonstrated the reversible photoisomerization of the title compound in solution, its switching properties on a gold surface were investigated. STM measurements of methoxy-azo-TATA adlayers on Au(111) reveal a hexagonally ordered superstructure with intermolecular distances of 12.7 ± 0.5 Å (see Fig. 5a). Specifically, the lattice constants and the angles between different rotational domains are in agreement with a  superstructure (Fig. 5b), which was also found in previous STM studies of self-assembled adlayers based on octyl-TATA platforms, including those with vertically attached azobenzene units.10,11 The triangular shape of the observed molecules, clearly visible in the STM images, indicates a planar adsorption of the octyl-TATA platform unit and suggests an orientation of the methoxy-azo moiety perpendicular to the surface.
Chemical and structural information on a monolayer of methoxy-azo-TATA deposited on Au(111) was also obtained by X-ray photoelectron spectroscopy. The survey XP spectrum is dominated by the Au 4d and 4f core levels and furthermore exhibits, as expected, O 1s, N 1s and C 1s features (Fig. 6, left). The thickness of the adlayer was estimated from the ratios of the C 1s/Au 4f7/2 signals and a known reference substance (here dodecylthiol with a known thickness of 1.7 ± 0.1 nm)15 giving a value of 1.15 nm for methoxy-azo-TATA. Taking into account the lower packing density of this molecule on gold as compared to dodecylthiol SAMs this result indicates the presence of a complete monolayer of methoxy-azo-TATA on the Au(111) surface.
The C 1s spectrum (Fig. 6 middle) consists of three signals. The main peak centered at 284.5 eV is due to the aliphatic and aromatic C atoms of the platform and the azo group, the peak at 285.6 eV can be assigned to the C atoms directly connected to nitrogen atoms, and the C atoms directly connected to the oxygen atom correspond to the signal at 287.2 eV. The relative intensities of these three contributions (0.9 ± 0.03/0.09 ± 0.03/0.01 ± 0.01) deviate somewhat from the expected values (0.78/0.19/0.03). Whereas the discrepancy of the relative C(O) signal intensity can be attributed to the uncertainty of the fit procedure associated with the low oxygen content of methoxy-azo-TATA, the deviation of the relative C(N) signal intensity from the expected value (found 0.09/calc. 0.19) is outside the experimental error. A similar discrepancy is found when comparing the intensity of the N 1s signal at 400 eV (Fig. 6 right) to the total C 1s signal intensity (found: 0.05 ± 0.02/1; calc. 0.09/1). It should be mentioned, however, that these C/N ratios have been determined on the basis of a homogeneous surface layer.16 For the monolayer of methoxy-azo TATA on gold this condition is not met. The molecular monolayer rather consists of close-packed, horizontal TATA platforms directly on top of the metal surface (vide supra) carrying vertically oriented, laterally separated azo moieties. The assumption of a uniform photoelectron inelastic mean free path (IMFP)16 for such a strongly inhomogeneous arrangement is certainly problematic. Specifically, the octyl side chains of one platform may partly cover adjacent platforms such that the XPS signals of the platforms are attenuated with respect to the azo moieties and the octyl sidearms. As the platforms have a higher nitrogen content than the other constituents of the methoxy-azo-TATA molecule, the N/C values are systematically underestimated in the presented analysis of the XPS data. The actual attenuation of the XPS signals associated with the C- and N-atoms of the platform is, however, difficult to assess.
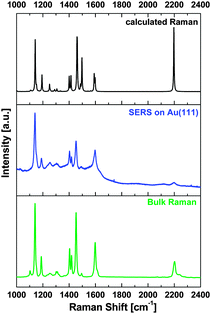
Having characterized the structure and the composition of the monolayer of methoxy-azo-TATA on gold by STM and XPS, this system was then investigated by vibrational spectroscopy. First, gap-mode surface-enhanced Raman spectroscopy (SERS) was employed.17–20 As shown in Fig. 7, the SERS data closely correspond to the bulk Raman spectrum of methoxy-azo-TATA on the one hand and the calculated Raman spectrum of methoxy-azo-benzene on the other. Furthermore, the SERS spectra of methoxy-azo-TATA are in good agreement with those of our previous study performed on a series of azobenzene-functionalized TATA adlayers on Au(111).21a
To interpret the experimental SERS data density functional theory calculations on methoxy-azo-TATA were performed. Octyl side chains were replaced by propyl to save computational costs (see Experimental section). The theoretical Raman spectrum derived from this calculation together with a previous study21a allows a complete assignment of the spectral peaks, as presented in the ESI† (Table S2).
In the range between 1100 and 1650 cm−1 the spectra mainly consist of valence vibrations of the aromatic rings constituting the azobenzene moiety. The two intense peaks below 1200 cm−1 have contributions from C–N stretching motions whereas those in the range between 1400 and 1500 cm−1 have contributions from the N![[double bond, length as m-dash]](https://www.rsc.org/images/entities/char_e001.gif) N unit as well as aromatic in plane C–H bending and CH3O bending vibrations. The C–C stretch of the ethynyl group is observed at 2220 cm−1. Contributions from other molecular constituents are much less pronounced; in particular, the TATA platform exhibits a much smaller Raman scattering cross section than azobenzene.21a Nevertheless, as found by DFT most of the peaks between 450 and 1650 cm−1 have small contributions from this group.
N unit as well as aromatic in plane C–H bending and CH3O bending vibrations. The C–C stretch of the ethynyl group is observed at 2220 cm−1. Contributions from other molecular constituents are much less pronounced; in particular, the TATA platform exhibits a much smaller Raman scattering cross section than azobenzene.21a Nevertheless, as found by DFT most of the peaks between 450 and 1650 cm−1 have small contributions from this group.
Complementing the vibrational information from SERS, the surface-adsorbed methoxy-azo-TATA platform was also investigated by infrared absorption-reflection spectroscopy (IRRAS). Through the surface selection rule this technique also provides specific information about the orientation of the adsorbed molecules with respect to the surface. In order to assign the vibrational bands bulk IR data were recorded as well, and theoretical spectra were generated from DFT based on the same optimized structure of methoxy-azo-TATA as that employed for SERS (vide supra). Theoretical, bulk and surface vibrational spectra are given in Fig. 8 for the high-frequency vibrations (left) and for the fingerprint region (right). Scaling of the calculated frequencies has been performed in analogy to the theoretical Raman spectrum (cf. Experimental). Comparison of the surface and bulk data on one hand with predictions from DFT on the other hand allows a detailed assignment of the observed vibrations; the numbering of the bands refers to the DFT calculation comprising all normal modes of the molecule (cf. Table S3, ESI†).
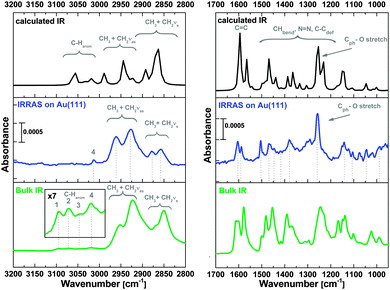 | ||
| Fig. 8 IR data of methoxy-azo-TATA. Left: CH-stretching vibration region, right: fingerprint region. The spectra in the top panels show the calculated, the spectra in the middle in blue the IRRAS of the surface-adsorbed monolayer and the green spectra at the bottom the bulk data. Band numbers correspond to Table S3 (ESI†). | ||
At around 3000 cm−1 the calculated bulk spectrum (Fig. 8 left top) exhibits a number of bands, which mostly derive from C–H stretching vibrations of the phenyl units constituting the TATA platform, the phenyl rings of the azo unit and C–H stretching vibrations of the alkyl side chains (cf. Table S3, ESI†). In the region of aliphatic C–H stretching vibrations, the experimental bulk spectrum of methoxy-azo-TATA exhibits four broad features at ∼2950 cm−1, ∼2920 cm−1, ∼2870 cm−1 and ∼2850 cm−1 (Fig. 8 left bottom). The shoulder at 2950 cm−1 can be assigned to asymmetric CH3 stretching vibrations of the aliphatic side chains and the CH3 group on top of the azo unit. The most intense feature at 2920 cm−1 corresponds to asymmetric CH2 stretching vibrations from the alkyl side chains of the TATA platform, the shoulder at 2870 cm−1 probably corresponds to the symmetric CH3 stretching vibrations of the alkyl side chains, and the more intense feature at 2850 cm−1 is associated with symmetric CH2 stretching vibrations. All of these features are also observed with slightly different intensities in the IRRA spectrum (Fig. 8 left middle).
Above 3000 cm−1 the bulk spectrum shows four additional bands which, in contrast to the theoretical prediction, are much weaker than the bands below 3000 cm−1 (Fig. 8 left bottom). The bands at 3094 cm−1 (band 1) and 3071 cm−1 (band 2) can be assigned to aromatic C–H stretching vibrations from the TATA-platform whereas two bands at 3044 cm−1 (band 3) and 3019 cm−1 (band 4) can be attributed to a C–H stretch of the phenyl ring connected to the platform and another aromatic C–H stretch from the TATA platform, respectively. In IRRAS most of these bands are absent except one small peak at 3017 cm−1. Assignment to an aromatic C–H stretch of the platform (peak 4) would at first appear incompatible with the surface selection rule; however, closer inspection shows that the transition dipole moment (TDM) of this vibration makes an angle of 45° with respect to the surface.
The “fingerprint” region ranging from ∼1700 to 1000 cm−1 is shown in the right panel of Fig. 8. At around 1600 cm−1 three vibrations of C![[double bond, length as m-dash]](https://www.rsc.org/images/entities/char_e001.gif) C character appear which also include C
C character appear which also include C![[double bond, length as m-dash]](https://www.rsc.org/images/entities/char_e001.gif) C vibrations of the azo phenyl groups and correspondingly are visible in the IRRA spectrum (see also Fig. S1, ESI†). Between 1500 and 1300 cm−1 C–H bending vibrations of the methoxy group, the N
C vibrations of the azo phenyl groups and correspondingly are visible in the IRRA spectrum (see also Fig. S1, ESI†). Between 1500 and 1300 cm−1 C–H bending vibrations of the methoxy group, the N![[double bond, length as m-dash]](https://www.rsc.org/images/entities/char_e001.gif) N stretching vibration and C–C ring deformations from the azo group are located. At 1260 cm−1 the C(phenyl)–O(Me) stretch of the methoxy group is observed. Importantly, this is by far the most intense peak in the IRRA spectrum (Fig. 8 right middle), thus proving that the methoxy-azo unit in azo-functionalized TATA platforms is in fact oriented perpendicular to the surface. The remaining bands, in particular below 1200 cm−1, can mostly be attributed to C–H bending vibrations (cf. Table S3 and Fig. S1, ESI†).
N stretching vibration and C–C ring deformations from the azo group are located. At 1260 cm−1 the C(phenyl)–O(Me) stretch of the methoxy group is observed. Importantly, this is by far the most intense peak in the IRRA spectrum (Fig. 8 right middle), thus proving that the methoxy-azo unit in azo-functionalized TATA platforms is in fact oriented perpendicular to the surface. The remaining bands, in particular below 1200 cm−1, can mostly be attributed to C–H bending vibrations (cf. Table S3 and Fig. S1, ESI†).
Having determined the vibrational properties of the methoxy-azo functionalized TATA platforms on gold, these systems were finally subjected to switching experiments. To investigate the cis–trans isomerization of the azobenzene unit by IRRAS, the intensity change of the most intense C(phenyl)–O(Me) stretching vibration occurring upon photoirradiation was monitored. Based on the surface selection rule the intensity of this vibrational band should be correlated with the trans or cis configuration of the azo group, as shown in Fig. 9. Due to the upright orientation of the methoxy group (vide supra), the C(phenyl)–O(Me) transition dipole moment (TDM) is nearly perpendicular to the surface plane in the trans configuration. In the cis configuration, on the other hand, the TDM makes an angle of 30° with respect to the surface. By switching the molecule to the cis isomer, the intensity of the C–O stretching band thus should decrease by 75% in the IRRA spectrum.
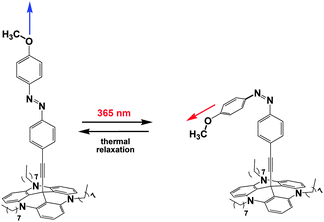 | ||
| Fig. 9 Different orientations of the transition dipole moment of the C–O stretching vibration in trans and cis conformation. | ||
In order to rapidly detect a switching process after optical excitation, PM-IRRAS was employed.22,23 A special illumination unit was constructed and inserted into the PM-IRRAS sample chamber to directly irradiate the samples on the sample holder and immediately start the IRRAS measurement after irradiation. Additional advantages of the PM-IRRAS technique over conventional IRRAS are that no background measurements are necessary, atmospheric disturbances are absent and scan times are much shorter. However, treatment of the experimental data is more complicated as a Bessel-type background has to be subtracted.24 All irradiation spectra were recorded with a resolution of 4 cm−1. For an analysis of the C(phenyl)–O(Me) stretching vibration the PM maximum efficiency was set for the half-wave retardation at 1800 cm−1 with a sensitivity of 100 mV (gain factor 10).
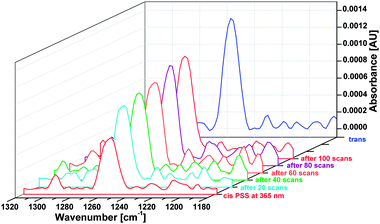
The results of the switching experiments are shown in Fig. 10. Upon continuous irradiation with 365 nm the intensity of the C(phenyl)–O(Me) peak drops from a value of 0.0013 to 0.006, corresponding to a reduction of 54% and a transition to the cis configuration. Subsequent measurements in time intervals of 15 s (20 scans) after switching the LED off revealed an exponential increase of the peak corresponding to a thermal backrelaxation of cis to trans (cf. Fig. S2, ESI†).
The spectra obtained over 20 scans shown in Fig. 10 result from summing up of 10 individual runs. A logarithmic intensity vs. scan time plot (cf.Fig. 11) gives a monoexponential decay with a half-life of 42 ± 10 seconds for the photoinduced cis state of the TATA platform on Au(111), about 3 orders of magnitude smaller than in solution.
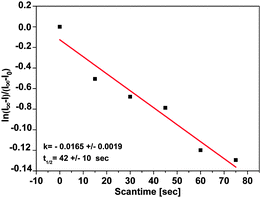 | ||
| Fig. 11 Plot of ln[(I∞ − I)/(I∞ − I0)] vs. time, showing a monoexponential decay of cis to trans with a half-life of 42 ± 10 s. | ||
Discussion and conclusions
In the preceding sections surface-analytical and -spectroscopic investigations on an azobenzene functionalized TATA platform have been presented. The switching behavior of methoxy-azo-TATA was analyzed in solution by using UV spectroscopy and NMR. Moreover, the molecules were adsorbed on Au(111) surfaces. XPS and STM measurements indicate that the adsorbed molecules are intact and form well-ordered monolayers. Vibrational-spectroscopic data of the adlayers on Au(111) were obtained using SERS and IRRAS and interpreted with the help of DFT. The dominant intensity of the C(phenyl)–O (Me) stretch in the IRRA spectrum shows that the azobenzene moieties attached to the TATA platform are in the trans configuration. The absolute intensity of this peak in the IRRA spectrum conforms to the surface coverage determined for the TATA platforms.11 IRRA spectra of a SAM of an alkoxy-azobenzene-terminated alkanethiol give an intensity of the C(phenyl)–O (Me) stretch of about 0.01.25 From STM data it is known that the area per molecule is 137 Å2 for 8-TATA derivatives.21a On the other hand, the area per molecule was determined to be 25.2 Å2 for pure SAMs of azobenzene-containing molecules with amide–thiol functions and 30.4 Å2 for pure SAMs of azobenzene-containing molecules with ether–thiol functions.21b This indicates that the surface coverage of methoxy-azo-TATAs is about 1/5 compared to a SAM of corresponding linear azobenzene-containing thiols and would correspond to an absolute IRRAS intensity of 0.020 for the C(phenyl)–O (Me) stretch of a monolayer of methoxy-azo-TATA molecules. Our experimentally obtained value is 0.010–0.020, depending upon the sample, in good agreement with this estimate.By PM-IRRAS it was demonstrated that the azobenzene unit attached on the TATA platforms can reversibly be switched from the trans to the cis configuration. For these experiments the C(phenyl)–O(Me) stretching vibration from the headgroup of the azo functionalized platform molecule has been employed. The transition dipole moment (TDM) in the trans configuration is nearly perpendicular to the surface whereas in the cis configuration it makes an angle of 30° with respect to the surface. The corresponding intensity reduction (theoretically 75%) is experimentally found to be somewhat smaller (55%). The origin of this discrepancy is not entirely clear; however, in a spectroscopic investigation of another azobenzene-functionalized self-assembled monolayer (SAM) a comparable intensity change upon trans-to-cis isomerization has been found.26
Importantly, the present study contributes another case to the – so far – very limited number of studies where spectroscopic evidence for a reversible photoisomerization in a monolayer on a metal surface has been obtained. Apart from the mentioned trans ↔ cis isomerization of an azobenzene-functionalized self-assembled monolayer (SAM) on Au(111) the photoisomerization of a spiropyran on gold has been monitored by sum-frequency generation (SFG) vibrational spectroscopy.26,27 HREELS has been employed to detect the photoswitching of tert-butyl azobenzene on Au.28 Furthermore, reversible photoswitchability was observed for azo-functionalized SAMs by ellipsometry and dynamic contact angle measurements.29 In one case IRRAS has been used to detect a trans–cis isomerization in a molecular adlayer.25
An interesting result of the present investigation is the rapid thermal relaxation of the cis-azobenzene moieties back to the trans configuration, which is found to proceed with a half-life of 42 ± 10 s. Notably, within the experimental error, this agrees with the thermal half-life of the photoexcited cis-state determined for an azobenzene-functionalized TATA platform on gold by surface-plasmon spectroscopy (time constant τ = 54.0 ± 9.9 s;12i.e., t1/2 = 37.4 ± 6.8 s) and corresponds to a decrease of the half-life by a factor of ∼103 with respect to the homogeneous solution (t1/2 = 920 min).
Possible origins of the enhanced cis → trans relaxation rate for surface-adsorbed, azobenzene-functionalized platforms have been considered in ref. 12. For molecules adsorbed on a metal surface, spin exchange with the electrons of the conduction band is possible. As found by DFT, highly delocalized molecular orbitals of the platform are located close to the Fermi energy of the gold substrate, mediating strong electronic coupling between the metal surface and the adsorbed molecule. This opens a new pathway for cis → trans backisomerization with a distinctively lowered energy barrier than in solution. To the best of our knowledge, the present study is the first example where such a thermal backrelaxation process after photoisomerization of a surface-adsorbed molecule has been evidenced by IRRAS.
Experimental
The synthesis of the triazatriangulenium (TATA) cation was performed by the procedure of Laursen and Krebs,30 and the azobenzene-functionalized TATA platforms methoxy-azo-TATA were synthesized as published by Kubitschke et al.14 NMR spectra were recorded using a Bruker DRX 500 (1H-NMR: 500 MHz, 13C-NMR: 125.8 MHz) spectrometer with toluene-d8 as solvent. UV spectra were measured in toluene with the UV/Vis spectrometer Perkin-Elmer Lambda 14. STM and XPS measurements were performed on Au(111) single crystals (MaTecK GmbH, Jülich, Germany). For gap-mode SERS17–20 (111)-oriented Au films (250 nm) with a Cr adhesion promotor (5 nm) on glass (“Arrandees” supplied by Dr D. Schroer, D-33824 Werther, Germany) were used. Glass substrates with a 50 Å titanium base layer and a 1000 Å evaporated gold film were purchased from EMF Corporation (Ithaca, NY) for IRRAS and PM-IRRAS measurements.All gold substrates were annealed in a butane gas flame, single crystals for five minutes and glass substrates with gold film for one minute. The monolayers were prepared by immersing the substrate into a solution of bare TATA molecules in ethanol (Merck, p.a.) at room temperature or functionalized derivatives in toluene (Merck, p.a.) at 80 °C for one hour. Afterwards, excess molecules were removed by immersing the substrates for 15 minutes at the same temperature as before in pure solvent. Finally, samples were removed from the solution and dried in the air.
In order to assign the peaks in the Raman and IRRA spectra to molecular vibrations, quantum chemical calculations were performed at the B3LYP/6-31++G(d,p)31,32 level of density functional theory (DFT) using Gaussian09.33 We corrected the calculated frequencies in such a way that they optimally match the experimental values. Consequently, after scaling with the equation 0.927·calc. wavenumber + 63.318 cm−1 we found very good agreement between theory and experiment. The octyl side chains were replaced by propyl side chains due to the fact that the corresponding vibrational modes are not important for the comparison between the experimental and the theoretical results as well as to save computational costs. The optimized geometry of methoxy-azo-TATA is given in Table S1 (ESI†).
XPS measurements were performed at the beamline HE-SGM of the synchrotron facility BESSY II using the PREVAC endstation. The experimental station is equipped with a hemispherical VG Scienta R3000 photoelectron analyzer. The energy resolution E/ΔE of the beamline with 150 μm slits is 800. XP survey spectra were acquired at 700 eV photon energy using an analyzer pass energy of 100 eV. For the C 1s and N 1s spectra the photon energy was 400 eV and 500 eV with pass energies of 20 eV and 50 eV, respectively. All spectra were acquired at normal electron emission. For quantitative comparison the spectra were corrected by the number of individual scans, the effective X-ray beam current, and the photoionization cross sections.34,35 Background correction was performed using a Shirley background for the Au 4f signals, a combination of a Shirley and a linear background for the C 1s signal and a linear background for all other signals. Peak fitting was performed using the program Fityk36 employing Voigt profiles.
Scanning Tunneling Microscopy (STM) measurements were performed in a PicoPlus SPM (Agilent, Inc., Santa Clara, USA) under ambient conditions, using mechanically cut Pt/Ir tips. Samples for gap-mode SERS measurements18–20,21a were prepared by immersion of the adlayer-modified substrates into aqueous gold colloid solutions (particle size of about 20 nm)37 for ∼48 h. Afterwards, the samples were dried in air. The gold colloid was prepared by reduction of HAuCl4 by sodium citrate. For Raman spectroscopic measurements two spectrometers were used: (i) a Dilor XY-Raman spectrometer (Horiba) with an Ar/Kr mixed gas laser (RM 2018, Spectra Physics) emitting at a wavelength of λex = 647.1 nm (Pex = 10 to 30 mW, size of laser spot on the sample: 0.5 mm × 1 mm); and (ii) an ISF66/FRA106 Fourier transform Raman spectrometer (Bruker AXS GmbH) with a Nd:YAG laser at a wavelength of λex = 1064 nm. All Raman spectroscopic measurements were carried out under ambient conditions.
Bulk IR spectra were recorded using a Bruker ATR FT-IR spectrometer in the range of 400 to 4000 cm−1 with a resolution of 4 cm−1. The surface adsorbed molecules were investigated by using a Bruker VERTEX 70 FT-IR spectrometer equipped with a Polarization Modulation Accessory (PMA) 50 unit (Bruker Optik GmbH, Ettlingen, Germany). This instrument allows recording of IRRAS and PM-IRRAS data with a spectral range from 4000 down to 800 cm−1. IRRAS data were collected with a liquid nitrogen cooled MCT detector in a horizontal reflection unit for grazing incidence (Bruker A518). The sample chamber was purged with dry nitrogen before and during measurements. A deuterated hexadecane–thiol SAM on Au(111) was used as a reference for the background spectrum for conventional IRRA spectra. Each spectrum contains 2048 averaged spectra. A p-polarized beam at an incident angle of 80° to the surface normal was used for measurements. All spectra were recorded with 4 cm−1 resolution. PM-IRRAS data were collected with the PMA 50 accessory using a liquid nitrogen-cooled MCT detector. The PEM maximum efficiency was set for the half-wave at 1800 cm−1 for analysis of the C–O stretching mode. All spectra were recorded at 4 cm−1 resolution.
Processing of IRRAS and PM-IRRAS data was carried out using the OPUS software Version 6.5 (Bruker, Germany). Baseline correction of the resulting IRRAS data was performed by the rubber band method in an interactive mode. PM-IRRAS data were processed by the implicit removal of the Bessel function through manual baseline correction.24
For the trans-to-cis isomerization of methoxy-azo-TATA the samples were irradiated using a LED (Nichia NC4U133(T), peak wavelength: 365 (±9) nm, 1 LEDs, power dissipation: 12 W, luminous flux: 10 lm, distance ∼5 cm).
Acknowledgements
The authors thank Deutsche Forschungsgemeinschaft (DFG) for funding of this research (SFB 677). We also want to thank Andreas Terfort (Frankfurt) for a gift of deuterated hexadecanethiol, Uschi Cornelissen for Raman measurements and Benjamin Sahlmann for providing the LED illumination unit used in the PM-IRRAS experiments. We further thank Christof Wöll (Karlsruhe) for providing the Prevac endstation and the HE-SGM CRG as well as the BESSY staff for technical support of the XPS measurements.Notes and references
- W. R. Browne and B. L. Feringa, Annu. Rev. Phys. Chem., 2009, 60, 407–428 CrossRef CAS PubMed.
- Y.-S. Fu, J. Schwböel, S.-W. Hla, A. Dilullo, G. Hoffmann, S. Klyatskaya, M. Ruben and R. Wiesendanger, Nano Lett., 2012, 12, 3931–3935 CrossRef CAS PubMed.
- S. Venkataramani, U. Jana, M. Dommaschk, F. D. Sönnichsen, F. Tuczek and R. Herges, Science, 2011, 331, 445–448 CrossRef CAS PubMed.
- S. Thies, H. Sell, C. Schuett, C. Bornholdt, C. Naether, F. Tuczek and R. Herges, J. Am. Chem. Soc., 2011, 133, 16243–16250 CrossRef CAS PubMed.
- R. Klajn, Pure Appl. Chem., 2010, 82, 2247–2279 CrossRef.
- R. J. Maurer and K. Reuter, Angew. Chem., 2012, 124, 12175–12177 CrossRef.
- M. J. Comstock, N. Levy, A. Kirakosian, J. Cho, F. Lauterwasser, J. H. Harvey, D. A. Strubbe, J. M. J. Fréchet, D. Trauner and S. G. Louie, et al. , Phys. Rev. Lett., 2007, 99, 038301 CrossRef PubMed.
- C. Bronner, G. Schulze, K. J. Franke, J. I. Pascual and P. Tegeder, J. Phys.: Condens. Matter, 2011, 23, 484005 CrossRef PubMed.
- P. Tegeder, J. Phys.: Condens. Matter, 2012, 24, 394001 CrossRef PubMed.
- B. Baisch, D. Raffa, U. Jung, O. Magnussen, C. Nicolas, J. Lacour, J. Kubitschke and R. Herges, J. Am. Chem. Soc., 2009, 131, 442–443 CrossRef CAS PubMed.
- S. Kuhn, B. Baisch, U. Jung, T. Johannsen, J. Kubitschke, R. Herges and M. Magnussen, Phys. Chem. Chem. Phys., 2010, 12, 4481–4487 RSC.
- U. Jung, C. Schütt, O. Filinova, J. Kubitschke, R. Herges and O. Magnussen, J. Phys. Chem. C, 2012, 116, 25943–25948 CAS.
- U. Jung, J. Kubitschke, R. Herges and O. Magnussen, Electrochim. Acta, 2013, 112, 869–880 CrossRef CAS.
- J. Kubitschke, C. Näther and R. Herges, Eur. J. Org. Chem., 2010, 5041–5055 CrossRef CAS.
- T. Kondo, M. Yanagida, K. Shimazu and K. Uosaki, Langmuir, 1998, 14, 5656–5658 CrossRef CAS.
- Surface Analysis by Auger and X-Ray Photoelectron Spectroscopy, ed. D. Briggs and J. T. Grant, IM Publications and Surface Spectra Limited, Chichester and Manchester, 2003, ISBN: 1-901019-04-7 Search PubMed.
- M. Fleischmann, P. J. Hendra and A. J. McQuillan, Chem. Phys. Lett., 1974, 26, 163–166 CrossRef CAS.
- D. L. Jeanmaire and R. P. Van Duyne, J. Electroanal. Chem., 1977, 84, 1–20 CrossRef CAS.
- M. G. Albrecht and H. Creighton, J. Am. Chem. Soc., 1977, 99, 5215–5217 CrossRef CAS.
- U. Jung, M. Müller, N. Fujimoto, K. Ikeda, K. Uosaki, U. Cornelissen, F. Tuczek, C. Bornholdt, D. Zargarani, R. Herges and O. Magnussen, J. Colloid Interface Sci., 2010, 341, 366–375 CrossRef CAS PubMed.
- (a) U. Jung, S. Kuhn, U. Cornelissen, F. Tuczek, T. Strunskus, V. Zaporojtchenko, J. Kubitschke, R. Herges and O. Magnussen, Langmuir, 2011, 27, 5899–5908 CrossRef CAS PubMed; (b) U. Jung, O. Filinova, S. Kuhn, D. Zargarani, C. Bornholdt, R. Herges and O. Magnussen, Langmuir, 2010, 26, 13913–13923 CrossRef CAS PubMed.
- M. A. Ramin, G. Le Bourdon, N. Daugey, B. Bennetau, L. Vellutini and T. Buffeteau, Langmuir, 2011, 27, 6076–6084 CrossRef CAS PubMed.
- A. H. Kycia, K. Koczkur, J. J. Leitch, J. Lipkowski, V. Zamlynny and M. W. P. Petryk, Anal. Bioanal. Chem., 2013, 405, 1537–1546 CrossRef CAS PubMed.
- T. Buffeteau, B. Desbat, D. Blaudez and J. M. Turlet, Appl. Spectrosc., 2000, 54, 1646–1650 CrossRef CAS.
- S. Y. Wang, D. C. Huang and Y. T. Tao, Chin. Chem. Soc., 2012, 59, 9–17 CrossRef CAS.
- S. Wagner, F. Leyssner, C. Kördel, S. Zarwell, R. Schmidt, M. Weinelt, K. Rück-Braun, M. Wolf and P. Tegeder, Phys. Chem. Chem. Phys., 2009, 11, 6242–6248 RSC.
- T. A. Darwish, Y. Tong, M. James, T. L. Hanley, Q. Peng and S. Ye, Langmuir, 2012, 28, 13852–13860 CrossRef CAS PubMed.
- C. Gahl, D. Brete, F. Leyssner, M. Koch, E. R. McNellis, J. Mielke, R. Carley, L. Grill, K. Reuter, P. Tegeder and M. Weinelt, J. Am. Chem. Soc., 2013, 135, 4273–4281 CrossRef CAS PubMed.
- U. Siemeling, C. Bruhn, F. Bretthauer, M. Borg, F. Träger, F. Vogel, V. Azzam, M. Badin, T. Strunskus and C. Wöll, Dalton Trans., 2009, 8593–8604 RSC.
- B. W. Laursen and F. C. Krebs, Angew. Chem., 2000, 112, 3574–3576 ( Angew. Chem., Int. Ed. , 2000 , 39 , 3432–3434 ) CrossRef.
- A. D. Becke, J. Chem. Phys., 1993, 98, 5648–5652 CrossRef CAS.
- C. Lee, W. Yang and R. G. Parr, Phys. Rev. B: Condens. Matter Mater. Phys., 1988, 37, 785–789 CrossRef CAS.
- M. J. Frisch, G. W. Trucks, H. B. Schlegel, G. E. Scuseria, M. A. Robb, J. R. Cheeseman, G. Scalmani, V. Barone, B. Mennucci, G. A. Petersson and H. Nakatsuji, et al., Gaussian 09, Revision D.01, Gaussian, Inc., Wallingford, CT, 2009 Search PubMed.
- J. J. Yeh, Atomic Calculation of Photoionization Cross-Sections and Asymmetry Parameters, Gordon and Breach Science Publishers, Langhorne, PE, USA, 1993 Search PubMed.
- J. J. Yeh and I. Lindau, At. Data Nucl. Data Tables, 1985, 32, 1–155 CrossRef CAS.
- M. Wojdyr, J. Appl. Crystallogr., 2010, 43, 1126–1128 CrossRef CAS.
- P. C. Lee and D. Meisel, J. Phys. Chem., 1982, 86, 3391–3395 CrossRef CAS.
Footnote |
| † Electronic supplementary information (ESI) available. See DOI: 10.1039/c4cp03438d |
| This journal is © the Owner Societies 2014 |

