 Open Access Article
Creative Commons Attribution 3.0 Unported Licence
An electrochemical and high-speed imaging study of micropore decontamination by acoustic bubble entrapment†
Douglas G.
Offin
*a,
Peter R.
Birkin
*a and
Timothy G.
Leighton
b
aChemistry, Natural and Environmental Sciences, University of Southampton, Southampton, SO17 1BJ, UK. E-mail: d.g.offin@soton.ac.uk; prb2@soton.ac.uk
bInstitute of Sound and Vibration Research, Engineering and the Environment, University of Southampton, Southampton, SO17 1BJ, UK
First published on 21st January 2014
Abstract
Electrochemical and high-speed imaging techniques are used to study the abilities of ultrasonically-activated bubbles to clean out micropores. Cylindrical pores with dimensions (diameter × depth) of 500 μm × 400 μm (aspect ratio 0.8), 125 μm × 350 μm (aspect ratio 2.8) and 50 μm × 200 μm (aspect ratio 4.0) are fabricated in glass substrates. Each pore is contaminated by filling it with an electrochemically inactive blocking organic material (thickened methyl salicylate) before the substrate is placed in a solution containing an electroactive species (Fe(CN)63−). An electrode is fabricated at the base of each pore and the Faradaic current is used to monitor the decontamination as a function of time. For the largest pore, decontamination driven by ultrasound (generated by a horn type transducer) and bulk fluid flow are compared. It is shown that ultrasound is much more effective than flow alone, and that bulk fluid flow at the rates used cannot decontaminate the pore completely, but that ultrasound can. In the case of the 125 μm pore, high-speed imaging is used to elucidate the cleaning mechanisms involved in ultrasonic decontamination and reveals that acoustic bubble entrapment is a key feature. The smallest pore is used to explore the limits of decontamination and it is found that ultrasound is still effective at this size under the conditions employed.
Introduction
The use of ultrasound for decontamination is well known and it is a tool used in industry,1–3 dentistry4–6 and within many research laboratories. However, there is a lack of in situ studies concerning the physical processes that occur during decontamination, especially when ultrasound is applied to recesses of micron dimensions. This may be relevant to, for example, filter decontamination7–9 or cleaning of other porous substrates.10 Although the decontamination of smooth, flat surfaces is traditionally easier, if ultrasound is used the situation is more complicated. In this case interactions between the sound field in the liquid and the surface generating reflected waves that can strongly influence the pattern of decontamination.11,12In the work presented here, the decontamination of micropores by ultrasound has been studied in situ using electrochemistry and high-speed imaging. Here, the ultrasound was generated by an ultrasonic horn (or piston-like emitter) and so it is important to consider the environment that such a sound source generates within aqueous solutions. In the first instance, consider the generation and behaviour of bubbles directly in front of the horn. The fate of such bubbles is determined by the local conditions of frequency and pressure amplitude of the sound and also the solution properties.13 Bubble nuclei exposed to a critical pressure amplitude can, if of the correct size, be driven to inertial or transient collapse.14–18 In water this threshold is predicted to be approximately 100–120 kPa zero-to-peak amplitude at 23 kHz.14,19 Bubbles below this threshold are considered to be undergoing non-inertial or stable cavitation. This distinction is important because many of the phenomenological effects associated with sonication, for example erosion,20–24 radical generation25–30 and light emission31–35 are strongly associated with inertial bubble collapses. Given this pressure dependence of bubble behaviour and the associated physical effects, consideration should be to the shape and characteristics of the sound field generated by the sound source. Briefly, such consideration indicates that the direct field (assuming at this stage that contributions from the reverberant and scattered field are small) falls dramatically with distance.19,36 This implies that the highest likelihood of generating inertial cavitation exists close to the tip of the emitter. As the distance from the surface of the sound source is increased there will be a point at which inertial cavitation ceases to exist and only non-inertial bubble oscillation occurs. It should be noted that the threshold predictions above are for an isolated cavity exposed to a simple sinusoidal excitation. In the case of sound sources such as that used in this work, the situation is complicated by the presence of bubble clusters close to the tip of the source,37–40 additional acoustic signals related to these clusters19,38 and the interaction of these acoustic signals with sensing elements within the cell.37,38 These interactions can lead to an extension of the threshold away from the source. However, it has been observed that both erosion and multibubble sonoluminescence can be detected close to the tip of the source and are subject to a threshold distance (in the case of the source used here, approx. 2–3 mm).19,37,38 At greater distances stable bubble oscillation is seen, which leads to local fluid motion through microstreaming41–46 but no erosion of the surface.47 In addition to bubble-related processes, it is important to note that, owing to absorption of sound in this region, there is also expected to be a large amount of acoustic streaming, which leads to bulk fluid flow away from the tip of the horn.48–50
The aim of the work presented here was to study the decontamination of micropores by ultrasound and specifically to work in the region of liquid beyond the inertial cavitation threshold so as to eliminate these high-energy events from the process.
Experimental details
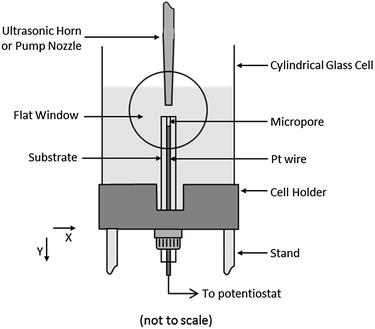
All experiments were carried using the setup shown in Fig. 1. A cylindrical glass cell (75 mm internal diameter × 105 mm height) was used, which was fitted with a flat window to allow high-speed imaging. The cell also had an SQ 13 joint fitted to the base, which allowed the test substrates to be inserted and sealed with a silicone washer. The cell was placed on a fixed stand and the ultrasonic horn entered the top of the cell such that the surface of the tip was parallel with the surface of the electrode (the so-called ‘face-on’ arrangement). The transducer itself was fixed to a computer controlled XYZ rig (3× Zaber T-LA60 linear actuators and stages). This allowed the position of the horn to be moved 60 mm in each direction with a resolution of greater than 10 μm. The cell was filled with 250 cm3 of solution.Micropores were fabricated from platinum electrodes of various diameters (0.5 mm, 0.125 mm and 0.05 mm), which were prepared by sealing the appropriate wire in glass (work undertaken by the Scientific Glassblowers at the University of Southampton). The surfaces of the electrodes were polished flat using silicon carbide paper (up to 1200 grade).
The pore was then prepared by etching the metal using a two-electrode arrangement with a vitreous carbon rod acting as the counter electrode. The applied potential was switched between +6 V and −6 V at a frequency of 25 Hz (0.02 second pulses). The etching solution consisted of 60% saturated CaCl2, 36% H2O and 4% concentrated HCl (by volume). During etching, the solution above the electrode was cavitated using an ultrasonic horn at an electrode-to-source distance of 5 mm in order to remove reaction products from the cavity, which were found hinder the etching process if not removed. The progress of the etching was monitored using the high-speed camera (in real time) with a macro lens attached to act as a microscope. Following the etching process the electrode was thoroughly rinsed with purified water.
In all experiments the foulant used was thickened methyl salicylate (tMS). In the case of the 0.5 mm diameter pore, tMS was applied using a 34G MicroFil needle. The amount per pore was not controlled but was in the region of 0.02 g. For the smaller pores this was not possible and the following procedure was used. The substrate was sealed in an open ended glass tube by means of a silicone washer and SQ13 joint. A small amount of tMS (approx. 0.02 g) was placed on the open pore. The open end of the glass tube was connected to a vacuum pump (KNF Neuberger VP series) and the tube was evacuated. The vacuum was then released and this was repeated several times until tMS filled the pore. Each filled pore was inspected to ensure that no pre-existing bubbles were visible in the matrix, subject to the resolution afforded by the high-speed camera optics. It is likely that microscopic bubbles were present in the contaminant. However, the experiments performed (see later) showed that cleaning of the micropore was as a direct result of bubble entrapment from the exterior of the cavity and not from residual microbubbles trapped in the matrix through the filling process.
Ultrasound and cavitation were generated by means of a TTi TGA12101 function generator, Brüel & Kjær Type 2713 power amplifier and an ultrasonic transducer fitted with a 3 mm diameter piston-like titanium tip (Adaptive Biosystems). The tip was positioned so it was 20 mm below the surface of the liquid. The nominal frequency of the ultrasound was 23 kHz. The power determined using calorimetry was 56 ± 5 W.
The acoustic pressure was measured using a G.R.A.S 10 CT hydrophone and Brüel & Kjær Type 2635 charge amplifier. The data was recorded with a Textronix TDS 224 digital oscilloscope or PC and ADC card (National Instruments PCI-6025E). Acoustic pressure measurements were made with the centre of the active element of the hydrophone positioned 2 mm below the tip of the horn and 13.5 mm off axis. In this location the pressure signal was found to consist of an underlying wave associated with the driving frequency of the horn (22.68 kHz) with approximately 10 kPa zero-to-peak amplitude. This was punctuated with higher amplitude pressure spikes (up to 40 kPa zero-to-peak), which occurred sporadically, but always at a sub-harmonic of the driving wave. These have previously been observed in aqueous solution and attributed to a cluster collapse at the tip of the ultrasonic horn.19,37,38
High-speed imaging data was recorded using a Photron APX 250RS digital camera fitted with a Navitar 12× zoom lens. The subject was backlit using a Schott DCR III cold light source with the fibre optic removed (i.e. the light from the lamp was used directly). This set-up resulted in the subject being in silhouette. The camera was triggered using a TTL pulse generated by a National Instruments PCI-6025E ADC card. In cases where high-speed imaging and electrochemical data were recorded synchronously the same pulse was used to trigger the camera and the electrochemical data acquisition.
Electrochemical data was acquired using a three electrode system with a Pt mesh acting as the counter electrode and a saturated calomel electrode (SCE) as the reference. The potential of the working electrode was controlled using a potentiostat built in-house and the current was recorded using a PC, ADC card (National Instruments PCI-6025E) and software developed in-house.
The pump (Eheim Type 1105) was fitted with a 10 mm diameter inlet while the outlet nozzle was attached to a pipette tip, cut so that the outlet was 3 mm in diameter (the same as the ultrasonic horn). For pump experiments the nozzle assembly was fitted to the XYZ stage in place of the transducer and horn.
All solutions were made up using water from either a USF Elga Purelab Option 10 or Purite Select water purification system. Water purified in this manner had conductivity below 0.06 μS cm−1. Aluminium particles (−100 +325 mesh, Alfa Aesar, 99.97%), K3Fe(CN)6 (Sigma-Aldrich, 99+%) and Sr(NO3)2 (Sigma-Aldrich, 99+%) were used as supplied. A proprietary surfactant (F54) and thickened methyl salicylate was supplied by DSTL for use in these experiments.
Results and discussion
Previous work has shown it is possible to monitor decontamination electrochemically and briefly highlighted the relative effectiveness of ultrasound versus bulk fluid flow generated by a pump system in this arena.51Here, this technique is used to further demonstrate the effectiveness of ultrasound in comparison with fluid flow for decontaminating complex structures (specifically micropores). In addition to electrochemical measurements, high-speed imaging has been used to elucidate the cleaning mechanisms at work. In cases where ultrasound was used, the distance between the substrate to be cleaned and the horn was 5 mm. This is beyond the threshold distance for inertial cavitation under the conditions used and so it can be assumed that inertial cavitation does not play a role in the decontaminating process. However, there are still a number of physical processes that occur in the region under study. In particular acoustic streaming and stable bubble oscillation are of interest.
In the first set of experiments a comparison was made between the decontamination of a 500 μm × 400 μm cylindrical pore using ultrasound and fluid flow generated by a pump.
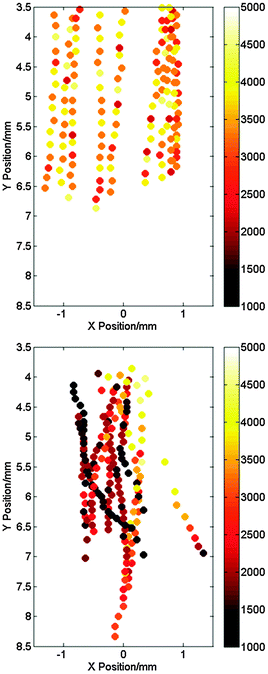
The aims of these experiments were to decouple the effects of bulk fluid flow generated by acoustic streaming from other acoustic processes (i.e. bubble related phenomena). First, in order to compare the bulk flow characteristics of these two systems, aluminium particles (−100 +325 mesh, 44–150 μm) were added to the solution and the solution below the horn or pump nozzle filmed using a high-speed camera while either the flow or sound were on. Ten particles were then selected and tracked using motion tracking software (Photron Motion Tools). Fig. 2 shows the particle trajectories in the XY-plane in both cases (see Fig. 1 for coordinate orientation). The symbols represent the location of the particle while the colour scale represents the velocity in the Y-direction. The particles that were tracked were chosen such that they remained in focus, indicating that their motion was small in the YZ-plane. The average fluid velocity in the Y-direction at a distance of 5 mm from the horn or pump nozzle was calculated by taking data for the ten particles at distances between 4.8 mm and 5.2 mm from the nozzle or horn and averaging the Y-velocities. This yields an average bulk fluid flow of 2450 ± 370 mm s−1 for the horn and 3620 ± 230 mm s−1 for the pump assuming in both cases that the particle velocity is a good approximation to the fluid velocity. Despite the average velocity for the pump being higher, inspection of the data presented in Fig. 2 suggests that there is more local variation generated by the horn. The peak velocities in the Y-direction are higher and additional lateral motion was observed along the X-axis, which contributes to the larger error in the velocity value calculated for the horn.
Having characterised the bulk fluid flow, decontamination experiments were then performed. Pore decontamination was monitored electrochemically using a platinum electrode in the base of each pore. This was achieved by employing a solution of 5 mM K3Fe(CN)6 and 0.1 M Sr(NO3)2 and holding the potential of the platinum electrode at 0 V vs. SCE. In the case of a clean pore this results in mass transfer limited reduction of Fe(CN)63−. Monitoring this current as a function of time is used to give information about the contamination of the pore. This is because the contaminant used (thickened methyl salicylate) is electrochemically inactive at the potential employed and blocks the base of the pore. This prevents the electroactive species reaching the electrode surface. Hence as the electrode is blocked by the tMS the current is essentially zero. However, as this material is removed from the recess and the Pt surface exposed to the electrolyte with the redox active material present, an increasing cathodic (negative) current will be observed as the Fe(CN)63− is reduced to Fe(CN)64− at the Pt surface. Because of the geometry of the electrode structure employed, this can only occur when the tMS layer has been penetrated by the cleaning mechanisms present within the system.
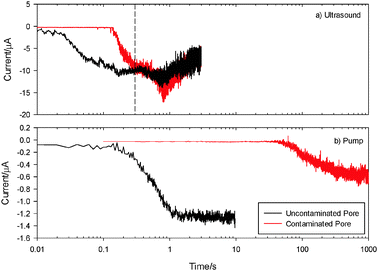
First, ultrasonic decontamination was performed. Fig. 3(a) shows a comparison of the currents measured in the absence (black ( )) and presence (red (
 )) of contamination in a pore exposed to ultrasound. In both cases the pore was positioned centrally under the horn at a distance of 5 mm (with respect to the upper glass interface) and the ultrasound was turned on at t = 0 s. In the absence of contamination (black line) the current starts to increase significantly between t = 0.02 and 0.03 s and reaches a stable value (on the time scale presented) at approx. 0.3 s (note time is plotted on a logarithmic scale). This indicates that the ring-up of the ultrasonic horn and the response time of the convection/diffusion profile generated at the recessed electrode have a limiting response on the order of 30–100 ms. The current after 0.3 s oscillates significantly. This observation is associated with bubble entrapment and oscillation in the free micropore, which is relevant to the following decontamination experiments. When a contaminated pore was used there was a delay before the current started to increase. In Fig. 3(a) the current for the contaminated pore (red line (
 )) is 0 until t = 0.15 s, after which the current increases and is the same as the uncontaminated pore by 0.3 s. The delay before the current increases (0.15 s) is due to the pore being full of contamination. It takes this time before the electrode at the base of the pore becomes exposed to the solution and is considered to be the ‘decontamination time’. The fact that the current reaches the same value as the uncontaminated pore indicates that the pore is fully decontaminated by exposure to ultrasound and the entrapped bubbles and external mechanisms driven by the ultrasonic source are largely the same. Note the current detected for a tMS free pore (either through cleaning or for an initially clean pore) in the presence of ultrasonic irradiation was found to decrease after extended time periods (t > 1 s, see Fig. 3(a)). This is associated with gas entrapment into the micropore which causes further perturbation in the system. It is also possible to compare ultrasonic cleaning of this structure with a pore exposed to bulk fluid flow generated by a pump, which shows a marked contrast.
Fig. 3(b) shows the currents recorded at clean and contaminated pores exposed to this fluid flow by the black ( ) and red (
 ) lines respectively. In both cases the pump was turned on at t = 0 s. For the uncontaminated pore (black line) the current starts to increase after 0.2 s and reaches a stable value after 1 s. Note under these conditions gas entrapment is not an issue and the current remains stable over the timescale investigated. The experiments also indicate that the start-up time of the pump is considerably longer than that recorded for the ultrasonic horn. In the case of the contaminated pore (red line (
 )) the current is essentially 0 until between 40 and 50 s and then starts to increase very slowly, such that after 1000 s it is still not at the value expected for a clean pore. This indicates that some decontamination has occurred but the pore is not fully decontaminated even after very long exposure to the fluid flow. These experiments have clearly shown that ultrasound is much more effective at decontaminating the pore in question (500 μm × 400 μm cylinder in glass) than bulk flow alone.
In order to investigate this in more detail further experiments were performed in conjunction with high-speed imaging to elucidate the decontamination mechanisms at work during exposure to ultrasound. For this further work smaller pores were used. Fig. 4 shows the current measured using a contaminated pore in one such ultrasonic decontamination experiment. In this case the pore was a 125 μm diameter × 350 μm deep cylindrical pore in glass with a Pt electrode at its base. The current has been normalised to the current recorded using a clean pore such that a value of 1 indicates the reading expected at a clean pore. Ultrasonic irradiation of the system was initiated at t = 0 s.
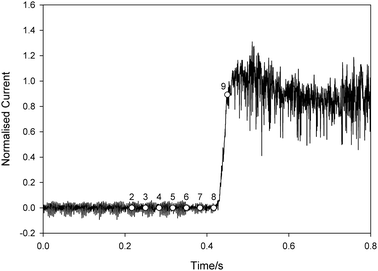 | ||
| Fig. 4 Plot showing the normalised current recorded at a platinum electrode at the base of a 125 μm diameter pore (depth of pore approx. 350 μm) as a function of time (t). The pore was filled with tMS and placed 5 mm below an ultrasonic horn in a solution of 5 mM K3Fe(CN)6 and 0.1 M Sr(NO3)2 in an emulsion of water and F54 surfactant. The ultrasound was turned on at t = 0 s. The current has been normalised to the average current recorded at a clean pore under the same insonification conditions. The labelled symbols refer to the frame numbers for the data shown in Fig. 5, which were recorded simultaneously. | ||
Initially the current is essentially 0 and stays at this level until approx. 0.43 s, when it starts to increase. Following the discussion above, this indicates the point at which the electrode at the base of the pore was exposed to the electrolyte containing the electroactive species. After this the current rapidly increases such that by 0.45 s the value has reached that expected at a clean pore. High-speed images were recorded simultaneously with the current and a sequence is shown in Fig. 5. This shows every 100th frame from data recorded at 3000 frames s−1. The time of each frame is denoted by the labelled circle symbols in Fig. 4. Frame 1 shows the substrate as fouled, where ‘G’ is the glass substrate, ‘P’ is the micropore, ‘Pt’ is platinum wire which forms the base of the pore, ‘tMS’ is the foulant, ‘S’ is the solution and the dashed line indicates the surface of the substrate.
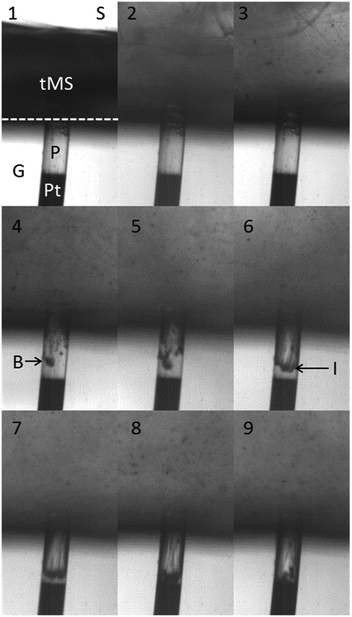 | ||
Fig. 5 A sequence of selected frames from high speed imaging of a pore (P) in a glass substrate (G) with a platinum electrode at the base (Pt). The diameter of the pore is 125 μm. The pore is initially filled with tMS, which also sits on the surface of the glass substrate. The pore is in a solution (S) of 5 mM K3Fe(CN)6 and 0.1 M Sr(NO3)2 in an emulsion of water and F54 surfactant. The interface between the solution and the surface of the glass is highlighted with a dashed line in frame 1. The current at the platinum electrode recorded simultaneously with these images is presented in Fig. 4, in which the labelled symbols represent the time of each frame. The exposure time of each frame was 1/44![[thin space (1/6-em)]](https://www.rsc.org/images/entities/char_2009.gif) 000 s. 000 s. | ||
Note that the foulant sits on the surface of the substrate and penetrates the pore, where it appears transparent due to the small diameter of the pore employed. These images give an excellent insight into the decontamination process both inside the micropore and on the outer surface of the electrode structure and provide complimentary information to the electrochemical data. Fig. 5 frames 2 and 3 show that the foulant is quickly removed from the outer flat surface of the substrate. The images indicate that the zone below the ultrasonic horn and on the surface of the electrode substrate is very dynamic indeed. However, the tMS remains in the pore for a considerable time longer. In Fig. 5, frame 4 bubbles (labelled ‘B’) can be seen within the foulant in the pore. In frame 5 there are more bubbles and they appear to be moving into the pore. By frame 6 a clear interface (labelled ‘I’) has formed between the remaining tMS in the pore and the solution. This interface proceeds into the pore as the foulant is removed. The tMS can be seen leaving the pore as streamlines, particularly in frame 8. Between frames 8 and 9 the tMS is totally removed from the pore, which is evidenced by the increase in normalised current, shown in Fig. 4.
The data presented in Fig. 4 and 5 clearly indicate that the rapid decontamination of the structure is associated with bubble ingress into the foulant within the pore. It is interesting to look at this process in more detail.
Fig. 6 shows consecutive images taken at 3000 frames s−1 where the first image is at t = 0.2576 s (i.e. between frames 3 and 4 in Fig. 5). This sequence shows the first entry of bubbles into the pore. Frame 1 shows the pore full of foulant and in frame 2 a bubble (labelled ‘B2’) can be seen to have entered the pore. This bubble moves down the side of the pore before a second bubble (labelled ‘B3’) enters the pore in frame 5, which also moves down into the pore. There is some evidence of bubble oscillation within the pore. Comparing frames 8 and 9, the bubble on the left of the pore appears bigger in frame 8 than in frame 9, although exact imaging of the bubble dynamics within this structure is limited by the geometry and size of the micropore as well as the lighting, frame rate and dimensions of the bubbles in question (here estimated to be of the order of 10 μm in diameter). Fig. 7 shows the situation in the pore a small time later, at t = 0.273 s. This is still between frames 3 and 4 in Fig. 5. By this time a group of bubbles exists within the foulant, highlighted by the dashed circle in frame 1. This includes the two bubbles that were noted in Fig. 6 (B2 and B3), although by this time they have translated away from the pore walls and towards the centre. All these bubbles undergo clear oscillations in radius due to the acoustic field present (compare frames 1, 2 and 3). In frame 6 another bubble is seen entering the pore (labelled ‘B4’). This bubble travels rapidly into the pore and appears to coalesce with the existing bubbles in frames 7, 8 and 9. Note care must be taken here as it is possible that the bubble has moved behind the existing bubbles in the pore. Nevertheless these frames clearly show the process of acoustic bubble entrapment and oscillation within the pore, which leads to decontamination.
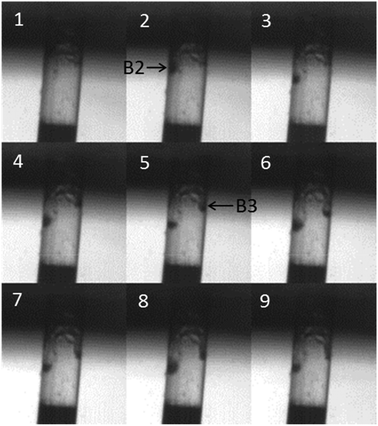 | ||
| Fig. 6 Nine consecutive images taken from high-speed imaging of a contaminated glass pore (see Fig. 5 for details of the frame layout) showing bubble trapping. The images were recorded simultaneously with the current data presented in Fig. 4. The first image was taken at t = 0.2576 s (i.e. between frames 3 and 4 in Fig. 4) and the capture rate was 3000 fps so the sequence covers 2.6 ms). A bubble (B2) can be seen to enter the pore in frame 2, which oscillates in size (compare frame 5 and 8, for example) and moves down into the pore. In frame 5 a second bubble (B3) can be seen entering the pore. | ||
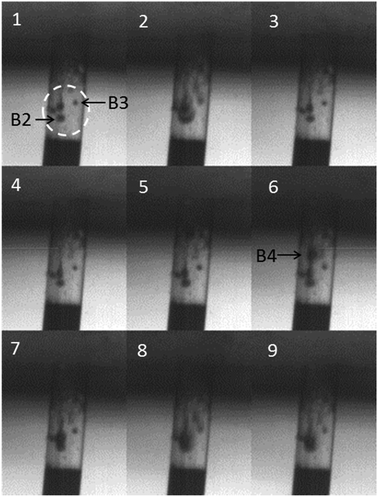 | ||
| Fig. 7 Nine consecutive images taken from high-speed imaging of a contaminated glass pore (see Fig. 5 for details of the frame layout) showing further bubble trapping and coalescence. The images were recorded simultaneously with the current data presented in Fig. 4. The first image was taken at t = 0.273 s (i.e. between frames 3 and 4 in Fig. 4) and the capture rate was 3000 fps so the sequence covers 2.6 ms. A group of bubbles can be seen in the contamination within the pore (highlighted with the dotted circle in frame 1. These oscillate in size (compare frames 1, 2 and 3 for example). Between frames 5 and 6 a large bubble (B4) enters the pore, which moves down into the pore and eventually appears to coalesce with the existing bubbles. | ||
A further pore was fabricated to probe the limits of ultrasonic decontamination. In this case the pore had dimensions of 50 μm × 200 μm (aspect ratio 4.0). The pore was loaded with tMS and exposed to ultrasound as above. It was found that the decontamination time was longer (0.85 s compared with 0.43 s for the 125 μm pore and 0.15 s for the 500 μm pore). However, after this delay the current recorded using the electrode at the base of the pore quickly rose to the same as that recorded at a clean pore indicating effective decontamination.
Clearly in the presence of ultrasound produced by this experimental arrangement, bubbles are quickly entrapped in the structure employed within these experiments leading to decontamination and it would seem useful to consider the reasons for this particular behaviour. The bubbles in question exist in a complex environment with a variety of forces acting upon them. However, the acoustic excitement of the bubbles plays a key role in the process. In order to understand this, consider a bubble oscillating close to an infinite plane boundary that is acoustically rigid. The pressure field emitted by the bubble will be reflected by the surface to generate an image bubble, which appears to oscillate in phase with the real bubble. The real bubble and image bubble are attracted to each other through mutual radiation forces and as a result the real bubble will be attracted to the rigid surface.52 Here, this effect leads to bubbles in the solution, which are close to the electrode substrate being attracted to the surface.47 Once there, the bubbles migrate across the surface and can enter the micropore. In fact bubbles will be actively attracted to the pore as the attractive force is greater due to the presence of multiple image bubbles in the structure (because the diameter of the pore is less than a wavelength, the sound field53,54 inside is relatively simple and will produce a net attractive force). Once inside the pore the bubbles continue to oscillate (see Fig. 7) and drive out contamination. It is also expected that following the onset of ultrasonic irradiation of a sufficient pressure amplitude, surface waves (for example Faraday waves) rapidly grow on the gas/liquid interface of the bubbles concerned.55 It is interesting to speculate that the shear forces associated with these surface waves play a role in the decontamination process. However, the limitations in resolution and frame rate of the high-speed imaging employed here together with the curved nature of the pore mean it is difficult to confirm this in the results presented.
Conclusions
The decontamination of micropores has been studied using electrochemistry and high-speed imaging. In the case of a large pore (500 μm × 400 μm, aspect ratio = 0.8) the effect of bulk fluid flow and ultrasound has been compared and it was found that ultrasound is far more effective. With ultrasound, the pore is decontaminated on a sub-second time scale whereas in the case of bulk fluid flow alone, exposure for more than 1000 s did not fully decontaminate the pore. The physical mechanisms responsible for the efficient ultrasonic decontamination were further studied using a smaller pore with a higher aspect ratio (125 μm × 350 μm, aspect ratio = 2.8). It was found that contamination was easily removed from the surface of the substrate by bulk flow alone. However, decontamination of the pore did not occur until acoustically active bubbles became trapped in the foulant employed. Oscillation of these trapped bubbles led to the removal of contamination from the pore. A further experiment with an even smaller pore (50 μm × 200 μm, aspect ratio = 4.0) showed that ultrasound was still effective at this scale but took longer than the larger pores investigated.Acknowledgements
We thank DSTL, The Royal Society Brian Mercer Award and the EPSRC (EP/D05849X/1) for funding.Notes and references
- C. Otto, S. Zahn, F. Rost, P. Zahn, D. Jaros and H. Rohm, Food Eng. Rev., 2011, 3, 171–188 CrossRef CAS.
- S. E. Bilek and F. Turantas, Int. J. Food Microbiol., 2013, 166, 155–162 CrossRef PubMed.
- S. J. McNeil and R. A. McCall, Ultrason. Sonochem., 2011, 18, 401–406 CrossRef CAS PubMed.
- L. W. M. van der Sluis, M. Versluis, M. K. Wu and P. R. Wesselink, Int. Endod. J., 2007, 40, 415–426 CrossRef CAS PubMed.
- G. Plotino, C. H. Pameijer, N. M. Grande and F. Somma, J. Endod., 2007, 33, 81–95 CrossRef PubMed.
- R. Oleary, A. M. Sved, E. H. Davies, T. G. Leighton, M. Wilson and J. B. Kieser, J. Clin. Periodontol., 1997, 24, 432–439 CrossRef CAS.
- M. O. Lamminen, H. W. Walker and L. K. Weavers, J. Membr. Sci., 2004, 237, 213–223 CrossRef CAS PubMed.
- M. Kallioinen and M. Manttari, Sep. Sci. Technol., 2011, 46, 1388–1395 CrossRef CAS.
- A. L. Ahmad, N. F. C. Lah, S. Ismail and B. S. Ooi, Sep. Purif. Rev., 2012, 41, 318–346 CrossRef.
- G. W. Porter, A. Lewis, M. Barnes and R. Williams, Innovative Food Sci. Emerging Technol., 2011, 12, 509–514 CrossRef PubMed.
- T. G. Leighton, M. J. W. Pickworth, A. J. Walton and P. P. Dendy, Phys. Med. Biol., 1988, 33, 1239–1248 CrossRef.
- M. J. Pickworth, P. P. Dendy, P. R. Twentyman and T. G. Leighton, Phys. Med. Biol., 1989, 34, 1553–1560 CrossRef CAS.
- T. G. Leighton, Ultrason. Sonochem., 1995, 2, S123–S136 CrossRef.
- C. K. Holland and R. E. Apfel, IEEE Trans. Ultrason. Ferroelectr. Freq. Control, 1989, 36, 204–208 CrossRef CAS PubMed.
- R. E. Apfel, J. Acoust. Soc. Am., 1981, 69, 1624–1633 CrossRef PubMed.
- H. G. Flynn, J. Acoust. Soc. Am., 1975, 58, 1160–1170 CrossRef PubMed.
- H. G. Flynn, J. Acoust. Soc. Am., 1975, 57, 1379–1396 CrossRef PubMed.
- E. A. Neppiras and B. E. Noltingk, Proc. Phys. Soc., London, Sect. B, 1951, 64, 1032–1038 CrossRef.
- P. R. Birkin, D. G. Offin and T. G. Leighton, Phys. Chem. Chem. Phys., 2005, 7, 530–537 RSC.
- B. Vyas and C. M. Preece, J. Appl. Phys., 1976, 47, 5133–5138 CrossRef CAS PubMed.
- P. R. Birkin, R. O'Connor, C. Rapple and S. S. Martinez, J. Chem. Soc., Faraday Trans., 1998, 94, 3365–3371 RSC.
- P. V. Chitnis, N. J. Manzi, R. O. Cleveland, R. A. Roy and R. G. Holt, J. Fluids Eng., 2010, 132, 051303 CrossRef.
- P. R. Birkin, D. G. Offin and T. G. Leighton, Electrochem. Commun., 2004, 6, 1174–1179 CrossRef CAS PubMed.
- P. R. Birkin, D. G. Offin and T. G. Leighton, Wear, 2005, 258, 623–628 CrossRef CAS PubMed.
- E. J. Hart and A. Henglein, J. Phys. Chem., 1985, 89, 4342–4347 CrossRef CAS.
- A. Henglein, Ultrason. Sonochem., 1995, 2, S115–S121 CrossRef CAS.
- G. Mark, A. Tauber, L. A. Rudiger, H. P. Schuchmann, D. Schulz, A. Mues and C. von Sonntag, Ultrason. Sonochem., 1998, 5, 41–52 CrossRef CAS.
- G. J. Price and E. J. Lenz, Ultrasonics, 1993, 31, 451–456 CrossRef CAS.
- P. R. Birkin, J. F. Power and T. G. Leighton, Chem. Commun., 2001, 2230–2231 RSC.
- P. R. Birkin, J. F. Power, T. G. Leighton and A. M. L. Vincotte, Anal. Chem., 2002, 74, 2584–2590 CrossRef CAS.
- G. Iernetti, Acustica, 1970, 23, 189–207 Search PubMed.
- P. D. Jarman and K. J. Taylor, Acustica, 1970, 23, 243–251 Search PubMed.
- M. J. W. Pickworth, P. P. Dendy, T. G. Leighton and A. J. Walton, Phys. Med. Biol., 1988, 33, 1249–1260 CrossRef.
- A. J. Walton and G. T. Reynolds, Adv. Phys., 1984, 33, 595–660 CrossRef CAS.
- T. G. Leighton, B. T. Cox and A. D. Phelps, J. Acoust. Soc. Am., 2000, 107, 130–142 CrossRef PubMed.
- L. E. Kinsler, A. R. Frey, A. B. Coppens and J. V. Sanders, Fundamentals of Acoustics, John Wiley & Sons, Inc, New York, 1982 Search PubMed.
- P. R. Birkin, D. G. Offin, P. F. Joseph and T. G. Leighton, J. Phys. Chem. B, 2005, 109, 16997–17005 CrossRef CAS PubMed.
- P. R. Birkin, D. G. Offin, C. J. B. Vian and T. G. Leighton, J. Acoust. Soc. Am., 2011, 130, 3379–3388 CrossRef PubMed.
- I. Hansson, V. Kedrinskii and K. A. Morch, J. Phys. D: Appl. Phys., 1982, 15, 1725–1734 CrossRef.
- I. Hansson and K. A. Morch, J. Appl. Phys., 1980, 51, 4651–4658 CrossRef PubMed.
- Y. E. Watson, P. R. Birkin and T. G. Leighton, Ultrason. Sonochem., 2003, 10, 65–69 CrossRef CAS.
- D. G. Offin, P. R. Birkin and T. G. Leighton, Electrochem. Commun., 2007, 9, 1062–1068 CrossRef CAS PubMed.
- P. R. Birkin, Y. E. Watson, T. G. Leighton and K. L. Smith, Langmuir, 2002, 18, 2135–2140 CrossRef CAS.
- R. K. Gould, J. Acoust. Soc. Am., 1974, 56, 1740–1746 CrossRef PubMed.
- P. R. Birkin, Y. E. Watson and T. G. Leighton, Chem. Commun., 2001, 2650–2651 RSC.
- S. A. Elder, J. Acoust. Soc. Am., 1959, 31, 54–64 CrossRef PubMed.
- P. R. Birkin, D. G. Offin, C. J. B. Vian, T. G. Leighton and A. O. Maksimov, J. Acoust. Soc. Am., 2011, 130, 3297–3308 CrossRef PubMed.
- A. Kumar, P. R. Gogate and A. B. Pandit, Ind. Eng. Chem. Res., 2007, 46, 4368–4373 CrossRef CAS.
- F. Marken, R. P. Akkermans and R. G. Compton, J. Electroanal. Chem., 1996, 415, 55–63 CrossRef.
- M. C. Schenker, M. J. B. M. Pourquie, D. G. Eskin and B. J. Boersma, Ultrason. Sonochem., 2013, 20, 502–509 CrossRef CAS PubMed.
- D. G. Offin, C. J. B. Vian, P. R. Birkin and T. G. Leighton, Hydroacoustics, 2008, 11, 299–312 Search PubMed.
- T. G. Leighton, The Acoustic Bubble, The Academic Press, London, 1994 Search PubMed.
- P. R. Birkin, T. G. Leighton, J. F. Power, M. D. Simpson, A. M. L. Vincotte and P. F. Joseph, J. Phys. Chem. A, 2003, 107, 306–320 CrossRef CAS.
- P. R. Birkin, J. F. Power, A. M. L. Vincotte and T. G. Leighton, Phys. Chem. Chem. Phys., 2003, 5, 4170–4174 RSC.
- A. O. Maksimov and T. G. Leighton, Acustica, 2001, 87, 322–332 Search PubMed.
Footnote |
| † Electronic supplementary information (ESI) available: Movie from which Fig. S5–S7 are taken. See DOI: 10.1039/c3cp55088e |
| This journal is © the Owner Societies 2014 |

