 Open Access Article
Creative Commons Attribution 3.0 Unported Licence
Preparation of Ge nanotube arrays from an ionic liquid for lithium ion battery anodes with improved cycling stability†
Xusong
Liu
a,
Jian
Hao
a,
Xiaoxu
Liu
ab,
Caixia
Chi
a,
Na
Li
a,
Frank
Endres
c,
Yi
Zhang
d,
Yao
Li
*d and
Jiupeng
Zhao
*a
aSchool of Chemical Engineering and Technology, Harbin Institute of Technology, 150001, Harbin, China. E-mail: jiupengzhao@126.com; Fax: +086 45186402345; Tel: +086 451 86402345
bHeilongjiang university of Science and Technology, Harbin 150027, China
cInstitute of Particle Technology, Chair of Interface Processes Clausthal University of Technology, Arnold-Sommerfeld-Str, 638678 Clausthal-Zellerfeld, Germany
dCenter for Composite Material, Harbin Institute of Technology, Harbin, China. E-mail: yaoli@hit.edu.cn
First published on 17th December 2014
Abstract
Ge nanotube array anodes are prepared by template-assisted electrodeposition from an ionic liquid to obtain superior cycling performance. They show remarkable cycling ability at 0.2 C, with a very high initial discharge capacity of 1641 mA h g−1 and a charge capacity of 1260 mA h g−1. After 250 cycles the capacity retention is 98% relative to that at the 50th cycle.
Rechargeable lithium batteries (LIBs) are widely used in portable electronic devices and electric vehicles, and their rapid development has led to demand for electrode materials with both high capacity and high power density.1 However, the commercial graphite materials used as the anode materials of lithium-ion batteries have a low theoretical capacity (372 mA h g−1), which limits the application of LIBs.2 A great deal of recent research has been devoted to group IVA elements that are capable of forming alloys with lithium.3 For example, silicon (Si) and germanium (Ge) show high theoretical capacities of 4200 mA h g−1 and 1600 mA h g−1, respectively. Compared to Si, Ge has excellent lithium-ion diffusivity (400 times faster than Si) and high electrical conductivity (104 times higher than Si).4 Therefore Ge will be an attractive electrode material for high-power-rate anodes. However, Ge undergoes a volume change of 370%.5 To minimize such volume strain during the charge and discharge processes, strategies for versatile morphology control using 0 D nanoparticles,6 1 D nanowires and nanotubes,7–10 and 3 D particles have been reported,11 and the obtained anode materials have exhibited better storage capacity and rate performance than their bulk counterparts.
Among them, 1 D nano-tubular morphology is particularly attractive since it can provide a large interfacial contact area with the electrolyte and short Li ion diffusion distances and it can also accommodate the volume changes.9,10 Here, we report the lithium storage properties of germanium nanotube arrays electrodeposited from an ionic liquid, 1-ethyl-3-methylimidazolium bis(trifluoromethylsulfonyl)imide ([Emim]Tf2N), for the first time. Template-assisted potentiostatic electrochemical deposition from the air- and water stable ionic liquid [Emim]Tf2N containing GeCl4 solute is conducted at room temperature. The prepared Ge nanotubes (Ge NTs) exhibit excellent cycling stability and improved rate capability.
Usually, germanium layers cannot be formed by electrodeposition in aqueous solutions, because germanium deposition in water is always accompanied by hydrogen evolution. In contrast, we have reported that germanium with the inverse opal structure can quite easily be electrodeposited in ionic liquids.12,13 The electrodeposition of semiconductors from ionic liquids has several advantages attributable to the large electrochemical windows of ionic liquids.14,15 For example, the morphology of the layer can be easily controlled by adjusting the template, electrolyte concentration, and deposition time. Electrodeposition can also be carried out at room temperature, which can significantly lower the energy consumption, operation cost, and pollutant emissions relative to those of physical methods. We believe our synthetic protocol to be an attractive and scalable synthetic approach to the preparation of high-performance group IV 1 D electrodes.
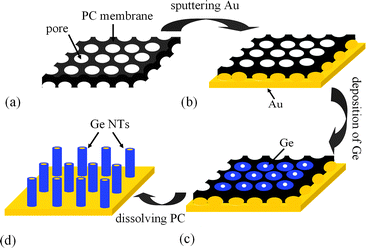
Fig. 1 presents the schematic for the preparation of Ge NT arrays by electrodeposition from an ionic liquid at room temperature.
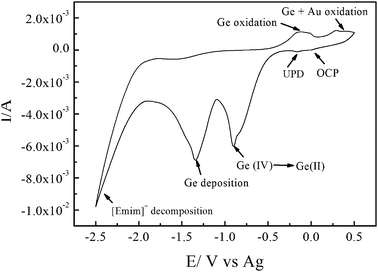
Fig. 2 shows the cyclic voltammogram (CV) of 0.2 mol L−1 GeCl4 in [Emim]Tf2N on an Au-sputtered PC membrane. The weak reduction peak next to the open-circuit potential (OCP) at −0.25 V corresponds to underpotential deposition (UPD). The reduction peak at −0.8 V is due to the reduction of Ge(IV) to Ge(II) species, and the reduction peak at −1.3 V corresponds to the reduction of Ge(II) species to Ge. In the anodic regime, the first wide oxidation peak at 0.2 V corresponds to the partial oxidation and dissolution of the deposited Ge.16
Ge NT arrays were prepared by using M400 PC membranes. Fig. 3(a) and (b) show top views of Ge NT arrays deposited at −1.3 V for 20 min from 0.2 mol L−1 GeCl4 in [Emim]Tf2N inside the M400 PC membrane. The pore diameter of the Ge NTs is about 400 nm, with a wall thickness of 38 nm that can be easily controlled by changing the electrodeposition time. The length of the Ge NTs is about 1.7 μm, as shown in Fig. 3(c). The EDX spectrum shows that the as-prepared samples are composed of Ge, Au, Cu, and O. The Au and Cu are from the gold film below the Ge NT arrays and the current collector, respectively. The oxygen arises from the partial oxidation of Ge during unavoidable handling outside of the glove box. No detectable amounts of chlorine or sulfur (from the ionic liquid) are observed.
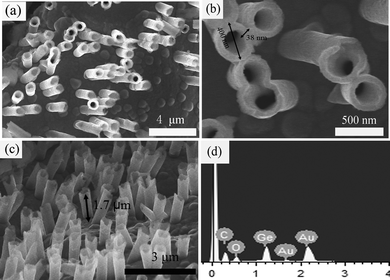 | ||
| Fig. 3 (a) Low-resolution top-view SEM images of Ge NT arrays. (b) High-resolution top-view SEM images of Ge NT arrays. (c) Side-view SEM images of Ge NT arrays. (d) EDX image of (c). | ||
When a M100 PC membrane was used as the template, Ge nanowire (NW) bundles were obtained after electrodeposition for 30 min from 0.1 mol L−1 GeCl4 in [Emim]Tf2N, as shown in Fig. S1a (ESI†). The length of the Ge NWs is about 1.5 μm (Fig. S1b, ESI†). In our experiments, when the pore diameter of the template was larger, a shorter deposition time and a higher concentration of GeCl4 led to the formation of Ge NT arrays. In contrast, when templates with small pore diameters were used, a longer deposition time and a lower concentration of GeCl4 led to the formation of Ge NWs. In order to investigate the structural evolution of Ge NTs, electrodeposition of Ge was conducted at different deposition times by using M 400 PC membranes as templates. Fig. S2 (ESI†) shows the morphology evolution of the deposits after deposition from 5 to 40 min. The possible formation mechanism is proposed based on the above results. At the beginning of electrodeposition, the inner wall of the template pore is a preferential site for deposition, where Ge is deposited first,17 and thus, the short Ge NTs are formed (Fig. S2(a), ESI†). Subsequently, Ge grows along the inner wall of the PC membrane owing to the large surface area of nanochannels, and stable deposition in the direction parallel to the PC holes, i.e., the wall-surface growth pattern, results in the formation of long Ge NTs (Fig. S2(b) and (c), ESI†). Thereafter, the electrode/ionic-liquid interface and the reduction of Ge cause a concentration gradient and thickening of the diffusion zone, leading to a rapid decrease in the cathodic current.18 At low current, Ge preferentially grows along the channel direction, resulting in the bottom-up growth pattern that produces completely packed Ge NWs (Fig. S2(d), ESI†).19
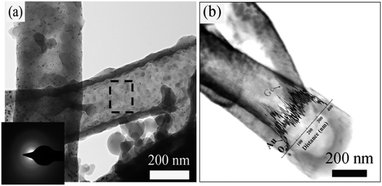
Fig. 4(a) and its inset show the tubular-like structure with a hollow core and an amorphous wall. HRTEM of Ge NTs from the squared area in Fig. 4(a) also confirms the amorphous structure of Ge NT arrays (Fig. S3, ESI†).11Fig. 4(b) shows a high-angle annular dark-field (HAADF) Z-contrast image of the Ge NT. Lighter sections reflect higher atomic numbers, and vice versa. Therefore, a large proportion of Au seems to be at the bottom of the Ge NT. The energy-dispersive spectroscopy (EDX) shows the distribution of Au in the Ge NT, which should provide highly conductive electron transport pathways and better electrical contact between the active materials and the current collector.
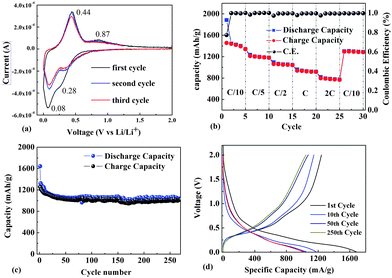
The charge curves start at potentials of 0.28 and 0.08 V versus Li/Li+ in the cathodic branch, corresponding to the formation of a Li–Ge alloy during the charge process (Fig. 5a). Upon discharge, peaks appearing at 0.44 and 0.88 V can be ascribed to the phase transition of LixGe to Ge.
We examined the rate capability performance and cycling stability of as-prepared Ge NTs. The rate capability performance is shown in Fig. 5b. The Ge NT electrodes exhibit charge capacities (reversible capacities) of 1445, 1233, 1094, 961, and 818 mA h g−1 at1/10 C, 1/5 C, 1/2 C, 1 C, and 2 C, respectively. When the rate was decreased from 2 C to 1/10 C, the specific capacity was well recovered: a capacity retention of 90% was achieved. A previous report showed that Ge NWs prepared by direct VLS growth using GeH4 exhibited a discharge capacity of 600 mA h g−1 at 2 C, which is significantly lower than the discharge capacity (825 mA h g−1) of our Ge NTs. This could be due to the large specific surface area of the NTs. The material was cycled at a C/5 rate for 250 cycles, with the results shown in Fig. 5c and voltage profiles in Fig. 5d. The Ge NTs exhibited an initial discharge capacity of 1641 mA h g−1 and a charge capacity of 1260 mA h g−1, with an initial 77% Coulombic efficiency. However, the discharge capacity is 1173 mA h g−1 at the 10th cycle, which may be due to the formation of a solid electrolyte interface (SEI) layer on the NTs during the 1st cycle.7 Then, slight capacity fading is observed, and the reversible capacity recorded at the 50th cycle is 1025 mA h g−1, with a capacity retention of 81%. Moreover, the Ge NTs show a large reversible capacity. The stability of the Ge NT electrodes from the 50th to 250th cycle is remarkable (dropping by only 0.01% per cycle). After 250 cycles, the capacity retention is 98% relative to that at the 50th cycle. A previous report showed that Ge NTs prepared by using the Kirkendall effect8 exhibited a capacity retention of about 80% at 0.2 C; our Ge NTs thus exhibit nearly 20% better capacity retention. Furthermore, compared to Ge NWs,20 the Ge NTs exhibit a capacity retention improved by nearly 30%. After 250 charge/discharge cycles, the Ge NT anode appears to remain in contact with the current collector without pulverization and exfoliation. The wall thickness of Ge NTs increases after lithiation due to the volume increase, as shown in Fig. S4 (ESI†). This suggests that the active material has a very stable structure capable of withstanding the volume change without pulverization and loss of contact with the current collector.
The excellent cycling stability and improved rate capability of Ge NTs result from their unique interior hollow structure and 1 D amorphous phase. First, because of the hollow tubular structure of the Ge NTs, their interior acts as a buffer for the volume expansion, and thus, structural damage or mechanical strain due to Li ion insertion/extraction is reduced. Second, the tubular structure provides a large interfacial contact area with the electrolyte, including the ends and the inner and outer surface of the tube, allowing fast diffusion of Li ions. Third, the formation of the amorphous Ge phase improves the robustness of the Ge NTs by preventing the transformation between crystalline Ge NTs and amorphous Ge NTs,20,21 and directly leads to a stable capacity by ensuring a homogeneous volume expansion and no particle pulverization during cycling.22,23 Fourth, Au at the end of the Ge NTs provides highly conductive electron transport pathways and better electrical contact between the active materials and the current collector, which may be responsible for the good cycle reversibility.11 Therefore, the Ge NT electrodes electrodeposited from an ionic liquid are considered to feature good stability, good electrical contact, and fast electron transport, which may be responsible for their good electrochemical performance.
Ge NT array anodes have been prepared by template-assisted potentiostatic electrodeposition from [Emim]Tf2N at room temperature for the first time. A Ge NT array anode shows remarkable cycling ability compared to current Ge NW and NT anodes. The improved performance of the Ge NTs is attributed to better electrical contact with the current collector, the formation of an amorphous phase, and the hollow tubular structure. Thus, electrodeposition from an ionic liquid is excellent for improving the electrochemical performance of group IV 1 D electrodes.
We thank the National Natural Science Foundation of China (No. 91216123, 51174063, 21103036), the Natural Science Funds for Distinguished Young Scholar of Heilongjiang Province, The Natural Science Foundation of Heilongjiang Province (E201436) and the project of International Cooperation supported by Ministry of Science and Technology of China (2013 DFR10630).
Notes and references
- P. Poizot, S. Laruelle, S. Grugeon, L. Dupont and J. M. Tarascon, Nature, 2000, 407, 496 CrossRef CAS PubMed.
- B. Scrosati and J. Garche, J. Power Sources, 2010, 195, 2419 CrossRef CAS PubMed.
- C. M. Park, J. H. Kim, H. S. Kim and H. J. Sohn, Chem. Soc. Rev., 2010, 39, 3115 RSC.
- O. B. Chae, S. Park, J. H. Ku, J. H. Ryuand and S. M. Oh, Electrochim. Acta, 2010, 55, 2894 CrossRef CAS PubMed.
- G. Jo, I. Choi, H. Ahn and M. J. Park, Chem. Commun., 2012, 48, 3987 RSC.
- M. Park, K. Kim, J. Kim and J. Cho, Adv. Mater., 2010, 22, 415 CrossRef CAS PubMed.
- C. K. Chan, X. F. Zhang and Y. Cui, Nano Lett., 2008, 8(1), 307 CrossRef CAS PubMed.
- J. Gu, S. M. Collins, A. I. Carim, X. Hao, B. M. Bartlett and S. Maldonado, Nano Lett., 2012, 12, 4617 CrossRef CAS PubMed.
- S. Ling, Z. Cui, G. She, X. Guo, L. Mu and W. Shi, J. Nanosci. Nanotechnol., 2012, 12, 213 CrossRef CAS PubMed.
- M. H. Park, Y. H. Cho, K. Kim, J. Kim, M. Liu and J. Cho, Angew. Chem., Int. Ed., 2011, 50, 9647 CrossRef CAS PubMed.
- Y. Yu, C. Yan, L. Gu, X. Lang, K. Tang, L. Zhang, Y. Hou, Z. Wang, M. W. Chen and O. G. Schmidt, Adv. Energy Mater., 2013, 3, 281 CrossRef CAS.
- X. Liu, J. Zhao, J. Hao, B. L. Su and Y. Li, J. Mater. Chem. A, 2013, 1, 15076 CAS.
- X. D. Meng, R. Al-Salman, J. Zhao, N. Borissenko, Y. Li and F. Endress, Angew. Chem., Int. Ed., 2009, 48, 2703 CrossRef CAS PubMed.
- F. Endres and S. Z. El Abedin, Phys. Chem. Chem. Phys., 2006, 8, 2101 RSC.
- S. Zein El Abedin and F. Endres, ChemPhysChem, 2006, 7, 58 CrossRef CAS PubMed.
- R. Al-Salman, J. Mallet, M. Molinari, P. Fricoteaux, F. Martineau, M. Troyon, S. Zein El Abedin and F. Endres, Phys. Chem. Chem. Phys., 2008, 10, 6233 RSC.
- H. Q. Cao, L. D. Wang, Y. Qiu, Q. Z. Wu, G. Z. Wang and L. Zhang, ChemPhysChem, 2006, 7, 1500 CrossRef CAS PubMed.
- S. Z. E. Abedin and F. Endres, ChemPhysChem, 2012, 13, 250 CrossRef PubMed.
- W. C. Yoo and J. K. Lee, Adv. Mater., 2004, 16, 1097 CrossRef CAS.
- M. H. Seo, M. Park, K. Kim, J. Kim and J. Cho, Energy Environ. Sci., 2011, 4, 425 CAS.
- L. Y. Lim, N. Liu, Y. Cui and M. F. Toney, Chem. Mater., 2014, 26, 3739 CrossRef CAS.
- X. L. Wang, W. Q. Han, H. Chen and J. Bai, J. Am. Chem. Soc., 2011, 133, 20692 CrossRef CAS PubMed.
- R. Yi, J. Feng, D. Lv, M. Gordin, S. Chen, D. Choi and D. Wang, Nano Energy, 2013, 2, 498 CrossRef CAS PubMed.
Footnote |
| † Electronic supplementary information (ESI) available: Experimental procedures, SEM and HRTEM figures. See DOI: 10.1039/c4cc08722d |
| This journal is © The Royal Society of Chemistry 2015 |

