 Open Access Article
Creative Commons Attribution 3.0 Unported Licence
Real-time fluorescence visualization of slow tautomerization of single free-base phthalocyanines under ambient conditions†‡
T.
Ikeda
ab,
R.
Iino
ab and
H.
Noji
*ab
aDepartment of Applied Chemistry, School of Engineering, The University of Tokyo, Tokyo, Japan. E-mail: hnoji@appchem.t.u-tokyo.ac.jp
bCore Research for Evolutional Science and Technology, Japan Science and Technology Agency, Tokyo, Japan
First published on 20th May 2014
Abstract
The emission transition dipole moments of single-molecule free-base phthalocyanines at an air/glass interface were visualized using defocused wide-field fluorescence microscopy at a temporal resolution of 100–200 ms. Isolated molecules showed slow proton tautomerization, which is consistent with previous theoretical calculations in the gas phase, which predicted large activation energies.
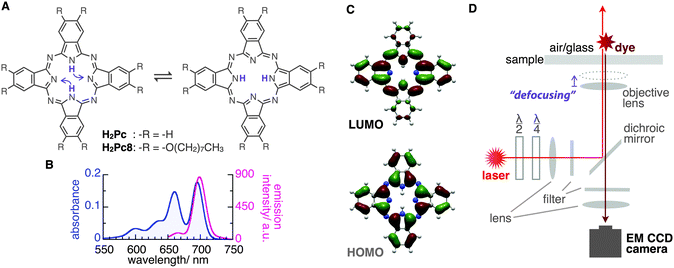
Phthalocyanines (Pcs) are macrocyclic molecules with π-electron conjugation similar to that of hemes in biological systems. Owing to their characteristic light absorption/emission, electronic properties, and planar structures, Pc derivatives often play a key role in various chemical systems such as electronic devices, catalysts, supramolecules, and in scanning tunnelling microscopy imaging.1–7 Additionally, tautomerization through inner-proton transfer in the central cavity of the molecule is known in the free-base phthalocyanine (H2Pc) both theoretically8–12 and experimentally13–16 (Fig. 1A). Interestingly, the orientation of the emission transition dipole moment (ETDM, or molecular orbital) rotates 90° with this tautomerization;11–15 therefore, the applications of these molecules as a molecular memory and a conductivity switch were expected.13–15 The timescale of the tautomerization of H2Pc in the crystal state was estimated by NMR to be fast, that is, 0.01 ms at around room temperature.16 On the other hand, by using density functional theory (DFT) calculations for the tautomerization of H2Pc in the gas phase, a large activation energy of 64.2 kJ mol−1 (27 in kBT289 units) has been predicted.10 This suggests a much slower rate of tautomerization for isolated H2Pc molecules. However, an early attempt to use fluorescence microscopy to visualize the ETDMs of single H2Pcs embedded into polymers or attached to silica failed,17 presumably because of the low rate of image acquisition (∼100 s) compared with the rate of tautomerization. In this study, we report the real-time visualization of the ETDMs of single H2Pcs using defocused wide-field microscopy at a temporal resolution of 100 ms.18–23 We found that a H2Pc derivative shows slow tautomerization at an air/octadecyl-group-modified glass interface, which is consistent with previous DFT calculations.
H2Pc is a bright fluorescent dye that shows strong absorption around the red region (650–700 nm) and deep-red emission peaks (around 700 nm)24 (Fig. 1B). We first tried visualizing the fluorescence emission from single H2Pc molecules at the air/bare-glass interface. H2Pc was bound to bare glass by the contact of toluene solution with an optically clean glass surface (see ESI‡). A wide-field fluorescence microscope equipped with a circularly polarized, 638 nm red laser light for excitation was used for observation. A deep red fluorescence emission signal (>650 nm) was imaged using an EMCCD camera at a time resolution of 100 or 200 ms (see ESI‡).
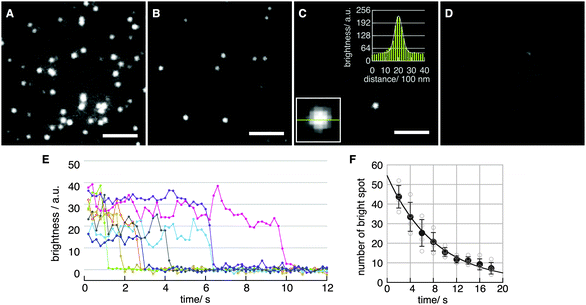
Fig. 2A–D show fluorescence images obtained with various concentrations of H2Pc in toluene at the binding step. The density of spots decreased with decreasing H2Pc concentration (Fig. 2A–D). In the absence of H2Pc (Fig. 1D), no clear spots were observed, indicating that these spots were not signals from contaminants in the solvent. The intensity profile of each spot was fitted well with a Gaussian curve (Fig. 2C, two insets). The full-width at half-maximum (FWHM) was 578 ± 64 nm (mean ± SD for N = 10 spots). Typical time courses of the fluorescence intensity of single spots are plotted in Fig. 2E. Single-step photo-bleaching, in which spots lost their intensity suddenly, were observed in the time courses. Such single-step photo-bleaching is a typical property of single fluorophores in single-molecule imaging. The signal-to-noise ratio (SNR)25,26 in the time courses was 7.1 ± 3.5 at 5 frames per second (fps) (mean ± SD for N = 18 spots). To further confirm that the observed spots corresponded to the fluorescence emission from single-molecule H2Pc, the distribution of the durations before the photo-bleaching was investigated by counting the number of spots in a unit area versus time. The distribution was reproduced well by a single-exponential decay, indicating a stochastic first-order reaction consistent with irreversible photo-bleaching of single molecules (Fig. 2F). Under our experimental conditions (room temperature, laser power of 11.6 μW μm−2), the time constant for photo-bleaching was 8.2 s. From these results, we concluded that fluorescence emission from single H2Pc molecules was visualized successfully with a temporal resolution of 100 ms.
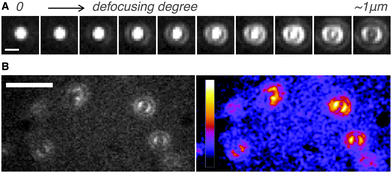
Next, we determined directly the ETDM of single H2Pc molecules through defocused wide-field imaging.18–23 The height of the objective lens was moved by ∼1 μm toward the sample plane to generate defocused images18 (Fig. 1D). A typical transition process from the focused image to the defocused image of single H2Pc molecules bound to a C18-glass, surface-modified with octadecyl groups (see ESI‡), is shown in Fig. 3A. As shown in Fig. 3B, anisotropic double-lobe-like patterns of single H2Pc molecules were observed in the defocused image. The double-lobe images are similar to those observed in the defocused imaging of fluorescent dyes such as rhodamine19 and perylenediimide,20–23 attached to a glass surface. In these dyes, it is known that the orientation of the double-lobe image indicates that of the ETDM.18–23 In theoretical calculations of the molecular orbitals of H2Pc, the LUMO (lowest unoccupied molecular orbital) has anisotropy in connection with the position of the two hydrogen atoms in the molecule (Fig. 1C).11,12 Although the two isomers are chemically identical,8–10 the tautomers are distinguishable because the anisotropy rotates by 90°. Therefore, the observation of a double-lobe pattern strongly suggests that both tautomerization and rotational motion of H2Pc on C18-glass are much slower than the timescale of observation (100 ms). On the other hand, not the double-lobe but a donut pattern was observed when the bare glass was used (not shown). Silanol groups of the silicate glass and adsorbed water on the surface may increase the rate of tautomerization of H2Pc. Alternatively, H2Pc may show much faster molecular rotation on the bare glass.
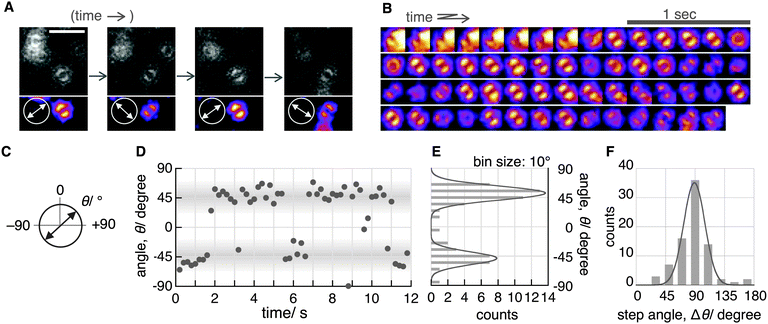
Although the double-lobe-like patterns of H2Pc were observed, H2Pc itself was not suitable for kinetic analysis owing to the slow lateral diffusion on the surface of the C18-glass on longer timescales (for 10 s, see Movie S1, ESI‡). Therefore, we used a H2Pc derivative, H2Pc8, which has eight octyl groups at peripheral positions of H2Pc (Fig. 1A), expecting a stronger van der Waals interaction with C18-glass. The optical properties such as absorption and emission of H2Pc8 were similar to those of H2Pc (see ESI‡), and, as expected, the lateral diffusion of H2Pc8 on C18-glass was suppressed effectively (see Movie S1, ESI‡). In defocused imaging of H2Pc8 at the air/C18-glass interface, most molecules showed the double-lobe pattern (92% of 789 spots; the residual 8% showed the donut pattern). Basically, the orientation of the double-lobe patterns was stationary and not changed during observation, indicating that the timescale of tautomerization and molecular rotation of H2Pc8 on the C18-glass is much longer than that of photo-bleaching (8.2 s). On the other hand, of the defocused images that formed the double-lobe pattern, 13% (97 spots) showed switching to another orientation during observation (Fig. 4A, Movie S2, ESI‡). The origin of two different populations, stationary and switchable, is unknown so far. They may come from the inhomogeneous properties of the C18 glass surface to which H2Pc8s are bound. A montaged image and a time course of the ETDM angle are shown in Fig. 4B–D. In the histogram of angle distribution, two peaks appeared in most cases (Fig. 4E). The difference in the angle between the two peaks was defined as the step angle, Δθ, for each molecule. The distribution of Δθ is shown in Fig. 4F. Through fitting with a Gaussian curve, the step angle for H2Pc8 was determined to be 89 ± 16° (mean ± SD, N = 81 molecules), strongly suggesting that switching arises from tautomerization (Fig. 1A and C). The average time before switching to the next orientation was 2.3 ± 3.9 s (mean ± SD, N = 265 events). Our results indicate that the rate of tautomerization is very slow compared with the reported value for H2Pc in the crystal state (≈0.01 ms at 298 K).16 In other words, the timescale of the tautomerization of H2Pc8 at the air/C18-glass interface at room temperature is a few seconds or longer. The activation energies of the fast tautomerization of H2Pc in the crystal state have been estimated to be 39 and 32 kJ mol−1 (16 and 13 in kBT289 units) for the α- and β-form crystals, respectively.16 However, through DFT calculations for the tautomerization of H2Pc in the gas phase, a larger value of 64.2 kJ mol−1 (27 in kBT289 units) has been predicted.10 The electronic state in the crystal must be different from that in a fully isolated environment such as the gas phase because of intermolecular π–π interactions caused by molecular packing.27,28 It is highly likely that our experimental conditions using the air/glass interface for the visualization of isolated H2Pcs are close to the gas-phase conditions used in the DFT calculations. If the frequency factor (A) in the Arrhenius equation (k = A exp(−Ea/kBT); k, rate constant; Ea, activation energy in kBT unit; kB, Boltzmann constant; T, temperature in K) is similar to the experimental value (1011–1012 s−1)16 in the crystal phase; the value by DFT means that k is much smaller. It corresponds to a time constant of 0.4–4.0 s. Therefore, our experimental results are consistent with those of DFT calculations.
We visualized the fluorescence emission from single free-base phthalocyanines at the air/glass interface under ambient conditions using optical microscopy. The single H2Pc was imaged as bright spots for several seconds with a temporal resolution of 100 ms. Tautomerization of H2Pc8 on a timescale much longer than 100 ms was observed at the air/C18-glass interface. Furthermore, intermittent ETDM switching with a step size of 90° was captured. We concluded that the timescale of tautomerization by proton transfer in H2Pc8 at the air/C18-glass interface at room temperature is a few seconds or longer. H2Pc would contribute to develop a molecular memory or a switch which works under ambient conditions if we can control this slow tautomerization by further chemical modifications and/or external stimuli.
This work was supported by CREST (Core Research for Evolutional Science and Technology) of the Japan Science and Technology Agency, and Grants-in-Aid for Scientific Research (No. 18074005 to H. N. and No. 24651167 to R. I.) from the Ministry of Education, Science, Sports, and Culture of Japan.
Notes and references
- G. de la Torre, C. G. Claessens and T. Torres, Chem. Commun., 2007, 2000–2015 RSC.
- K. J. Baeg, M. Binda, D. Natali, M. Caironi and Y. Y. Noh, Adv. Mater., 2013, 25, 4267–4295 CrossRef CAS PubMed.
- A. B. Sorokin, Chem. Rev., 2013, 113, 8152–8191 CrossRef CAS PubMed.
- G. Bottari, O. Trukhina, M. Ince and T. Torres, Coord. Chem. Rev., 2012, 256, 2453–2477 CrossRef CAS.
- P. D. Frischmann, K. Mahata and F. Wurthner, Chem. Soc. Rev., 2013, 42, 1847–1870 RSC.
- T. Komeda, H. Isshiki and J. Liu, Sci. Technol. Adv. Mater., 2010, 11, 054602 CrossRef.
- G. Baffou, A. J. Mayne, G. Comtet, G. Dujardin, L. Stauffer and P. Sonnet, J. Am. Chem. Soc., 2009, 131, 3210–3215 CrossRef CAS PubMed.
- K. A. Nguyen and R. Pachter, J. Phys. Chem. A, 2000, 104, 4549–4552 CrossRef CAS.
- H. Cortina, M. L. Senent and Y. G. Smeyers, J. Phys. Chem. A, 2003, 107, 8968–8974 CrossRef CAS.
- T. Strenalyuk, S. Samdal and H. V. Volden, J. Phys. Chem. A, 2008, 112, 4853–4860 CrossRef CAS PubMed.
- A. V. Kukhta, E. E. Kolesnik, I. N. Kukhta, A. E. Pochtenny, V. K. Dolgiy, G. A. Mousdis and N. Psaroudakis, Synth. Met., 2010, 160, 2361–2365 CrossRef CAS.
- A. Lee, D. Kim, S. H. Choi, J. W. Park, J. Y. Jaung and D. H. Jung, Mol. Simul., 2010, 36, 192–198 CrossRef CAS.
- A. Sperl, J. Kroger and R. Berndt, Angew. Chem., Int. Ed., 2011, 50, 5294–5297 CrossRef CAS PubMed.
- P. Liljeroth, J. Repp and G. Meyer, Science, 2007, 317, 1203–1206 CrossRef CAS PubMed.
- T. C. Niu and A. Li, J. Phys. Chem. Lett., 2013, 4, 4095–4102 CrossRef CAS.
- B. Wehrle and H. H. Limbach, Chem. Phys., 1989, 136, 223–247 CrossRef CAS.
- A. M. Chizhik, R. Jager, A. I. Chizhik, S. Bar, H. G. Mack, M. Sackrow, C. Stanciu, A. Lyubimtsev, M. Hanack and A. J. Meixner, Phys. Chem. Chem. Phys., 2011, 13, 1722–1733 RSC.
- M. Bohmer and J. Enderlein, J. Opt. Soc. Am. B, 2003, 20, 554–559 CrossRef CAS.
- D. Nishimura, Y. Takashima, H. Aoki, T. Takahashi, H. Yamaguchi, S. Ito and A. Harada, Angew. Chem., Int. Ed., 2008, 47, 6077–6079 CrossRef CAS PubMed.
- J. A. Hutchison, H. Uji-i, A. Deres, T. Vosch, S. Rocha, S. Muller, A. A. Bastian, J. Enderlein, H. Nourouzi, C. Li, A. Herrmann, K. Mullen, F. De Schryver and J. Hofkens, Nat. Nanotechnol., 2014, 9, 131–136 CrossRef CAS PubMed.
- H. Uji-i, S. M. Melnikov, A. Deres, G. Bergamini, F. De Schryver, A. Herrmann, K. Mullen, J. Enderlein and J. Hofkens, Polymer, 2006, 47, 2511–2518 CrossRef CAS.
- P. Dedecker, B. Muls, A. Deres, H. Uji-i, J. Hotta, M. Sliwa, J. P. Soumillion, K. Mullen, J. Enderlein and J. Hofkens, Adv. Mater., 2009, 21, 1079–1090 CrossRef CAS.
- A. Deres, G. A. Floudas, K. Mullen, M. Van der Auweraer, F. De Schryver, J. Enderlein, H. Uji-i and J. Hofkens, Macromolecules, 2011, 44, 9703–9709 CrossRef CAS.
- P. G. Seybold and M. Gouterma, J. Mol. Spectrosc., 1969, 31, 1–13 CrossRef CAS.
- H. Ueno, S. Nishikawa, R. Iino, K. V. Tabata, S. Sakakihara, T. Yanagida and H. Noji, Biophys. J., 2010, 98, 2014–2023 CrossRef CAS PubMed.
- The definition is as follows: SNR = (IS + IBG)/(σS2 − σBG2)1/2; IS, signal intensity; IBG, background intensity; σS2, variance for signal; σBG2, variance for background.
- J. Janczak and R. Kubiak, J. Alloys Compd., 1992, 190, 121–124 CrossRef CAS.
- R. Kubiak and J. Janczak, J. Alloys Compd., 1992, 190, 117–120 CrossRef CAS.
Footnotes |
| † Dedicated to Professor Seiji Shinkai on the occasion of his 70th birthday. |
| ‡ Electronic supplementary information (ESI) available: Details of optics and sample preparation. See DOI: 10.1039/c4cc02574a |
| This journal is © The Royal Society of Chemistry 2014 |


