Urchin-like Ce/Tb co-doped GdPO4 hollow spheres for in vivo luminescence/X-ray bioimaging and drug delivery†
Zhigao
Yi
ab,
Wei
Lu
c,
Chao
Qian
a,
Tianmei
Zeng
a,
Lingzhen
Yin
a,
Haibo
Wang
ab,
Ling
Rao
ab,
Hongrong
Liu
a and
Songjun
Zeng
*a
aCollege of Physics and Information Science and Key Laboratory of Low-dimensional Quantum Structures and Quantum Control of the Ministry of Education, Hunan Normal University, Changsha, Hunan, People's Republic of China. E-mail: songjunz@hunnu.edu.cn
bFaculty of Materials, Optoelectronics and Physics, Key Laboratory of Low-dimensional Materials and Application Technology (Ministry of Education), Xiangtan University, Xiangtan 411105, People's Republic of China
cDepartment of Applied Physics and Materials Research Center, The Hong Kong Polytechnic University, Hong Kong
First published on 30th June 2014
Abstract
In this paper, we report a self-sacrificing route for fabrication of the Ce/Tb co-doped GdPO4 hollow spheres under hydrothermal conditions using the Gd(OH)CO3:Ce/Tb precursor as a template and NH4H2PO4 as a phosphorus source. The X-ray diffraction (XRD) patterns show the amorphous crystal nature of the precursor and pure hexagonal phase of the hollow spheres. The microstructures of the as-prepared precursor and hollow spheres were characterized by transmission electron microscopy (TEM) and scanning TEM (STEM) assays. The results reveal the urchin-like morphology of the solid precursor and hollow spheres. Bright green emissions of the spheres have been detected using an ultraviolet (UV) lamp at 288 nm and the calculated CIE coordinates are (0.289, 0.491). The energy transfer mechanism of Ce and Tb ions in the GdPO4 host has been investigated. The quantum efficiency of the hollow spheres was measured to be 61% and the lifetime calculated as 6.94 ms. In addition, the magnetic mass susceptibilities and magnetization of the spheres are found to be 6.39 × 10⁻⁵ emu gOe−1 and 1.27 emu g−1 at 20 kOe, respectively. Owing to their excellent downshift luminescence properties, the as-prepared GdPO4:Ce/Tb hollow spheres have been successfully applied in in vivo luminescence and X-ray bioimaging for the first time. Moreover, three-dimensional (3D) in vivo X-ray bioimaging of the mouse can provide the accurate location from multiple directions. The high contrast ratio makes the spheres a promising X-ray contrast agent. Due to the hollow structure, these GdPO4:Ce/Tb hollow spheres were also used as drug delivery systems for doxorubicin (DOX) loading and release. The drug loading efficiency was measured to be 17% at a pH value of 7.4, and the pH-dependent drug release was studied. 47% of the loaded DOX was released within 10 h when pH = 5, while there was only 30% during the same time at pH = 7.4 and it took nearly 48 h to reach a comparable level. The different release nature gives these spheres a promising application in targeted therapy of tumors.
1. Introduction
Hollow nano-/micro-materials with controllable size and morphology have attracted increasing research interest in modern chemistry and materials research areas owing to their outstanding properties such as lower density, larger specific area, encapsulation ability and surface permeability.1–6 Therefore, these hollow structural materials have promising applications in various fields such as biotechnology, drug delivery, catalysis, fillers, photonic devices, electrochemical cells, and waste removal.7–14 With the development of these functional materials, a variety of fabricated methods have been exploited. However, among the various strategies, the template route is the most usual and efficient way of obtaining hollow structures. Of course, whether on the basis of hard templates (consisting of polystyrene, silica particles and carbon spheres)15–21 or building on soft templates (including supramolecules, surfactants and polymer vesicles),22–26 all of these strategies have exhibited some shortcomings. According to the former method, a large amount of time is necessary due to the multistep fabrication and removal of the templates. There is a huge challenge in controlling the shape and size of the final products through the latter method. In addition, hollow spherical nanocrystals can also be obtained by template free routes27 which make use of the mechanism of the Ostwald ripening process. In comparison with the methods mentioned above, the self-sacrificing template route can gather their advantages and achieve the ideal morphology.28–30Recently, many studies have focused on synthesizing hollow spherical rare-earth (RE) compounds.31–41 For instance, as was reported,33 Gd2O3 hollow microspheres with a uniform morphology and good dispersity have been successfully synthesized using a self-sacrificing method, and lanthanide ion (Ln3+) doped Gd2O3 microspheres show excellent luminescence capacity. In addition, Gd2O3 hollow spheres were fabricated by a homogeneous precipitation method where carbon spheres were utilized as templates and removed by calcination. The as-prepared spheres have been applied as positive T1 contrast agents for magnetic resonance imaging and as drug delivery host carriers for studying the drug loading/release properties of these hollow spheres, as well as their promising therapeutic applications. Besides, Gd3+-based hosts can also act as ideal candidates of contrast agents for X-ray imaging because of the huge K-edge values (GdK-edge = 50.2 keV) and the large X-ray absorption efficiency of the Gd element (at 80 keV, Gd = 5.57 cm2 g−1).42–44 Therefore, much more efforts have been made to exploit a new system of Gd3+-based hosts in conjugation with the hollow structure. As represented, GdVO4:Dy microspheres,37 GdF3 micro/nano-spheres,40 and Gd2O2S:Tb nanocapsules41 have been fabricated and exhibit unique microstructural and luminescent properties and application in bioimaging and drug loading/release capabilities. Very recently, Eu3+ doped GdPO4 hollow spheres came into our sight, but the workers have just shown their fluorescent and paramagnetic nature.30,46 However, integration of in vivo bioimaging and drug delivery into a system of Ln3+ doped GdPO4 hollow spheres has not been exploited. In addition, previous reports proved the high efficiency of energy transfer between Ce and Tb in phosphors, which inspired us to dope Ce and Tb into GdPO4 hosts for intense emissions and further bioimaging.
In this paper, Ce/Tb co-doped GdPO4 spheres with urchin-like hollow structure were fabricated using a typical self-sacrificing route with some modification. The crystal phase and microstructure of the precursor (carbonate hydroxide gadolinium, Gd(OH)CO3) and final products were studied firstly. Then, the downshift luminescence and paramagnetic properties of the as-prepared spheres were studied in detail. Furthermore, these as-prepared spheres were for the first time used for in vivo luminescence, X-ray, 3D X-ray bioimaging, and drug loading/release investigation. The results indicate that the obtained Ce/Tb co-doped GdPO4 hollow spheres may be a new generation of biolabels, contrast agents, drug delivery carriers and therapeutic agents.
2. Experimental
2.1 Chemicals and materials
The RE oxides Gd2O3, Ce2O3, and Tb2O3 were all of 99.99% purity and purchased from Sigma-Aldrich. The corresponding RE nitrides RE(NO3)3 were obtained via dissolving oxides into dilute nitric acid under heating with sequential stirring until the formation of a transparent solution. Evaporate the remaining solvent and prepare the final solution with a designed concentration of 0.5 M. The other chemicals (analytical grade) were bought from Sinopharm Chemical Reagent Co., China. All of these reagents were used directly with no further purification.2.2 Synthesis of the Gd(OH)CO3:Ce/Tb precursor
The urchin-like colloidal Gd(OH)CO3:Ce/Tb precursors with monodispersity were prepared by a modified homogeneous precipitation method utilizing urea [CO(NH2)2] as a precipitator.47 In a typical synthesis, the as-prepared Gd(NO3)3, Ce(NO3)3, and Tb(NO3)3 solution with a total amount of 1 mmol and a designed molar ratio of 75![[thin space (1/6-em)]](https://www.rsc.org/images/entities/char_2009.gif) :
:![[thin space (1/6-em)]](https://www.rsc.org/images/entities/char_2009.gif) 20
20![[thin space (1/6-em)]](https://www.rsc.org/images/entities/char_2009.gif) :
:![[thin space (1/6-em)]](https://www.rsc.org/images/entities/char_2009.gif) 5 were dissolved in 50 mL deionized (DI) water. 2.0 g of urea was then added into the former mixture with vigorous stirring. The solution was further stirred for another 2 h at room temperature. The obtained solution was then heated to 80 °C and maintained for 2 h in an oil bath. After the reaction was complete, the milky-white suspension was separated and collected by centrifugation. The impurities were washed with ethanol and DI water three times. The obtained precursor was dispersed in 20 mL of DI water for further use.
5 were dissolved in 50 mL deionized (DI) water. 2.0 g of urea was then added into the former mixture with vigorous stirring. The solution was further stirred for another 2 h at room temperature. The obtained solution was then heated to 80 °C and maintained for 2 h in an oil bath. After the reaction was complete, the milky-white suspension was separated and collected by centrifugation. The impurities were washed with ethanol and DI water three times. The obtained precursor was dispersed in 20 mL of DI water for further use.
2.3 Synthesis of the GdPO4:Ce/Tb hollow spheres
In a typical synthesis, the as-prepared Gd(OH)CO3:Ce/Tb water solution was labeled as solution A after ultrasonication for 30 min. 0.115 g of NH4H2PO4 and 0.1 g of cetyltrimethyl ammonium bromide (CTAB) were added into 20 mL of DI water under stirring to form a homogeneous solution B. Solutions A and B were then mixed together with vigorous agitation. Finally, 40 mL of the resulting mixture was transferred into a 50 mL stainless steel autoclave. The system was sealed and maintained at 200 °C for 15 h. After the reaction, the products were cooled to room temperature naturally and the final products were assembled in the bottom of the vessel. The supernatant solution was poured directly and the precipitates were separated and collected via centrifugation. The impurities were removed by washing with ethanol and DI water in sequence. The as-prepared GdPO4:Ce/Tb hollow spheres were dried in air at 60 °C for 24 h.2.4 Characterization
The crystal phases of the Gd(OH)CO3:Ce/Tb precursor and the GdPO4:Ce/Tb spheres were recorded by powder XRD using a D/max-γA system X-ray diffractometer at 40 kV and 250 mA with Cu-Kα radiation (λ = 1.54056 Å). The shape and size of these as-synthesized samples were observed using TEM and STEM (JEOL-2100F). Secondary electron images (SEI) in STEM mode were acquired. During the TEM assay, the composed elements of the spheres were detected via the energy-dispersive X-ray spectrum (EDS) affiliated to the TEM. The surface ligands of the samples were detected through a Fourier transform infrared spectrum (FTIR) employing a Magna 760 spectrometer (Nicolet). The luminescence spectra of the samples were recorded using a Zolix Analytical Instrument (fluoroSENS 9000A) equipped with a Xe lamp (400 W) at room temperature. After the luminescence assays, the luminescence decay curve of the GdPO4:Ce/Tb spheres was tested (major parameters: λex = 288 nm, λem = 543 nm, excitation/emission bandpass: 8 mm, and integrate time: 100 μs). A digital photograph of the water solution containing 1 wt% of the spheres was taken by a Canon digital camera under the excitation of a UV lamp at 253 nm in the dark. The magnetic properties of the as-prepared GdPO4:Ce/Tb spheres were detected via a vibrating sample magnetometer (VSM, Lake-shore 7410) and the applied field ranged from −20 to 20 kOe.2.5 In vivo luminescence bioimaging
For the purpose of measuring the feasibility of in vivo luminescence bioimaging based on the GdPO4:Ce/Tb spheres, a Kunming mouse was firstly anesthetized via intraperitoneal injection of a 100 μL 10 wt% pentobarbital sodium water solution. Then, the mouse was subcutaneously injected with 200 μL of the GdPO4:Ce/Tb aqueous solution (2 mg mL−1). After injection, in vivo luminescence bioimaging was observed through an in vivo imaging system (Bruker In-Vivo FX PRO). The luminescence bioimaging was captured using a bandpass filter (600/40 nm) with an exposure time of 5 s. All animal procedures comply with the institutional animal use and care regulations approved by the Laboratory Animal Center of Hunan.2.6 In vivo X-ray bioimaging
To demonstrate the X-ray bioimaging based on these GdPO4:Ce/Tb spheres, in vivo X-ray bioimaging was carried out. Then, another mouse was subcutaneously injected with 200 μL of the GdPO4:Ce/Tb aqueous solution (2 mg mL−1) for X-ray bioimaging at different sites. The X-ray bioimaging was also detected using an in vivo imaging system equipped with an X-ray imaging functionality with an operating voltage of 0–45 kVp. The X-ray bioimaging was recorded at the operating voltage of 45 kVp (filter = 0.8 mm and exposure time = 1 min). The 3D X-ray bioimaging was captured by a multimodal animal rotation system (MARS, per 10° ranging from 0 to 360°) and the images were exported as a video at 5 frames per second.2.7 In vitro drug loading and release
To measure the drug loading capabilities of the GdPO4:Ce/Tb hollow spheres, DOX (Shanghai Ekear Bio&Tech Co., Ltd) loading into the hollow spheres was done by adding 0.5 mg of these powders into 2 mL and 0.1 mg mL−1 of DOX phosphate buffer solution (PBS, pH = 7.4). The suspension was shaken for 24 h at room temperature for achieving the equilibrium state. The solution was then centrifuged at 12![[thin space (1/6-em)]](https://www.rsc.org/images/entities/char_2009.gif) 000 rpm for 10 min to collect the DOX-loaded spheres and remove the free DOX. The supernatant was retained and the concentration of DOX loaded on the hollow spheres was measured via the DOX characteristic absorption peak at 480 nm after subtracting the absorbance ascribed to the hollow spheres at the same wavelength.48,49 The UV-vis absorbance spectra were detected using a Lambda 750 UV/VIS spectrometer (PerkinElmer Inc.).
000 rpm for 10 min to collect the DOX-loaded spheres and remove the free DOX. The supernatant was retained and the concentration of DOX loaded on the hollow spheres was measured via the DOX characteristic absorption peak at 480 nm after subtracting the absorbance ascribed to the hollow spheres at the same wavelength.48,49 The UV-vis absorbance spectra were detected using a Lambda 750 UV/VIS spectrometer (PerkinElmer Inc.).
To investigate the DOX release kinetics, the obtained DOX loaded GdPO4:Ce/Tb hollow spheres were incubated in PBS with two pH values (5 and 7.4) and soaked all the time. At the designed time intervals, DOX released from the hollow spheres was collected by centrifugation and the amounts of released DOX in the supernatant were recorded by the UV-vis absorbance spectrum. All the measurements were performed three times and then the average values were taken.
3. Results and discussion
3.1 Structural characterization
As demonstrated in Scheme 1, the urchin-like Gd(OH)CO3:Ce/Tb precursor was obtained by a homogeneous precipitation method using urea as a precipitator. Then, the urchin-like GdPO4:Ce/Tb hollow spheres were prepared via a self-sacrificing template route in which the precursor interacted with the added NH4H2PO4 under hydrothermal conditions. The as-prepared spheres have been successfully applied in in vivo fluorescence, X-ray and 3D X-ray bioimaging. Moreover, the hollow structure of these spheres shows excellent drug loading and release capabilities.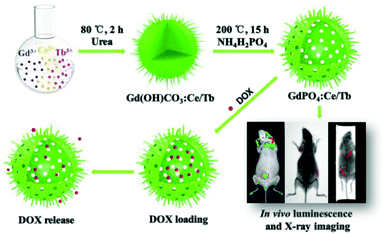 | ||
| Scheme 1 Scheme for the preparation process of GdPO4:Ce/Tb hollow spheres, in vivo luminescence and X-ray bioimaging, and drug loading/release. | ||
The crystal phases of the as-prepared samples were recorded by XRD. Fig. 1 shows the XRD results of the Gd(OH)CO3:Ce/Tb precursor and GdPO4:Ce/Tb hollow spheres. As shown in Fig. 1a, the XRD pattern of the precursor exhibits broad bands ranging from 15° to 60° indicating the amorphous structure of the precursors.50 The diffraction peaks of GdPO4:Ce/Tb hollow spheres (Fig. 1b) were well indexed to the pure hexagonal phase GdPO4 crystals and the relative diffraction intensities of these peaks were well coincident with the data cited by the Joint Committee on Powder Diffraction Standards (JCPDS, number 39-0232). The slight shifting towards the lower angle side of the diffraction peak is ascribed to the enlarged unit-cell volume of the GdPO4 matrix for the replacement of Gd3+ (r = 1.193 Å) by Ce3+ with relatively larger radius (r = 1.283 Å).51 Moreover, no other impurity peaks were detected from the XRD pattern, which implied the formation of the pure hexagonal phase GdPO4:Ce/Tb.
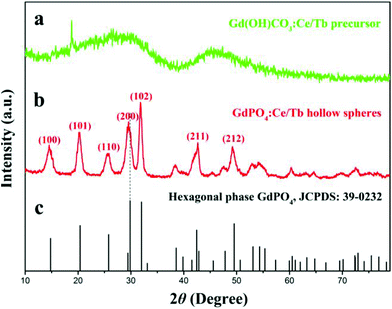 | ||
| Fig. 1 XRD patterns of (a) Gd(OH)CO3:Ce/Tb, (b) GdPO4:Ce/Tb, and (c) JCPDS card of the pure hexagonal phase GdPO4. | ||
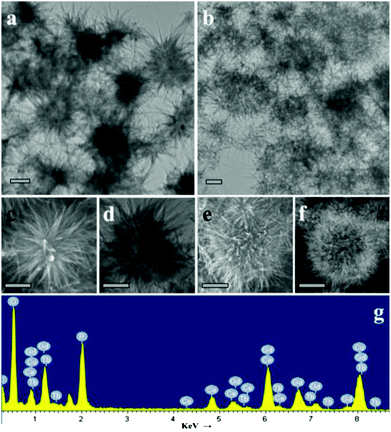
The shape and size of the as-prepared precursor and final products were characterized by TEM analysis. As shown in panels a and b of Fig. 2, typical TEM reveal the nearly spherical and prickly structures of both. In addition, SEI acquired in STEM mode (Fig. 2c and e) demonstrated that the surface of the precursor was made up of nanowires and the exterior of GdPO4:Ce/Tb was composed of nanorods. In comparison with the high-magnification TEM images of these two species, the interior of the precursor shows solid state and the final products are hollow, respectively (Fig. 2d and f). Of course, these changes of morphology should have contributed to the hydrothermal process via adding NH4H2PO4. Fig. 2g demonstrates the elemental composition of the GdPO4:Ce/Tb hollow spheres, indicating the presence of Gd, P, O, Ce, and Tb. Note that the detected Cu and C signals originate from the Cu grid of the TEM sample.
3.2 FTIR analysis
As shown in Fig. 3, the surface functional groups of the precursor and hollow spheres were identified by FTIR spectra. As demonstrated in Fig. 3a, the characteristic peaks at 3393, 1506, 1410, 1077, 843, and 742 cm−1 are ascribed to OH (ν), CO (νas), CO (νas), CO (νs), CO (δ), and OH (δ), where the ν, νas, νs, and δ stand for stretch, asymmetric stretch, symmetric stretch, and deformation, respectively, implying that the composition of the precursor should be Gd(OH)CO3.35,39 However, the absorption bands at 620 and 543 cm−1 and a broad band at 1067 cm−1 reveal the presence of phosphate groups (Fig. 3b).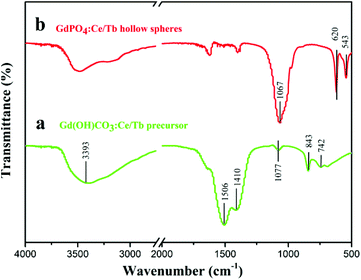 | ||
| Fig. 3 The FTIR spectra of (a) the Gd(OH)CO3:Ce/Tb precursor and (b) the GdPO4:Ce/Tb hollow spheres. | ||
3.3 Photoluminescence (PL) and magnetization properties
The luminescence of Ce/Tb co-doped phosphors and the energy transfer from Ce to Tb ions have been well investigated by previous studies.52,53 As demonstrated in Fig. 4, energy transfer firstly occurred between Ce3+ and Ce3+ under UV irradiation at 288 nm. Then, energy transferred from Ce3+ (5d) to Tb3+. The 5D4 levels of Tb3+ radioactively transferred to the lower energy levels of 7FJ (J = 0, 1, 2, 3, 4, 5, 6). Owing to the high efficiency of these energy transfers in the Ce/Tb co-doped GdPO4 host, the digital photograph (inset of Fig. 5) of the water solution containing 1 wt% GdPO4:Ce/Tb spheres exhibits intense eye-visible green light under the excitation of a 253 nm UV lamp in the dark at room temperature. Fig. 5 exhibits the excitation and emission spectra of these hollow spheres. The excitation spectrum (green curve) shows a weak band centered at 222 nm and a high and broad band ranging from 250 to 350 nm with a maximum at 288 nm. The former is attributed to the 4f8–4f75d transitions of Tb3+ and the latter are ascribed to the 5d–4f transition of Ce3+. The bright and strong emissions of Tb3+ (488 nm: 5D4–7F6, the strongest 543 nm: 5D4–7F5, 587 nm: 5D4–7F4, and 596 nm: 5D4–7F3) are yielded under the excitation of 288 nm. A further color coordinate calculation reveals that the luminescence of the GdPO4:Ce/Tb hollow spheres is located in the region of green in Commission Internationale de I'Eclairage 1931 chromaticity (CIE 1931) and the calculated coordinates are (0.289, 0.491). In addition, the quantum yield of the GdPO4:Ce/Tb spheres was measured to be 61%, further implying energy transfer from Ce3+ to Tb3+ in the GdPO4 host.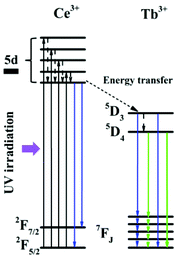 | ||
| Fig. 4 Energy transfer mechanism and downshift luminescence emission of the GdPO4:Ce/Tb hollow spheres under the excitation of a UV lamp at 288 nm. | ||
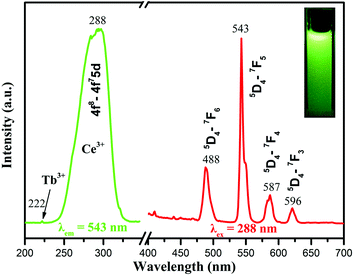 | ||
| Fig. 5 Excitation and emission spectra of the GdPO4:Ce/Tb hollow spheres. The inset is a digital photograph of aqueous solution (1 wt%) under 253 nm UV lamp irradiation in a sealed room. | ||
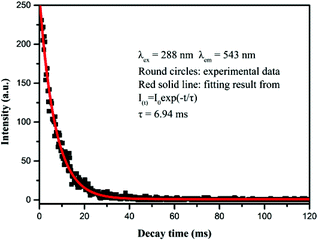
Moreover, the decay curve of the as-prepared spheres has been detected. As shown in Fig. 6, the square dots represent the experimental data and the red solid line indicates the fitting result. The luminescence lifetime can be estimated using the following formula: I(t) = I0exp(−t/τ), where τ stands for the lifetime of the emitted lanthanide ions. The lifetime shown by the fitting result via the formula is 6.94 ms.
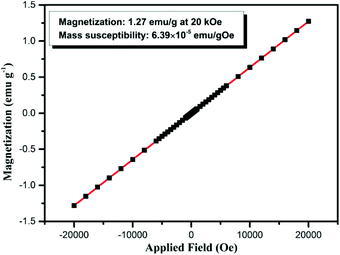
In addition to the excellent luminescence properties, the GdPO4:Ce/Tb hollow spheres also possess attractive paramagnetic nature which is ascribed to the large magnetic moment of Gd3+ (7.94μB)50 in the GdPO4 host. Fig. 7 shows the magnetization of the GdPO4:Ce/Tb hollow spheres as a function of applied field ranging from −20 to 20 kOe at room temperature. As demonstrated, these GdPO4:Ce/Tb hollow spheres show paramagnetic properties at room temperature. The paramagnetic behavior of the GdPO4:Ce/Tb hollow spheres is primarily ascribed to the seven unpaired inner 4f electrons, which are closely bound to the nucleus and effectively shielded by the outer closed shell electrons from the crystal field.42–45 The magnetic mass susceptibility and magnetization of the GdPO4:Ce/Tb hollow spheres are ∼6.39 × 10⁻⁵ emu gOe−1 and ∼1.27 emu g−1 at 20 kOe, respectively. The results indicate that the GdPO4:Ce/Tb hollow spheres can act as contrast agents for magnetic resonance imaging.
3.4 In vivo luminescence bioimaging
The toxicity and biocompatibility of the hollow spheres in the same GdPO4 host lattice have been studied in previous work,39 in which the GdPO4:Eu spheres show good biocompatibility and have been proved to be non-toxic materials for biomedical applications. To measure the feasibility of the GdPO4:Ce/Tb hollow spheres for in vivo luminescence bioimaging, a Kunming mouse was subcutaneously injected with 200 μL of the aqueous solution of GdPO4:Ce/Tb hollow spheres (2 mg mL−1). After 5 min injection, the mouse was observed for in vivo luminescence bioimaging using a multi-modal in vivo imaging system (Bruker In-Vivo FX PRO) under the excitation of a 400 W xenon lamp. Fig. 8a and 8b show the in vivo whole-body images of the mouse without and with subcutaneous injection of the GdPO4:Ce/Tb hollow spheres, respectively. A high-contrast luminescence signal in the injected site was observed (labeled by red-dotted circles). Fig. 8c shows the overlay image, where the luminescence signals match well with the whole body of the mouse. Of course, the autofluorescence of the mouse and the lower penetration of short excitation wavelengths are inevitable shortcomings, limiting the application in in vivo whole-body luminescence bioimaging of these downshifting nanocrystals.3.5 In vivo X-ray bioimaging
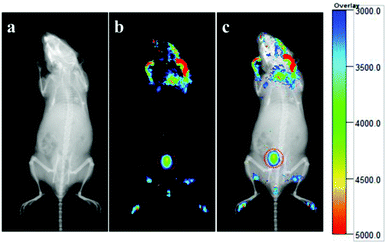
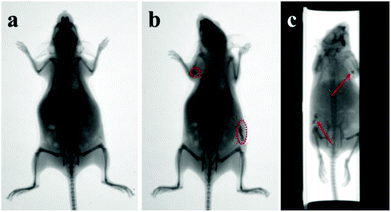
Apart from in vivo luminescence bioimaging, the GdPO4:Ce/Tb hollow spheres can be used as X-ray bioimaging contrast agents due to the large K-edge values and the X-ray absorption coefficient of the Gd element. To reveal the in vivo X-ray bioimaging of these spheres, a Kunming mouse was subcutaneously injected with PBS containing these spheres. After 5 min injection, in vivo X-ray bioimaging was performed using a multifunctional in vivo imaging system at a voltage of 45 kVp. Fig. 9 shows the in vivo X-ray bioimaging in a Kunming mouse. As observed in Fig. 9a, there is no X-ray signal detected in the untreated mouse. The high-contrast X-ray absorption contrasts indicated by the red-dotted circles (Fig. 9b) are observed after subcutaneous injection with spheres. Moreover, 3D in vivo X-ray bioimaging of the mouse (in the ESI, Movie S1†) was captured using the protocol model in the multifunctional in vivo imaging system and an image of it is shown in Fig. 9c. These 3D X-ray bioimagings can demonstrate the accurate location of the spheres from multiple directions and have a promising application in clinical treatment.3.6 Drug loading and release
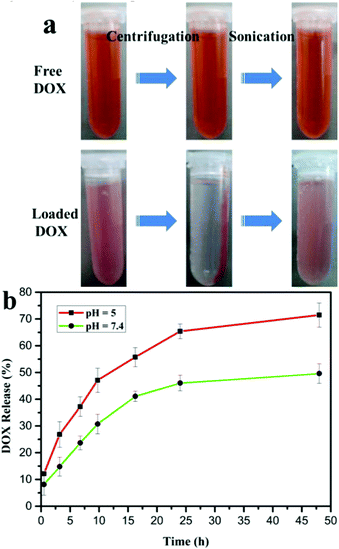
Owing to the hollow structure of the spheres, efforts have been made to utilize the as-prepared hollow spheres as drug carriers. As demonstrated by the former FTIR result, large amounts of hydroxyl groups are on the surface of the GdPO4:Ce/Tb hollow spheres after the hydrothermal reaction. Therefore, the obtained spheres with negative charges of hydroxyl groups can easily interact with the positively charged DOX molecules with protonated primary amine group under neutral conditions. Thus, the aforementioned electrostatic interaction provides the main driving force for DOX loading. In addition, the size distribution of the as-prepared hollow spheres in PBS (0.25 mg mL−1) was tested by dynamic light scattering. As shown in Fig. S1,† the diameter of the spheres was measured to be 865.6 ± 40.25 nm. To qualitatively study the loading efficiency of DOX, the solution containing the spheres and DOX with the designed molar ratio was measured by centrifugation and then sonication. As shown in the left panel of Fig. 10a, in comparison with the free DOX, the mixture of the spheres and DOX exhibits a weaker red color. In addition, a reddish precipitate and a nearly transparent liquid were observed after centrifugation indicating the binding of DOX on the spheres. As a comparison in the upper panel of Fig. 10a, the free DOX shows no obvious color change and precipitate. The latter quantified assay of the DOX loading efficiency is based on UV-vis spectra according to the characteristic adsorption peak of DOX at 480 nm, due to the linear relation between the amounts of DOX and the intensity of the adsorption peak at 480 nm.37,39 The DOX loading efficiency of the spheres was calculated to be 17%.The accumulated DOX release of the DOX-loaded GdPO4:Ce/Tb hollow spheres was detected in PBS with two pH values (5 and 7.4). As shown in Fig. 10b, at pH = 5, 47% of the loaded DOX was released within 10 h, whereas at pH = 7.4, there was only 30% during the same time and it took nearly 48 h to reach a comparable level (47%). In addition, to assess the stability of the particles, the solution of these particles after drug release was used for FE-SEM analysis (shown in Fig. S2†). It can be seen that the particles are still urchin-like and the structure is maintained without any damage. The aforementioned electrostatic interaction is weaker under acidic conditions than under neutral conditions, which is a major factor of rapid release at pH = 5. These differences in release nature indicate that the release rate of physically bound DOX is faster in tumor areas (mildly acidic conditions) than in blood (neutral environments),37 which makes the DOX-loaded hollow spheres a promising application in targeted therapy of tumors.
4. Conclusion
In summary, hexagonal phase Ce/Tb co-doped GdPO4 spheres with urchin-like hollow structure have been fabricated by a self-sacrificing route. The obtained spheres exhibit bright green emissions at the excitation of 288 nm and paramagnetic properties (the magnetic mass susceptibility: 6.39 × 10⁻⁵ emu gOe−1 and magnetization: 1.27 emu g−1 at 20 kOe). The as-prepared spheres have been successfully applied in in vivo luminescence, X-ray, and 3D X-ray bioimaging. The DOX loading efficiency was measured to be 17% at pH = 7.4 and the release ratio was calculated to be 47% within 10 h (pH = 5). The excellent drug loading and release capabilities make the hollow spheres ideal candidates for targeted therapy.Acknowledgements
This work was supported by the National Natural Science Foundation of China (no. 51102202 and 31370736), the Specialized Research Fund for the Doctoral Program of Higher Education of China (no. 20114301120006) and the Hunan Provincial Natural Science Foundation of China (no. 12JJ4056), and the Scientific Research Fund of the Hunan Provincial Education Department (13B062).Notes and references
- Y. Chen, H. R. Chen, L. M. Guo, D. P. Zeng, Y. B. Tian, F. Chen, J. W. Feng and J. L. Shi, ACS Nano, 2010, 4, 6001 CrossRef CAS PubMed.
- G. Jia, M. Yang, Y. H. Song, H. P. You and H. J. Zhang, Cryst. Growth Des., 2009, 9, 301 CAS.
- Z. X. Wang, L. M. Wu, M. Chen and S. X. Zhou, J. Am. Chem. Soc., 2009, 131, 11276 CrossRef CAS PubMed.
- X. W. Lou, L. A. Archer and Z. C. Yang, Adv. Mater., 2008, 20, 3987 CrossRef CAS.
- K. Cheng and S. H. Sun, Nano Today, 2010, 5, 183 CrossRef CAS.
- L. Li, R. Z. Ma, N. Iyi, Y. Ebina, K. Takada and T. Sasaki, Chem. Commun., 2006, 3215 CAS.
- S. Kidambi, J. H. Dai, J. Li and M. L. Bruening, J. Am. Chem. Soc., 2004, 126, 2658 CrossRef CAS PubMed.
- Y. Wang, L. Cai and Y. Xia, Adv. Mater., 2005, 17, 473 CrossRef CAS.
- Z. Z. Yang, Z. W. Niu, Y. F. Lu, Z. B. Hu and C. C. Han, Angew. Chem., Int. Ed., 2003, 42, 1943 CrossRef CAS PubMed.
- Y. S. Li, J. L. Shi, Z. L. Hua, H. R. Chen, M. L. Ruan and D. S. Yan, Nano Lett., 2003, 3, 609 CrossRef CAS.
- X. F. Yu, D. S. Wang, Q. Peng and Y. D. Li, Chem. Commun., 2011, 47, 8094 RSC.
- H. J. Kim, K. Choi II., A. Q. Pan, D. Kim II., H. R. Kim, K. M. Kim, C. W. Na, G. Z. Cao and J. H. Lee, J. Mater. Chem., 2011, 21, 6549 RSC.
- Y. Q. Wang, G. Z. Wang, H. Q. Wang, C. H. Liang, W. P. Cai and L. D. Zhang, Chem. – Eur. J., 2010, 16, 3497 CrossRef CAS PubMed.
- Y. F. Zhu, J. L. Shi, W. H. Shen, X. P. Dong, J. W. Feng, M. L. Ruan and Y. S. Li, Angew. Chem., Int. Ed., 2005, 44, 5083 CrossRef CAS PubMed.
- Y. G. Sun, B. T. Mayers and Y. N. Xia, Nano Lett., 2002, 2, 481 CrossRef CAS.
- K. J. Son, H. J. Yoon, J. H. Kim, W. D. Jang, Y. Lee and W. G. Koh, Angew. Chem., Int. Ed., 2011, 50, 11968 CrossRef CAS PubMed.
- S. Han, K. Sohn and T. Hyeon, Chem. Mater., 2001, 12, 3337 CrossRef.
- S. H. Tang, X. Q. Huang, X. L. Chen and N. F. Zheng, Adv. Funct. Mater., 2010, 20, 2442 CrossRef CAS.
- X. M. Sun and Y. D. Li, Angew. Chem., Int. Ed., 2004, 43, 3827 CrossRef CAS PubMed.
- X. M. Sun, J. F. Liu and Y. D. Li, Chem. – Eur. J., 2006, 12, 2039 CrossRef CAS PubMed.
- H. S. Qian, G. F. Lin, Y. X. Zhang, P. Gunawan and R. Xu, Nanotechnology, 2007, 18, 355602 CrossRef.
- D. P. Yang, S. H. Chen, P. Huang, X. S. Wang, W. Q. Jiang, O. Pandoli and D. X. Cui, Green Chem., 2010, 12, 2038 RSC.
- Q. Peng, Y. J. Dong and Y. D. Li, Angew. Chem., Int. Ed., 2003, 42, 3027 CrossRef CAS PubMed.
- J. Liu, S. B. Hartono, Y. G. Jin, Z. Li, G. Q. Lu and S. Z. Qiao, J. Mater. Chem., 2010, 20, 4595 RSC.
- S. S. Feng, Z. Y. Ren, Y. L. Wei, B. J. Jiang, Y. Liu, L. Y. Zhang, W. B. Zhang and H. G. Fu, Chem. Commun., 2010, 46, 6276 RSC.
- J. Bao, Y. Liang, Z. Xu and L. Si, Adv. Mater., 2003, 15, 1832 CrossRef CAS.
- P. L. Lu, Y. C. Chen, T. W. Ou, H. H. Chen, H. C. Tsai, C. J. Wen, C. L. Lo, S. P. Wey, K. J. Lin, T. C. Yen and G. H. Hsiue, Biomaterials, 2011, 32, 2213 CrossRef CAS PubMed.
- F. Zhang, Y. F. Shi, X. H. Sun, D. Y. Zhao and G. D. Stucky, Chem. Mater., 2009, 21, 5237 CrossRef CAS.
- Y. D. Yin, R. M. Rioux, C. K. Erdonmez, S. Hughes, G. A. Somorjai and A. P. Alivisatos, Science, 2004, 304, 711 CrossRef CAS PubMed.
- L. H. Zhang, M. L. Yin, H. P. You, M. Yang, Y. H. Song and Y. J. Huang, Inorg. Chem., 2011, 50, 10608 CrossRef CAS PubMed.
- G. Tian, Z. J. Gu, X. X. Liu, L. J. Zhou, W. Y. Yin, L. Yan, S. Jin, W. L. Ren, G. M. Xing, S. J. Li and Y. L. Zhao, J. Phys. Chem. C, 2011, 115, 23790 CAS.
- C. C. Huang, T. Y. Liu, C. H. Su, Y. W. Lo, J. H. Chen and C. S. Yeh, Chem. Mater., 2008, 20, 3840 CrossRef CAS.
- G. Jia, H. P. You, K. Liu, Y. H. Zheng, N. Guo and H. J. Zhang, Langmuir, 2010, 26, 5122 CrossRef CAS PubMed.
- P. P. Yang, S. L. Gai, Y. C. Liu, W. X. Wang, C. X. Li and J. Lin, Inorg. Chem., 2011, 50, 2182 CrossRef CAS PubMed.
- F. He, P. P. Yang, D. Wang, C. X. Li, N. Niu, S. L. Gai and M. L. Zhang, Langmuir, 2011, 27, 5616 CrossRef CAS PubMed.
- L. H. Zhang, G. Jia, H. P. You, K. Liu, M. Yang, Y. H. Song, Y. H. Zheng, Y. J. Huang, N. Guo and H. J. Zhang, Inorg. Chem., 2010, 49, 3305 CrossRef CAS PubMed.
- X. J. Kang, D. M. Yang, P. A. Ma, Y. L. Dai, M. M. Shang, D. L. Geng, Z. Y. Cheng and J. Lin, Langmuir, 2013, 29, 1286 CrossRef CAS PubMed.
- W. Feng, L. D. Sun, Y. W. Zhang and C. H. Yan, Small, 2009, 5, 2057 CrossRef CAS PubMed.
- Z. H. Xu, Y. Cao, C. X. Li, P. A. Ma, X. F. Zhai, S. S. Huang, X. J. Kang, M. M. Shang, D. M. Yang, Y. L. Dai and J. Lin, J. Mater. Chem., 2011, 21, 3686 RSC.
- R. C. Lv, S. L. Gai, Y. L. Dai, N. Niu, F. He and P. P. Yang, ACS Appl. Mater. Interfaces, 2013, 5, 10806 CAS.
- H. Y. Chen, T. Moore, B. Qi, D. C. Colvin, E. K. Jelen, D. A. Hitchcock, J. He, O. T. Mefford, J. C. Gore, F. Alexis and J. N. Anker, ACS Nano, 2013, 7, 1178 CrossRef CAS PubMed.
- S. B. Yu and A. D. Watson, Chem. Rev., 1999, 99, 2353 CrossRef CAS PubMed.
- S. J. Zeng, M. K. Tsang, C. F. Chan, K. L. Wong and J. H. Hao, Biomaterials, 2012, 33, 9232 CrossRef CAS PubMed.
- S. J. Zeng, H. B. Wang, W. Lu, Z. G. Yi, L. Rao, H. R. Liu and J. H. Hao, Biomaterials, 2014, 35, 2934 CrossRef CAS PubMed.
- G. Z. Ren, S. J. Zeng and J. H. Hao, J. Phys. Chem. C, 2011, 115, 20141 CAS.
- D. M. Yang, X. J. Kang, P. A. Ma, Y. L. Dai, Z. Y. Hou, Z. Y. Cheng, C. X. Li and J. Lin, Biomaterials, 2013, 34, 1601 CrossRef CAS PubMed.
- J. G. Li, Q. Zhu, X. D. Li, X. D. Sun and Y. Sakka, Acta Mater., 2011, 59, 3688 CrossRef CAS.
- Z. Liu, X. M. Sun, N. Nakayama-Ratchford and H. J. Dai, ACS Nano, 2007, 1, 50 CrossRef CAS PubMed.
- Z. Liu, A. C. Fan, K. Rakhra, S. Sherlock, A. Goodwin, X. Y. Chen, Q. W. Yang, D. W. Felsher and H. J. Dai, Angew. Chem., Int. Ed., 2009, 48, 7668 CrossRef CAS PubMed.
- S. Viswanathan, Z. Kovacs, K. N. Green, S. J. Ratnakar and A. D. Sherry, Chem. Rev., 2010, 110, 2960 CrossRef CAS PubMed.
- R. D. Shannon, Acta Crystallogr., Sect. A: Cryst. Phys., Diffr., Theor. Gen. Cryst., 1976, 32, 751 CrossRef.
- C. M. Zhang, C. X. Li, C. Peng, R. T. Chai, S. S. Huang, D. M. Yang, Z. Cheng and J. Lin, Chem. – Eur. J., 2010, 16, 5672 CrossRef CAS PubMed.
- C. X. Li, X. M. Liu, P. P. Yang, C. M. Zhang, H. Z. Lian and J. Lin, J. Phys. Chem. C, 2008, 112, 2904 CAS.
Footnote |
| † Electronic supplementary information (ESI) available. See DOI: 10.1039/c4bm00158c |
| This journal is © The Royal Society of Chemistry 2014 |

