Water-soluble D-glucuronic acid coated ultrasmall mixed Ln/Mn (Ln = Gd and Dy) oxide nanoparticles and their application to magnetic resonance imaging
Badrul Alam
Bony
a,
Jong Su
Baeck
b,
Yongmin
Chang
*bc,
Ji Eun
Bae
c,
Kwon Seok
Chae
cd and
Gang Ho
Lee
*ac
aDepartment of Chemistry, College of Natural Sciences, Kyungpook National University (KNU), Taegu 702-701, South Korea. E-mail: ghlee@mail.knu.ac.kr; Fax: +82-53-950-6330; Tel: +82-53-950-5340
bDepartment of Molecular Medicine and Medical & Biological Engineering, School of Medicine, KNU and Hospital, Taegu 702-701, South Korea. E-mail: ychang@knu.ac.kr
cDepartment of Nanoscience and Nanotechnology, KNU, Taegu 702-701, South Korea
dDepartment of Biology Education, Teachers’ College, KNU, Taegu 702-701, South Korea
First published on 23rd June 2014
Abstract
Ultrasmall lanthanide oxide nanoparticles are promising materials as new magnetic resonance imaging (MRI) contrast agents because of their appreciable longitudinal (r1) or transverse (r2) water proton relaxivities at ultrasmall particle diameters. Two systems of D-glucuronic acid coated ultrasmall Ln/Mn (Ln = Gd and Dy) oxide nanoparticles with an average particle diameter of 2.0 nm were explored. The D-glucuronic acid coated ultrasmall Gd/Mn oxide nanoparticles showed strong positive contrast enhancements in 1.5 tesla T1 MR images while the D-glucuronic acid coated ultrasmall Dy/Mn oxide nanoparticles showed appreciable negative contrast enhancements in 1.5 tesla T2 MR images, proving their potential as T1 and T2 MRI contrast agents, respectively.
Introduction
Magnetic resonance imaging (MRI) is a very powerful imaging technique for observing the anatomy of the body at a high spatial resolution. The technique is non-invasive because it uses a non-ionizing radiofrequency radiation that excites water proton spins.1,2 An MRI contrast agent further enhances MR signal intensities by inducing water proton relaxations.3,4 These agents are extremely useful in locating, diagnosing, and treating diseases such as cancer.Among the numerous nanoparticles that have been investigated so far,5–14 ultrasmall lanthanide oxide nanoparticles are especially promising materials because of their appreciable water proton relaxivities even at ultrasmall particle diameters.12–14 Note that only ultrasmall nanoparticles can be excreted through the renal system, which is essential for clinical applications.15 This is the result of the compact 4f-orbitals close to the nucleus of the lanthanides,16 making the magnetic properties of lanthanide oxide nanoparticles almost insensitive to particle diameter and surface conditions.
So far lanthanide oxide nanoparticles made of single elements have been mostly studied.12–14,17,18 Two prototypical examples include gadolinium oxide and dysprosium oxide nanoparticles.12–14,17,18 They have been considered to be potential T1 and T2 MRI contrast agents, respectively, because the former showed a large longitudinal water proton relaxivity (r1)14 of 10–15 mM−1 s−1 whereas the latter showed a large transverse water proton relaxivity (r2)17,18 of 20–60 mM−1 s−1. This is because Gd3+ (8S7/2) has 7 unpaired 4f-electrons and Dy3+ (6H15/2) has a large total electron magnetic moment of ∼10.6μB.19 Note that longitudinal (or T1) water proton relaxation can be strongly accelerated by a slow electron spin motion as in Gd3+ (8S7/2), which is closely matched with the slow water proton spin relaxation, whereas transverse (or T2) water proton relaxation can be strongly accelerated by the fluctuation of a local magnetic field generated by a nanoparticle with a large magnetic moment.3,4,20–23
In this study Mn2+ was mixed into gadolinium oxide and dysprosium oxide nanoparticles. Two systems of D-glucuronic acid coated ultrasmall Ln/Mn (Ln = Gd and Dy) oxide nanoparticles were investigated to find out their potential as MRI contrast agents. Mixed Ln/Mn (Ln = Gd and Dy) oxide nanoparticles were studied due to the following reason. Since Ln2O3 nanoparticles (Ln = Gd and Dy) are paramagnetic, r1 and/or r2 values of Gd2O3 and Dy2O3 nanoparticles could be improved by mixing paramagnetic manganese into them owing to 5 unpaired 3d-electrons of Mn2+ (6S5/2). Mn2+ itself has a large spin magnetic moment and is almost non-toxic. For this reason, a MnCl2 aqueous solution is used as a T1 MRI contrast agent in animals.6,24–26 In nanoparticle form, MnO nanoparticles also showed their potential as MRI contrast agents.27,28 Therefore, D-glucuronic acid coated ultrasmall Ln/Mn oxide nanoparticles are expected to show improved performance as MRI contrast agents. In order to study the feasibility of D-glucuronic acid coated ultrasmall Ln/Mn oxide nanoparticles as T1 and/or T2 MRI contrast agents, magnetic properties, in vitro cytotoxicity, and water proton relaxivities were measured. To find the effectiveness of these nanoparticles as MRI contrast agents, 1.5 tesla MR images were finally measured after injecting each aqueous sample solution into a mouse tail vein.
Experimental
Chemicals
All chemicals including GdCl3·xH2O (99.9%), Dy(NO3)3·5H2O (99.9%), MnCl2·4H2O (>98%), NaOH (>99.9%), triethylene glycol (99%), D-glucuronic acid (>99.9%), and an H2O2 aqueous solution (50 wt% in water) were purchased from Sigma-Aldrich and used as received. Triple distilled water was used for washing nanoparticle products and for preparing aqueous MRI sample solutions.Synthesis of D-glucuronic acid coated ultrasmall Ln/Mn (Ln = Gd and Dy) oxide nanoparticles
2.5 mmol of GdCl3·xH2O (or 2.5 mmol of Dy(NO3)3·5H2O) and 2.5 mmol of MnCl2·4H2O were added into 40 mL of triethylene glycol in a 100 mL three-necked flask. The mixture was heated to 80 °C and magnetically stirred under atmospheric conditions until the two precursors were completely dissolved in the solvent. In a separate flask, 15 mmol of NaOH was dissolved in 10 mL of triethylene glycol and this NaOH solution was added drop-wise into the precursor solution. The reaction mixture was magnetically stirred for 2 hours. Then, 7.5 mL of the H2O2 aqueous solution was added drop-wise into the reaction solution using a syringe. After the addition of H2O2, the reaction continued at 80 °C for 2 hours. The reaction solution became cloudy due to nanoparticle formation.For surface coating of the nanoparticles with D-glucuronic acid, 5 mmol of D-glucuronic acid was added to the above nanoparticle solution. The reaction solution was magnetically stirred at 100 °C for 6 hours under atmospheric conditions. After this, the solution was cooled to room temperature and transferred into a 1 L beaker containing 500 mL of ethanol. The solution was magnetically stirred for half an hour. Once the D-glucuronic acid coated nanoparticles settled to the bottom of the beaker, the top transparent solution was decanted and the remaining sample solution was again washed with 500 mL of ethanol. This washing procedure was repeated three times. The solvent molecules, and remaining OH−, Gd3+, Mn2+, Cl−, and D-glucuronic acid were removed during the washing process. The first half volume of each sample was used to prepare an aqueous sample solution for the MRI experiment and the remaining half volume was converted to powder form by drying it in air for various characterizations.
Characterization
High resolution transmission electron microscopy (HRTEM) images of D-glucuronic acid coated ultrasmall Ln/Mn (Ln = Gd and Dy) oxide nanoparticles were acquired using a microscope (JEOL, JEM-2100F) operating at 200 kV. A drop of nanoparticle solution dispersed in ethanol was put onto a carbon film supported on a 200 mesh copper grid, using a micropipette (Eppendorf, 2–20 μL) and allowed to dry in air at room temperature. The copper grid with the nanoparticle sample was then mounted inside a vacuum chamber for imaging. A multi-purpose X-ray diffractometer (MP-XRD) (Philips, X'PERT PRO MRD) with unfiltered CuKα (λ = 0.154184 nm) radiation was used to evaluate the crystal structure of the nanoparticles. The scanning step in 2θ was 0.033° and the scan range in 2θ was 15–100°. An inductively coupled plasma atomic emission spectroscopy (ICPAES, Thermo Jarrell Ash Co., IRIS/AP) was used to determine the metal (i.e. Gd, Dy, and Mn) concentrations in aqueous sample solutions. To measure these, ∼0.7 g of a sample solution was treated with 3 mL of concentrated HNO3 and the treated solution was heated at 50–60 °C until the nanoparticles were completely dissolved in the solution. Then, a 2–3% HNO3 solution was further added to the sample solution for dilution. The final solution was weighed and used for ICPAES measurement. The attachment of D-glucuronic acid to the nanoparticles was investigated by taking Fourier transform infrared (FT-IR) absorption spectra using a FT-IR absorption spectrometer (Mattson Instruments, Inc., Galaxy 7020A). To record the FT-IR absorption spectra (400–4000 cm−1), pellets of powder samples in KBr were prepared. A thermo-gravimetric analyzer (TGA) (TA Instruments, SDT-Q600) was used to estimate the amount of surface coating. The TGA curve was recorded between room temperature and 900 °C while flowing air over the sample. The amount of surface coating by D-glucuronic acid was estimated from the mass drop in the TGA curve after taking into account the water desorption between room temperature and ∼105 °C. A superconducting quantum interference device (SQUID) magnetometer (MPMS-7, Quantum Design) was used to measure the magnetic properties of the nanoparticles. Both magnetization (M) versus applied field (H) (i.e. M–H) curves (−5 ≤ H ≤ 5 tesla) at temperatures (T) of 5 and 300 K and zero-field-cooled (ZFC) M–T curves (5 ≤ T ≤ 300 K) at H = 10 Oersted (Oe) were recorded. To measure both M–H and M–T curves, each powder sample was weighed and loaded inside a non-magnetic gelatin capsule. A very small diamagnetic contribution from the capsule had a negligible contribution to the overall M, which was dominated by the sample. Mass-corrected (or net) M of the nanoparticles in a powder sample was obtained using their net mass estimated from the TGA curve.Relaxivity and map image measurements
R1 and R2 map images as well as T1 and T2 relaxation times were measured using a 1.5 tesla MRI instrument (GE 1.5 T Signa Advantage, GE medical System) equipped with a knee coil (EXTREM). The original sample solution was diluted with triply distilled water and a series of aqueous sample solutions with different Ln concentrations (Ln = Gd and Dy) were prepared (i.e. 0.5, 0.25, 0.125, and 0.0625 mM for Gd and 1.0, 0.5, 0.25, 0.125, and 0.0625 mM for Dy). Then, both the map images and the relaxation times were measured using these solutions. The r1 and r2 relaxivities were estimated from the slopes of the 1/T1 and 1/T2 plots versus the combined (Ln + Mn) concentration, respectively. The measurement parameters were as follows: the external MR field (H) = 1.5 tesla, the temperature (T) = 22 °C, the number of acquisition (NEX) = 1, the field of view (FOV) = 16 cm, the phase FOV = 0.5, the matrix size = 256 × 128, the slice thickness = 5 mm, the pixel spacing = 0.625 mm, the pixel band width = 122.10, the repetition time (TR) = 2000 ms, and the echo time (TE) = 9 ms.In vitro cytotoxicity measurement
The cellular toxicity of D-glucuronic acid coated ultrasmall Ln/Mn (Ln = Gd and Dy) oxide nanoparticles was measured using a CellTiter-Glo Luminescent Cell Viability Assay (Promega, WI, USA). In this assay, the intracellular ATP was quantified using a luminometer (Victor 3, Perkin-Elmer). Both human prostate cancer (DU145) and normal mouse hepatocyte (NCTC1469) cell lines were used. Cells were seeded on a 24-well cell culture plate and incubated for 24 hours (5% CO2, 37 °C). Three test solutions (10, 100, and 200 μM (Ln + Mn)) (Ln = Gd and Dy) were prepared by diluting an original aqueous sample solution with a sterile phosphate-buffered saline (PBS) solution. Approximately 2 μL of each test solution was used to treat the cell culture media. The treated cell culture media were then incubated for 48 hours. The viability of each cell was measured and normalized with respect to the control cell, which was not treated with the sample solution. The measurement was repeated two times for each test solution to obtain average cell viabilities.In vivo biodistribution measurement
An in vivo biodistribution study was performed by injecting an aqueous solution of D-glucuronic acid coated ultrasmall Gd/Mn oxide nanoparticles as a bolus (0.1 mmol per kg) into a tail vein. Fifteen ICR mice (weight, 30–35 g) were used. The mice were anesthetized and euthanized by exsanguination from the vena cava at 15 minutes, 3, 6, 12, and 48 hours after tail vein injection. Three mice were used for each time point in order to obtain average Gd concentrations in blood, liver, kidneys, bladder, and spleen. Gd concentrations were determined by digesting tissues with HNO3 and H2O2 (1![[thin space (1/6-em)]](https://www.rsc.org/images/entities/char_2009.gif) :
:![[thin space (1/6-em)]](https://www.rsc.org/images/entities/char_2009.gif) 1) at 180 °C for 120 minutes and measuring concentrations in diluted solutions by using an ICPAES.
1) at 180 °C for 120 minutes and measuring concentrations in diluted solutions by using an ICPAES.
Measurement of in vivo MR images at 1.5 tesla
A 1.5 tesla MRI instrument (GE 1.5 T Signa Advantage, GE medical system) was used to measure MR images of a mouse. The animal experiment was carried out under the permission and guidance of the KNU Animal Committee. ICR female mice (ICR = Institute of Cancer Research, USA) with a weight of ∼30 g were used for the MR image measurements. For imaging, each mouse was anesthetized by 1.5% isoflurane in oxygen. Measurement was made before and after injection of an aqueous sample solution into a mouse tail vein. The injection dose was typically ∼0.1 mmol kg−1 of (Ln + Mn) (Ln = Gd and Dy). After the measurement, each mouse was revived from anaesthesia and placed in a cage with free access to both food and water. During measurement, the temperature of each mouse was maintained at ∼37 °C using a warm water blanket. The measurement parameters were as follows: H = 1.5 tesla, T = 37 °C, NEX = 3–4, FOV = 100 mm, phase FOV = 0.5, matrix size = 320 × 290, slice thickness = 1–2 mm, spacing gap = 0–0.5 mm, pixel bandwidth = 15.63, TR = 11 and 3200 ms for T1 and T2 MR images, respectively, and TE = 3.2 and 40 ms for T1 and T2 MR images, respectively.Results and discussion
Particle diameter (d), crystal structure, and composition
ICPAES analysis showed that mole composition was 49.9% Gd![[thin space (1/6-em)]](https://www.rsc.org/images/entities/char_2009.gif) :
:![[thin space (1/6-em)]](https://www.rsc.org/images/entities/char_2009.gif) 50.1% Mn in D-glucuronic acid coated ultrasmall Gd/Mn oxide nanoparticles and 58.6% Dy
50.1% Mn in D-glucuronic acid coated ultrasmall Gd/Mn oxide nanoparticles and 58.6% Dy![[thin space (1/6-em)]](https://www.rsc.org/images/entities/char_2009.gif) :
:![[thin space (1/6-em)]](https://www.rsc.org/images/entities/char_2009.gif) 41.4% Mn in D-glucuronic acid coated ultrasmall Dy/Mn oxide nanoparticles. These mole compositions were almost similar to those of the precursor ions used in the syntheses within an experimental error limit. The HRTEM images of D-glucuronic acid coated ultrasmall Ln/Mn (Ln = Gd and Dy) oxide nanoparticles are shown in Fig. 1. Nanoparticles were nearly monodisperse in particle diameter with an average particle diameter (davg) of 2.0 nm for both D-glucuronic acid coated ultrasmall Ln/Mn (Ln = Gd and Dy) oxide nanoparticles (Table 1).
41.4% Mn in D-glucuronic acid coated ultrasmall Dy/Mn oxide nanoparticles. These mole compositions were almost similar to those of the precursor ions used in the syntheses within an experimental error limit. The HRTEM images of D-glucuronic acid coated ultrasmall Ln/Mn (Ln = Gd and Dy) oxide nanoparticles are shown in Fig. 1. Nanoparticles were nearly monodisperse in particle diameter with an average particle diameter (davg) of 2.0 nm for both D-glucuronic acid coated ultrasmall Ln/Mn (Ln = Gd and Dy) oxide nanoparticles (Table 1).
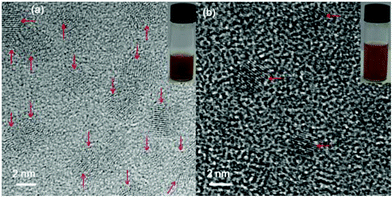 | ||
| Fig. 1 HRTEM images of the D-glucuronic acid coated ultrasmall (a) Gd/Mn and (b) Dy/Mn oxide nanoparticles. The corresponding aqueous sample solutions were inserted. Arrows indicate nanoparticles. | ||
| Nanoparticle | d avg (nm) | Magnetic properties | ||
|---|---|---|---|---|
| Magnetism | Magnetization (emu g−1) | |||
| 5 K | 300 K | |||
| Gd/Mn | 2.0 | Paramagnetic | 173.4 | 7.4 |
| Dy/Mn | 2.0 | Paramagnetic | 134.6 | 10.0 |
The XRD patterns of the powder samples were broad and amorphous as shown in Fig. 2. This is likely due to ultrasmall particle diameters.29 However, sharp peaks were observed, corresponding to an orthorhombic LnMnO3 (Ln = Gd and Dy) after the TGA analyses, as shown at the top of each XRD pattern in Fig. 2. Similar results have been observed in Gd/Mn oxide nanoparticles synthesized by a sol–gel method,30–33 supporting our results. In the case of ultrasmall Dy/Mn oxide nanoparticles, an additional small peak (labelled as “&” in Fig. 2b) was observed and assigned as Dy2MnO5. This peak appeared at high annealing temperatures above 900 °C before.30 The estimated cell constants of LnMnO3 were a = 5.318 Å, b = 5.816 Å, and c = 7.404 Å for Ln = Gd and a = 5.277 Å, b = 5.832 Å, and c = 7.387 Å for Ln = Dy, which are all consistent with reported values.34,35
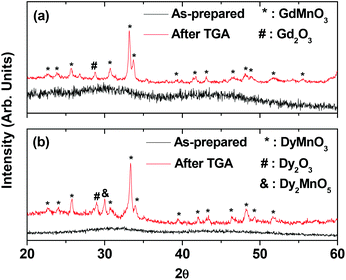 | ||
| Fig. 2 XRD patterns of the as-prepared (bottom) and the TGA-treated (top) D-glucuronic acid coated ultrasmall (a) Gd/Mn and (b) Dy/Mn oxide nanoparticles. | ||
The composition (i.e. chemical formula) of the as-synthesized nanoparticles is assigned as Ln2Mn2O5 (Ln = Gd and Dy) because the Mn2+ precursor was used in the synthesis and Ln![[thin space (1/6-em)]](https://www.rsc.org/images/entities/char_2009.gif) :
:![[thin space (1/6-em)]](https://www.rsc.org/images/entities/char_2009.gif) Mn mole ratios of the as-synthesized nanoparticles were nearly 1
Mn mole ratios of the as-synthesized nanoparticles were nearly 1![[thin space (1/6-em)]](https://www.rsc.org/images/entities/char_2009.gif) :
:![[thin space (1/6-em)]](https://www.rsc.org/images/entities/char_2009.gif) 1 from ICPAES analysis. The higher oxidation states of Mn such as +3 in LnMnO3 and +4 in Ln2MnO5 that were observed after TGA analysis are likely due to further oxidation of Mn2+ by O2 at high temperatures because MnO nanoparticles were produced under reaction conditions similar to the present study.28
1 from ICPAES analysis. The higher oxidation states of Mn such as +3 in LnMnO3 and +4 in Ln2MnO5 that were observed after TGA analysis are likely due to further oxidation of Mn2+ by O2 at high temperatures because MnO nanoparticles were produced under reaction conditions similar to the present study.28
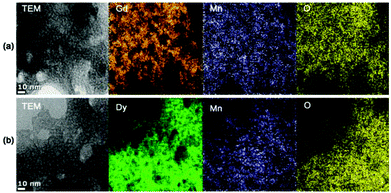
Low resolution TEM and elemental map images of D-glucuronic acid coated ultrasmall Ln/Mn (Ln = Gd and Dy) oxide nanoparticles were obtained and are shown in Fig. 3. The nanoparticles were so small that an elemental map image of each individual nanoparticle could not be obtained. Note that the particle diameter should generally be larger than 5 nm to obtain adequate signal to noise ratio for an elemental map image of each nanoparticle. Therefore, we obtained overall elemental map images of a collection of nanoparticles. As expected, homogeneous and identical elemental map images for all elements (i.e. Ln, Mn, O) were obtained for both ultrasmall Ln/Mn oxide nanoparticles, supporting that the as-synthesized nanoparticles are likely Ln2Mn2O5 nanoparticles but not a physical mixture of Ln2O3 and MnO nanoparticles.
Surface coating
Surface coating of the ultrasmall Ln/Mn (Ln = Gd and Dy) oxide nanoparticles with D-glucuronic acid, which is a pre-requisite for biomedical applications, was confirmed by the FT-IR absorption spectra of powder samples shown in Fig. 4. The characteristic IR stretches of C–H at 2915 cm−1, C![[double bond, length as m-dash]](https://www.rsc.org/images/entities/char_e001.gif) O at 1610 cm−1, and C–O at 1090 cm−1 showed the presence of D-glucuronic acid in the nanoparticles. The red shift of the C
O at 1610 cm−1, and C–O at 1090 cm−1 showed the presence of D-glucuronic acid in the nanoparticles. The red shift of the C![[double bond, length as m-dash]](https://www.rsc.org/images/entities/char_e001.gif) O stretch by 95 cm−1 from that of a free D-glucuronic acid (1705 cm−1) showed that the –COOH group of D-glucuronic acid was chemically bonded to a nanoparticle. This red shift was also observed in other metal oxide nanoparticles coated by various ligands with –COOH groups,36–39 supporting our results.
O stretch by 95 cm−1 from that of a free D-glucuronic acid (1705 cm−1) showed that the –COOH group of D-glucuronic acid was chemically bonded to a nanoparticle. This red shift was also observed in other metal oxide nanoparticles coated by various ligands with –COOH groups,36–39 supporting our results.
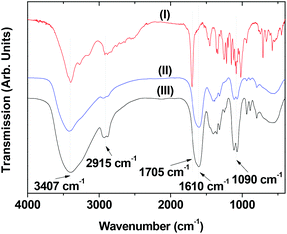 | ||
| Fig. 4 FT-IR absorption spectra of (I) free D-glucuronic acid, D-glucuronic acid coated ultrasmall (II) Gd/Mn and (III) Dy/Mn oxide nanoparticles. | ||
Sufficient surface coating is crucial for biomedical applications. The amount of surface coating was estimated from the mass drop in the TGA curve shown in Fig. 5. The TGA curves showed that the surface coating amount by D-glucuronic acid was 52.3% in weight percent for the ultrasmall Gd/Mn oxide nanoparticles and 37.7% for the ultrasmall Dy/Mn oxide nanoparticles after taking into account the water desorption between room temperature and ∼105 °C. These results indicate that the nanoparticles were sufficiently coated with D-glucuronic acid. The grafting density corresponding to the number of D-glucuronic acids coated per unit surface area of a nanoparticle40 was estimated to be 7.3 nm−2 for the ultrasmall Gd/Mn oxide nanoparticles and 4.6 nm−2 for the ultrasmall Dy/Mn oxide nanoparticles. These were calculated using the mole percent weighted average bulk densities, calculated using bulk densities41 of Gd2O3 (= 7.407 g cm−3), Dy2O3, (= 7.81 g cm−3), and MnO (= 5.45 g cm−3) and the average particle diameter (= 2.0 nm) estimated from HRTEM images. The estimated grafting densities were all larger than 1.0, confirming that the nanoparticles were sufficiently coated with D-glucuronic acid.40 The remaining mass in each TGA curve corresponds to the net mass of the nanoparticle core in a surface coated nanoparticle, which was estimated to be 35.8% for the ultrasmall Gd/Mn oxide nanoparticles and 47.1% for the ultrasmall Dy/Mn oxide nanoparticles. These net masses were used in estimating the net (or mass-corrected) magnetizations of the ultrasmall Ln/Mn oxide (Ln = Gd and Dy) nanoparticles in the D-glucuronic acid coated ultrasmall Ln/Mn oxide nanoparticles.
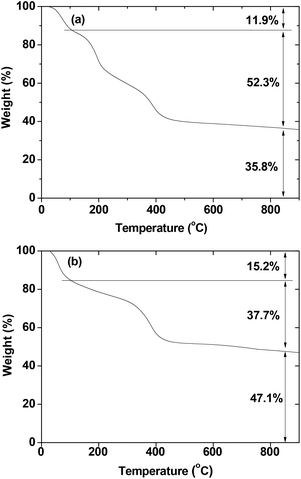 | ||
| Fig. 5 TGA curves of the D-glucuronic acid coated ultrasmall (a) Gd/Mn and (b) Dy/Mn oxide nanoparticles. | ||
Magnetic properties
The magnetic properties of the ultrasmall Ln/Mn (Ln = Gd and Dy) oxide nanoparticles were characterized by recording both M–H curves (−5 ≤ H ≤ 5 tesla) at T = 5 and 300 K and ZFC M–T curves (5 ≤ T ≤ 330 K) using the powder samples. The net magnetizations of the nanoparticles were obtained using the net masses of the nanoparticles estimated from the corresponding TGA curves as mentioned before. These net magnetizations were used in plotting both the M–H (Fig. 6a) and the ZFC M–T (Fig. 6b) curves. Both the coercivities and the remanences in the M–H curves were zero (i.e. no hysteresis). This lack of hysteresis and also the absence of a magnetic transition down to T = 5 K in the M–T curves indicate that the as-prepared nanoparticles are paramagnetic down to 5 K. From the M–H curves, the magnetizations of the ultrasmall Ln/Mn oxide nanoparticles at H = 5 tesla and at T = 5 and 300 K were estimated and are provided in Table 1. As shown in Table 1, fairly good magnetizations at 300 K were observed, which are responsible for the appreciable or large water proton relaxivities observed in the present nanoparticles.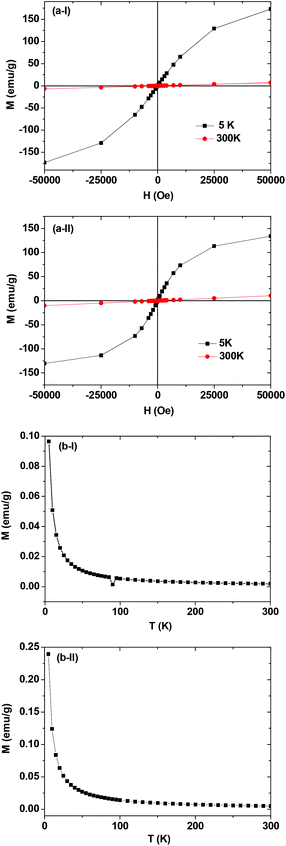 | ||
| Fig. 6 Mass-corrected (a) M–H and (b) ZFC M–T curves of the D-glucuronic acid coated ultrasmall (I) Gd/Mn and (II) Dy/Mn oxide nanoparticles. | ||
Relaxivities and map images
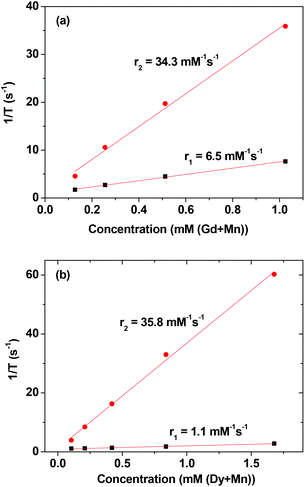
Both inverse longitudinal (1/T1) and inverse transverse (1/T2) water proton relaxation times were plotted as a function of combined (Ln + Mn) (Ln = Gd and Dy) concentration in Fig. 7. The r1 and r2 values were then estimated from the corresponding slopes and are provided in Table 2. The r1 and r2 values of ultrasmall Gd2O3 and Dy2O3 nanoparticles are also provided in Table 2. As can be seen in Table 2, a slight improvement in the r1 value and a large improvement in the r2 value were observed in ultrasmall Gd/Mn oxide nanoparticles, while a slight improvement in the r1 value but a slight decrease in the r2 value were observed in ultrasmall Dy/Mn oxide nanoparticles. As given in Table 2, the MnO nanoparticles have r1 = 7.02 s−1 mM−1 and r2 = 47.97 s−1 mM−1,28 and therefore helped to improve the r1 and/or r2 values of Gd2O3 and Dy2O3 nanoparticles by mixing Mn2+ into them, except for the r2 value of Dy/Mn oxide nanoparticles because the r2 value of Dy/Mn nanoparticles slightly decreased with respect to those of Dy2O3 and MnO nanoparticles. However, the r2 value of Dy/Mn nanoparticles is still appreciable. As expected from the observed r1 and r2 values, the D-glucuronic acid coated ultrasmall Gd/Mn oxide nanoparticles showed clear dose-dependent contrast enhancements in both the R1 and R2 map images as shown in Fig. 8a, whereas the D-glucuronic acid coated ultrasmall Dy/Mn oxide nanoparticles showed clear dose-dependent contrast enhancements only in the R2 map images as shown in Fig. 8b, implying that the former could possibly be used as a T1 and perhaps as a T2 MRI contrast agent, while the latter would only be suitable as a T2 MRI contrast agent.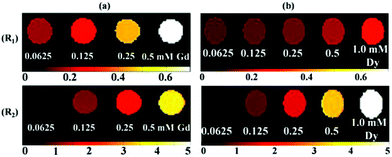 | ||
| Fig. 8 The R1 and R2 map images of the D-glucuronic acid coated ultrasmall (a) Gd/Mn and (b) Dy/Mn oxide nanoparticles as a function of Ln concentration (Ln = Gd and Dy). | ||
In vitro cytotoxicity
Both the aqueous sample solutions of the D-glucuronic acid coated ultrasmall Ln/Mn (Ln = Gd and Dy) oxide nanoparticles were non-toxic for combined concentration ranges up to 200 μM (Ln + Mn) in both the DU145 and NCTC1469 cell lines as shown in Fig. 9. This level of cytotoxicity was sufficient for the in vivo MRI experiments.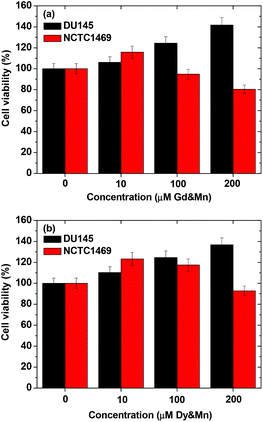 | ||
| Fig. 9 Cell viability of the D-glucuronic acid coated ultrasmall (a) Gd/Mn and (b) Dy/Mn oxide nanoparticles using DU145 and NCTC1469 cell lines. | ||
In vivo biodistribution of nanoparticles
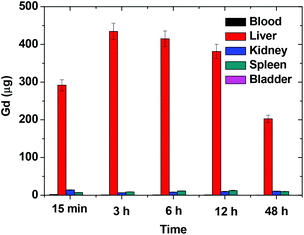
The in vivo biodistribution of D-glucuronic acid coated ultrasmall Gd/Mn oxide nanoparticles in blood, liver, kidneys, bladder, and spleen is provided in Fig. 10. In contrast to our expectation for complete renal excretion due to small size, nanoparticles were not rapidly excreted through the renal system. Main accumulations of nanoparticles were observed in the liver. Nanoparticle concentration in the liver decreased 12 hours after intravenous injection. Small accumulations of nanoparticles in the spleen and kidneys were also observed. We think that this accumulation was likely due to large nanoparticles in size distribution.In vivo MR images of a mouse at 1.5 tesla
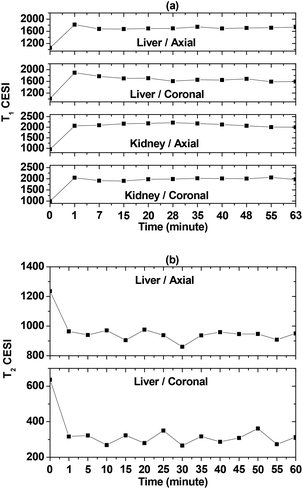
To determine the effectiveness of the D-glucuronic acid coated ultrasmall Ln/Mn (Ln = Gd and Dy) oxide nanoparticles as MRI contrast agents, in vivo MR experiments were performed at 1.5 tesla MR field. T1 MR images were taken using an aqueous sample solution of the D-glucuronic acid coated ultrasmall Gd/Mn nanoparticles because of their large r1 value whereas T2 MR images were obtained using an aqueous sample solution of the D-glucuronic acid coated ultrasmall Dy/Mn nanoparticles because of their large r2 value. Each MRI sample solution was injected into a mouse tail vein and a series of 1.5 tesla MR images were obtained as a function of time. The results are provided in Fig. 11. Strong positive (i.e. brighter) contrast enhancements in both the liver and kidneys were observed in both the axial and coronal T1 MR images using the D-glucuronic acid coated ultrasmall Gd/Mn oxide nanoparticles (Fig. 11a). On the other hand, appreciable negative (i.e. darker) contrast enhancements in the liver were observed in both the axial and coronal T2 MR images using the D-glucuronic acid coated ultrasmall Dy/Mn oxide nanoparticles (Fig. 11b).In order to more clearly see the contrast enhancement signal intensity (CESI) in the MR images, the CESI was plotted as a function of time up to 60 (or 63) minutes. Pronounced positive CESIs in both the liver and kidneys were observed in both the axial and coronal T1 MR images of the D-glucuronic acid coated ultrasmall Gd/Mn oxide nanoparticles (Fig. 12a). In the case of the D-glucuronic acid coated ultrasmall Dy/Mn oxide nanoparticles, appreciable negative CESIs in the liver were observed in both axial and coronal T2 MR images (Fig. 12b). T1 and T2 CESI values did not return to the original value within 60 (or 63) minutes, but may possibly return to the original values after 3 hours because nanoparticle samples with davg = 1.75 nm had been excreted through the renal system within 3 hours in the previous study.42 These results suggest that the D-glucuronic acid coated ultrasmall Gd/Mn oxide nanoparticles are potential T1 MRI contrast agents whereas the D-glucuronic acid coated ultrasmall Dy/Mn oxide nanoparticles are potential T2 MRI contrast agents.
Conclusions
In summary, biocompatible and water-soluble D-glucuronic acid coated ultrasmall Ln/Mn (Ln = Gd and Dy) oxide nanoparticles were synthesized. The composition of the as-synthesized nanoparticles was suggested to be Ln2Mn2O5. The average core particle diameter of both the D-glucuronic acid coated Ln/Mn (Ln = Gd and Dy) oxide nanoparticles was estimated to be 2.0 nm. We explored the possibility of these nanoparticles as new potential MRI contrast agents by evaluating their magnetic properties, cytotoxicity, water proton relaxivities, and in vivo MR images at 1.5 tesla MR field.(1) The D-glucuronic acid coated ultrasmall Ln/Mn (Ln = Gd and Dy) oxide nanoparticles were paramagnetic with appreciable magnetizations at room temperature.
(2) Due to Mn mixing, a slight improvement in the r1 value and a large improvement in the r2 value were observed in ultrasmall Gd/Mn oxide nanoparticles, while a slight improvement in the r1 value but a slight decrease in the r2 value were observed in ultrasmall Dy/Mn oxide nanoparticles. As a result, large r1 and r2 values in the D-glucuronic acid coated ultrasmall Gd/Mn oxide nanoparticles, and a small r1 value and a large r2 value in D-glucuronic acid coated ultrasmall Dy/Mn oxide nanoparticles were observed.
(3) In vivo MR images at 1.5 tesla were obtained after injection of each aqueous sample solution into a mouse tail vein. Clear positive contrast enhancements in the T1 MR images were observed using the D-glucuronic acid coated ultrasmall Gd/Mn oxide nanoparticles whereas appreciable negative contrast enhancements in the T2 MR images were observed using D-glucuronic acid coated ultrasmall Dy/Mn oxide nanoparticles. These results suggest that the D-glucuronic acid coated ultrasmall Gd/Mn oxide nanoparticles are potential T1 (and also possibly T2) MRI contrast agents whereas D-glucuronic acid coated ultrasmall Dy/Mn oxide nanoparticles are potential T2 MRI contrast agents.
Acknowledgements
This study was supported by the Basic Science Research Program (grant no. 2014-005837 to YC and 2013R1A1A4A03004511 to GHL) and the Basic Research Laboratory (BRL) Program (2013R1A4A1069507) through the National Research Foundation funded by the Ministry of Education, Science, and Technology. This study was also supported in part by the R&D program of MKE/KEIT (grant no. 10040393, development and commercialization of molecular diagnostic technologies for lung cancer through clinical validation). The authors wish to thank the Korea Basic Science Institute for the use of their HRTEM and XRD.Notes and references
- R. H. Hashemi, W. G. Bradley and C. J. Lisanti, MRI: The Basics, Lippincott Williams & Wilkins, New York, 2nd edn, 2004 Search PubMed.
- R. Weissleder and U. Mahmood, Radiology, 2001, 219, 316 CrossRef CAS PubMed.
- R. B. Lauffer, Chem. Rev., 1987, 87, 901 CrossRef CAS.
- P. Caravan, J. J. Ellison, T. J. McMurry and R. B. Lauffer, Chem. Rev., 1999, 99, 2293 CrossRef CAS PubMed.
- C. F. G. C. Geraldes and S. Laurent, Contrast Media Mol. Imaging, 2009, 4, 1 CrossRef CAS PubMed.
- G. J. Strijkers, W. J. M. Mulder, G. A. F. van Tilborg and K. Nicolay, Anti-Cancer Agents Med. Chem., 2007, 7, 291 CrossRef CAS.
- I. Coroiu, Al. Darabont and D. E. Demco, Appl. Magn. Reson., 1998, 15, 531 CrossRef CAS.
- J. Lodhia, G. Mandarano, N. J. Ferris, P. Eu and S. F. Cowell, Biomed. Imaging Interv. J., 2010, 6, e12 CAS.
- Q. A. Pankhurst, N. T. K. Thanh, S. K. Jones and J. Dobson, J. Phys. D: Appl. Phys., 2009, 42, 224001 CrossRef.
- A. G. Roca, R. Costo, A. F. Rebolledo, S. Veintemillas-Verdaguer, P. Tartaj, T. González-Carreño, M. P. Morales and C. J. Serna, J. Phys. D: Appl. Phys., 2009, 42, 224002 CrossRef.
- C. C. Berry, J. Phys. D: Appl. Phys., 2009, 42, 224003 CrossRef.
- G. H. Lee, Y. Chang and T. J. Kim, Eur. J. Inorg. Chem., 2012, 1924 CrossRef CAS.
- W. Xu, K. Kattel, J. Y. Park, Y. Chang, T. J. Kim and G. H. Lee, Phys. Chem. Chem. Phys., 2012, 14, 12687 RSC.
- T. J. Kim, K. S. Chae, Y. Chang and G. H. Lee, Curr. Top. Med. Chem., 2013, 13, 422 CrossRef CAS.
- H. S. Choi, W. Liu, P. Misra, E. Tanaka, J. P. Zimmer, B. I. Ipe, M. G. Bawendi and J. V. Frangioni, Nat. Biotechnol., 2007, 25, 1165 CrossRef CAS PubMed.
- F. A. Cotton and G. Wilkinson, Advanced Inorganic Chemistry, A Wiley-Interscience Publication, New York, 4th edn, 1980, pp. 646 and 984 Search PubMed.
- K. Kattel, J. Y. Park, W. Xu, H. G. Kim, E. J. Lee, B. A. Bony, W. C. Heo, J. J. Lee, S. Jin, J. S. Baeck, Y. Chang, T. J. Kim, J. E. Bae, K. S. Chae and G. H. Lee, ACS Appl. Mater. Interfaces, 2011, 3, 3325 CAS.
- K. Kattel, J. Y. Park, W. Xu, H. G. Kim, E. J. Lee, B. A. Bony, W. C. Heo, S. Jin, J. S. Baeck, Y. Chang, T. J. Kim, J. E. Bae, K. S. Chae and G. H. Lee, Biomaterials, 2012, 33, 3254 CrossRef CAS PubMed.
- N. N. Greenwood and A. Earnshaw, Chemistry of the Elements, Butterworth-Heinemann, New York, 2nd edn, 1997, p. 1243 Search PubMed.
- A. Roch, R. N. Muller and P. Gillis, J. Chem. Phys., 1999, 110, 5403 CrossRef CAS PubMed; A. Roch, Y. Gossuin, R. N. Muller and P. Gillis, J. Magn. Magn. Mater., 2005, 293, 5329 CrossRef PubMed.
- M. Norek, E. Kampert, U. Zeitler and J. A. Peters, J. Am. Chem. Soc., 2008, 130, 5335 CrossRef CAS PubMed.
- M. Norek, G. A. Pereira, C. F. G. C. Geraldes, A. Denkova, W. Zhou and J. A. Peters, J. Phys. Chem. C, 2007, 111, 10240 CAS.
- Y. Gossuin, A. Hocq, Q. L. Vuong, S. Disch, R. P. Hermann and P. Gillis, Nanotechnology, 2008, 19, 475102 CrossRef PubMed.
- A. C. Silva, J. H. Lee, I. Aoki and A. P. Koretsky, NMR Biomed., 2004, 17, 532 CrossRef CAS PubMed.
- J. Crossgrove and W. Zheng, NMR Biomed., 2004, 17, 544 CrossRef CAS PubMed.
- M. R. Goldman, T. J. Brady, I. L. Pykett, C. T. Burt, F. S. Buonanno, J. P. Kistler, J. H. Newhouse, W. S. Hinshaw and G. M. Pohost, Circulation, 1982, 66, 1012 CrossRef CAS.
- G. H. Lee, S. H. Huh, J. W. Jeong, B. J. Choi, S. H. Kim and H.-C. Ri, J. Am. Chem. Soc., 2002, 124, 12094 CrossRef CAS PubMed.
- M. J. Baek, J. Y. Park, W. Xu, K. Kattel, H. G. Kim, E. J. Lee, A. K. Patel, J. J. Lee, Y. Chang, T. J. Kim, J. E. Bae, K. S. Chae and G. H. Lee, ACS Appl. Mater. Interfaces, 2010, 2, 2949 CAS.
- F. Söderlind, H. Pedersen, R. M. Petoral Jr., P.-O. Käll and K. Uvdal, J. Colloid Interface Sci., 2005, 288, 140 CrossRef PubMed.
- X. L. Wang, D. Li, T. Y. Cui, P. Kharel, W. Liu and Z. D. Zhang, J. Appl. Phys., 2010, 107, 09B510 Search PubMed.
- S. Samantaray, D. K. Mishra, S. K. Pradhan, P. Mishra, B. R. Sekhar, D. Behera, P. P. Rout, S. K. Das, D. R. Sahu and B. K. Roul, J. Magn. Magn. Mater., 2013, 339, 168 CrossRef CAS PubMed.
- B. J. Prakash, K. N. Kumar and S. Buddhudu, Ferroelectr. Lett., 2012, 39, 104 CrossRef CAS.
- P. Negi, G. Dixit, H. M. Agrawal and R. C. Srivastava, J. Supercond. Novel Magn., 2013, 26, 1611 CrossRef CAS.
- Card number 25-0337 (GdMnO3) 1997 JCPDS International Center for Diffraction Data, PCPDFWIN ver. 1.30.
- Card number 25-0330 (DyMnO3) 1997 JCPDS International Center for Diffraction Data, PCPDFWIN ver. 1.30.
- O. W. Duckworth and S. T. Martin, Geochim. Cosmochim. Acta, 2001, 65, 4289 CrossRef CAS.
- S. J. Hug and D. Bahnemann, J. Electron Spectrosc. Relat. Phenom., 2006, 150, 208 CrossRef CAS PubMed.
- S. J. Hug and B. Sulzberger, Langmuir, 1994, 10, 3587 CrossRef CAS.
- C. B. Mendive, T. Bredow, M. A. Blesa and D. W. Bahnemann, Chem. Chem. Phys., 2006, 8, 3232 RSC.
- M. K. Corbierre, N. S. Cameron and R. B. Lennox, Langmuir, 2004, 20, 2867 CrossRef CAS.
- Aldrich Catalog, 2005–2006, p. 1260 (Gd2O3), p. 1085 (Dy2O3), p. 1509 (MnO).
- W. Xu, J. Y. Park, K. Kattel, B. A. Bony, W. C. Heo, S. Jin, J. W. Park, Y. Chang, J. Y. Do, K. S. Chae, T. J. Kim, J. A. Park, Y. W. Kwak and G. H. Lee, New J. Chem., 2012, 36, 2361 RSC.
| This journal is © The Royal Society of Chemistry 2014 |

