Unbalanced robust ANOVA for the estimation of measurement uncertainty at reduced cost
Analytical Methods Committee, AMCTB No 64
First published on 8th August 2014
Abstract
An empirical estimation of the random components of measurement uncertainty arising from the sampling and analytical processes can be made via an experiment involving replication. Analysis of variance (ANOVA) is then used to estimate the variance components. However, the fully balanced design is unduly costly, requiring four analyses per sampling target. This cost can be reduced by 25% by using an unbalanced design. Robust ANOVA in this context is often a useful tool, as it gives a more representative estimate of the separate variances than classical ANOVA when outlying results are encountered, but software for executing unbalanced robust ANOVA has hitherto been unavailable. This Technical Brief introduces the unbalanced design and the corresponding software provided by the AMC.
Balanced design—classical ANOVA
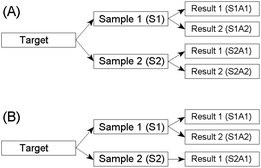
Estimation of uncertainty in measurement is essential for the reliable interpretation of results. The method recommended by the Eurachem/CITAC guide as being the simplest to apply is the duplicate method.1 This requires randomised duplication both at the sampling and the analytical stages of an investigation. A schematic diagram of the full balanced design is shown in Fig. 1(A). | ||
| Fig. 1 Design for the estimation of the random components of uncertainty arising from both the sampling and the analytical procedures. (A) Balanced design. (B) Unbalanced design. | ||
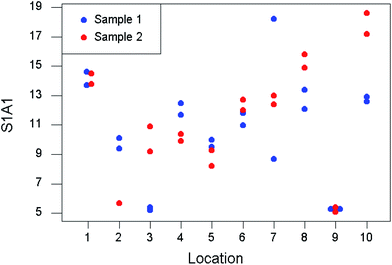
For this purpose a minimum of eight targets are randomly assigned for the duplication.1 (A ‘target’ could be the material at a sampling location, a batch of produce, etc., as appropriate.) At each of these targets, a duplicate sample is acquired according to a predetermined but suitably re-randomised protocol. Both of the samples from each target are then analysed twice. The separate contributions made by sampling and analysis to the total uncertainty budget can be estimated by analysis of variance (ANOVA). A simulated dataset has been generated for the purpose of demonstration and is shown in Table 1 and Fig. 2.
 | ||
| Fig. 2 Simulated data from a duplicated experiment to estimate uncertainty from sampling and analysis. | ||
| Location | S1A1 | S1A2 | S2A1 | S2A2 |
|---|---|---|---|---|
| 1 | 13.7 | 14.6 | 13.8 | 14.5 |
| 2 | 10.1 | 9.4 | 5.7 | 5.7 |
| 3 | 5.2 | 5.4 | 10.9 | 9.2 |
| 4 | 11.7 | 12.5 | 10.4 | 9.9 |
| 5 | 9.5 | 10.0 | 9.3 | 8.2 |
| 6 | 11.8 | 11.0 | 12.0 | 12.7 |
| 7 | 18.2 | 8.7 | 13.0 | 12.4 |
| 8 | 13.4 | 12.1 | 14.9 | 15.8 |
| 9 | 5.3 | 5.3 | 5.1 | 5.4 |
| 10 | 12.6 | 12.9 | 17.2 | 18.6 |
Table 2 includes the output from the application of classical ANOVA to these data. This naive analysis suggests that very high levels of analytical uncertainty are prevalent. However, environmental measurements are often affected by a proportion of extreme values. In this case, the difference between the measurements made on Analysis 1 and Analysis 2 of Sample 7 is noticeably greater than the norm (Table 1). A visual presentation (Fig. 2) shows that nine out of the ten targets show much smaller differences between the analytical duplicates.
| Seed value (before outlier is included) | Balanced (classical) | Balanced (robust) | Unbalanced (classical) | Unbalanced (robust) | |
|---|---|---|---|---|---|
| Mean | 10 | 11 | 11 | 12 | 11 |
| Relative sampling uncertainty (2s) | 40% | 30% | 38% | 8% | 34% |
| Relative analytical uncertainty (2s) | 10% | 30% | 13% | 37% | 12% |
Balanced design—robust ANOVA
Classical ANOVA has provided an idea of the sampling and analytical uncertainties that are atypical of the majority of the targets, because of the outlying result. Where such instances occur, robust ANOVA can give more realistic estimates of the variance components, by downweighting1 the influence of extreme values. Calculation of robust variances by the AMC method requires an iterative approach, which is best carried out by a computer program.2,3 Application of this method to the simulated data is shown in Table 2.Here, for the balanced design, the estimate of analytical uncertainty has diminished from 30% to 13% while the sampling uncertainty has increased from 30% to 38%. In both instances these robust estimates can be considered more representative of the typical differences between duplicated analyses and samples in the underlying population.
The unbalanced experimental design
A drawback of the balanced design is the cost incurred by the four analyses on each target. An alternative method, described in the Eurachem/CITAC guide, is to use an unbalanced experimental design (Fig. 1(B)). In this design, only one of the two samples per target is subjected to duplicated analysis. Thus the cost of analysis for the experiment is reduced by 25%. However, unbalanced robust nested ANOVA is complicated to execute and hitherto no software has been available. A new program has now been written to perform the robust calculations required, and is available gratis from the AMC website. Tests on real and simulated datasets show good comparisons between estimates made using the balanced and the unbalanced designs.4Analysis of the simulated data in Table 1 using an unbalanced design (i.e., omitting data from column S2A2) is also shown in Table 2. The unbalanced estimates are only marginally different from those obtained by the full balanced design. Again, these outcomes can be considered to be better estimates of the typical variances in the overall population than those given by classical ANOVA. In practice, the random components of sampling and analytical uncertainty could be subsumed into the total measurement uncertainty for data interpretation purposes.1
Software
The program U-RANOVA, which has been written in Visual Basic for Applications (Excel) is now available on the AMC website, together with a file of the example data. It is a stand-alone program to execute robust ANOVA with nested data, with options for the use of balanced or unbalanced designs. It will run in Windows or, with slight changes, in a Mac environment.Peter Rostron [University of Sussex]
This Technical Brief was drafted on behalf of the Subcommittee for Uncertainty from Sampling and approved by the Analytical Methods Committee on 04/07/14.
References
- Eurachem/CITAC, Measurement uncertainty arising from sampling, 2007 Search PubMed.
- Analytical Methods Committee, Analyst, 1989, 114, 1699 RSC.
- AMC Technical Brief, No 6.
- P. D. Rostron and M. H. Ramsey, Accredit. Qual. Assur., 2012, 17, 7 CrossRef.
| This journal is © The Royal Society of Chemistry 2014 |


