A rhodamine hydrazide-based fluorescent probe for sensitive and selective detection of hypochlorous acid and its application in living cells†
Zhen
Zhang
*a,
Chengquan
Deng
a,
Liesu
Meng
b,
Yan
Zheng
c and
Xiaomei
Yan
c
aDepartment of Applied Chemistry, School of Science, Xi'an Jiaotong University, Xi'an 710049, China. E-mail: zzlinda@mail.xjtu.edu.cn; Fax: +86 29 82668559; Tel: +86 29 82663914
bDepartment of Genetics and Molecular Biology, School of Medicine, Xi'an Jiaotong University, Xi'an 710061, China
cDepartment of Chemical Biology, College of Chemistry and Chemical Engineering, Xiamen University, Xiamen 361005, China
First published on 16th October 2014
Abstract
A simple rhodamine hydrazide-based fluorescent turn-on probe was developed for fluorescence detection of hypochlorous acid (HOCl) in aqueous media and living cells. On the basis of a HOCl-mediated oxidation–hydrolysis mechanism, this new probe features high sensitivity, comparatively wide pH detection range, fast-response, and great photostability toward HOCl in aqueous solutions. Owing to its hydrazide structure, the probe also exhibits excellent selectivity for HOCl over a panel of biologically relevant reactive oxygen species (ROS), reactive nitrogen species (RNS), and most of the common metal ions in neutral buffer. Particularly, with cell membrane permeability and low cytotoxicity, the probe is capable of responding to intracellular changes in HOCl levels in living cells by fluorescence imaging and flow cytometry.
Introduction
Reactive oxygen species (ROS) and reactive nitrogen species (RNS) are essential signalling molecules that mediate a wide variety of physiological processes.1–3 As one of the biologically important ROS, hypochlorous acid (HOCl) is generated from hydrogen peroxide (H2O2) and chloride ions (Cl−) under the catalysis of the heme enzyme myeloperoxidase (MPO) in activated leukocytes.4–6 Endogenous HOCl, reacting with various biomolecules, involving proteins, DNA, RNA, fatty acids, and cholesterol, plays a vital role in host innate immunity and has effective antibacterial properties.7,8 On the other hand, oxidative stress resulting from excessive formation of HOCl is known to contribute to progression of numerous human diseases such as atherosclerosis, rheumatoid arthritis, cardiovascular disease, neurodegenerative disease, and even cancer.9–11 Unfortunately, the mechanism of biological activities and specific functions of HOCl in living systems has not been fully established. Therefore, the detection of HOCl is of great significance, and much effort has already been dedicated to the development of sensitive and specific analytical methods for HOCl.12–14In particular, fluorescent probes have attracted considerable interest not only due to their high sensitivity, specificity, and simplicity of operation in regular in vitro assays, but also due to their great temporal and spatial resolution capability of in vivo bioimaging.15 A number of organic small-molecule fluorescent probes for HOCl have been reported to date, which are designed mainly based on the reductive agent triggered oxidation by HOCl, including selenide, aldoxime, thioester, thioether, p-aminophenyl ether, etc.16–32 Although the aforementioned fluorescent probes have exhibited satisfactory properties for HOCl detection, a major limitation of these results is that most of them involve complicated multistep synthesis and are not easily obtainable. Recently, some studies demonstrated that the chemoselective conversion of hydrazide to the corresponding carboxylic acid by an oxidation–hydrolysis mechanism provides a facile reaction-based approach to specific detection of HOCl over other ROS and RNS in aqueous solutions.33–39 However, in these reported hydrazide-based probes, they either showed modest selectivity, necessity for large amounts of organic co-solvents, prolonged reaction time, or detection in a basic pH range. So, with this ready HOCl-mediated oxidation–hydrolysis strategy, it seems that there is still much room for further development of sensitive, selective and fast-response hydrazide-based fluorescent probes for HOCl which can be obtained through convenient synthesis and applicable to real biological systems.
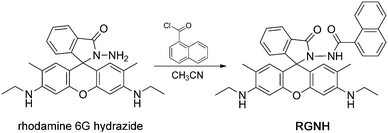
Rhodamine dyes are widely used as fluorescent probes due to their excellent photostability and photophysical properties.40 Since Czarnik and co-workers' pioneering work,41 more and more exciting papers have arisen on applications of rhodamine's unique fluorescent spirolactam ring-opening transformation to sensing analytes.42 Our group previously reported a rhodamine spiro-ring-based probe for HOCl by incorporating a hydrazide moiety as the specific reactive site (rhodamine 6G hydrazide, Scheme 1), but the probe had delayed detection time and also showed an obvious fluorescent response to Cu2+ and protons (especially under acidic conditions, pH < 6).37 It is noted that the HOCl-mediated oxidation–hydrolysis of hydrazide in aqueous solutions can be greatly accelerated by its linked electron-withdrawing substituents.34,35,38,39,43 Thus, to facilitate fast detection of HOCl, we attempted to design a molecule in which the electron-withdrawing group, naphthoyl, was placed at the amino position of rhodamine 6G hydrazide. Besides, the extra recognition of Cu2+ and protons by the original hydrazide moiety could also be avoided due to this substitution, which might provide high selectivity and high signal turn-on ratios in a wide pH scope during the detection of HOCl.
In this work, through simple chemical synthesis, we present a new fluorescent turn-on probe, rhodamine 6G naphthoyl-hydrazide (RGNH, Scheme 1), that exhibits sensitivity, comparatively wide pH range, rapid and photostable detection of HOCl in aqueous media. Probe RGNH utilizes its hydrazide structure to provide high selectivity for HOCl over a panel of biologically relevant ROS, RNS, and most of the common metal ions in neutral buffer. Moreover, with cell membrane permeability and low cytotoxicity, the probe is capable of reporting changes in HOCl levels in living cells by fluorescence imaging and flow cytometry.
Experimental
Materials and apparatus
All the chemicals for synthesis and spectral analysis were of analytical grade or higher, purchased from commercial suppliers and used without further purification. Column chromatography and thin layer chromatography (TLC) were performed on silica gel (200–300 mesh) and silica gel GF254 plates, respectively. Double distilled deionized water was used for all aqueous solutions. Potassium phosphate monobasic and dibasic salts were used for phosphate buffer solution (PBS). Various ROS and RNS including HOCl, H2O2, alkylperoxyl radical (ROO˙), nitric oxide radical (NO˙), hydroxyl radical (˙OH), superoxide radical (˙O2−), peroxynitrite (ONOO−), and singlet oxygen (1O2) were prepared following the published procedures.44–46 Solutions of metal ions were all prepared from their chloride salts, except for Pb(NO3)2. Lipopolysaccharides (LPS) and phorbol-12-myristate-13-acetate (PMA) were purchased from Sigma. Interferon-γ (IFN-γ) was obtained from PeproTech.NMR spectra (1H at 400 MHz and 13C at 100 MHz) were recorded on a Bruker Avance III 400 spectrometer with tetramethylsilane as an internal reference. Electrospray ionization mass spectrometry (ESI-MS) analysis was performed with a Bruker Esquire 3000 Plus or a Bruker En Apex ultra 7.0T Fourier Transform mass spectrometer. Fluorescence measurements were conducted on a Hitachi F-2700 fluorescence spectrophotometer with both excitation and emission slit widths set at 2.5 nm. The photomultiplier voltage was 700 V. Absorption spectra were collected on a Varian Cary 50 Bio UV-Visible spectrophotometer. All pH measurements were made with a Mettler Toledo SG2 pH meter. Fluorescence images of living cells were taken on a Leica TCS SP5 laser scanning confocal microscope with a 488 nm excitation laser and a 515–565 nm emission filter. Flow cytometry analysis was performed on a Becton Dickinson FACSAria flow cytometer with a 488 nm excitation laser and a 500–560 nm emission filter.
Synthesis of probe RGNH
To a solution of rhodamine 6G hydrazide (ref. 47) (0.43 g, 1.0 mmol) in acetonitrile (50 mL) was added dropwise 1-naphthoyl chloride (0.18 mL, 1.2 mmol). The resulting mixture was stirred at 40 °C for 4 h. Then the solvent was evaporated under reduced pressure followed by dissolution in dichloromethane (100 mL) and washing with saturated brine (3 × 50 mL). After being dried over anhydrous magnesium sulphate and filtered, the organic solution was concentrated by removal of the solvent and the residue was purified by column chromatography using petroleum ether (b.p. 60–90 °C)–ethyl acetate (3![[thin space (1/6-em)]](https://www.rsc.org/images/entities/char_2009.gif) :
:![[thin space (1/6-em)]](https://www.rsc.org/images/entities/char_2009.gif) 2, v/v) as the eluent to afford RGNH as a light pink solid (0.46 g, 79%). 1H NMR (400 MHz, CDCl3), δ (ppm): 8.04 (m, 1H), 7.80–7.67 (m, 3H), 7.54–7.49 (m, 2H), 7.43 (m, 2H), 7.34–7.32 (m, 1H), 7.12–7.07 (m, 2H), 6.54 (s, 2H), 6.36 (s, 2H), 3.56 (br, 2H), 3.19–3.17 (m, 4H), 1.91 (s, 6H), 1.28 (t, J = 7.0 Hz, 6H). 13C NMR (100 MHz, CDCl3), δ (ppm): 167.0, 164.8, 152.3, 151.4, 147.6, 133.2, 132.0, 130.5, 130.2, 129.2, 128.4, 127.8, 127.0, 126.3, 125.5, 125.1, 124.4, 124.2, 123.5, 117.8, 104.7, 96.3, 66.3, 38.2, 16.6, 14.7. ESI-MS: m/z 583.7 [M + H]+, 605.4 [M + Na]+. High-resolution ESI-MS: m/z [M + H]+ calcd for C37H35N4O3+: 583.2709, found: 583.2689; [M + Na]+ calcd for C37H34N4NaO3+: 605.2529, found: 605.2503.
2, v/v) as the eluent to afford RGNH as a light pink solid (0.46 g, 79%). 1H NMR (400 MHz, CDCl3), δ (ppm): 8.04 (m, 1H), 7.80–7.67 (m, 3H), 7.54–7.49 (m, 2H), 7.43 (m, 2H), 7.34–7.32 (m, 1H), 7.12–7.07 (m, 2H), 6.54 (s, 2H), 6.36 (s, 2H), 3.56 (br, 2H), 3.19–3.17 (m, 4H), 1.91 (s, 6H), 1.28 (t, J = 7.0 Hz, 6H). 13C NMR (100 MHz, CDCl3), δ (ppm): 167.0, 164.8, 152.3, 151.4, 147.6, 133.2, 132.0, 130.5, 130.2, 129.2, 128.4, 127.8, 127.0, 126.3, 125.5, 125.1, 124.4, 124.2, 123.5, 117.8, 104.7, 96.3, 66.3, 38.2, 16.6, 14.7. ESI-MS: m/z 583.7 [M + H]+, 605.4 [M + Na]+. High-resolution ESI-MS: m/z [M + H]+ calcd for C37H35N4O3+: 583.2709, found: 583.2689; [M + Na]+ calcd for C37H34N4NaO3+: 605.2529, found: 605.2503.
General procedures for spectroscopic analysis
Unless otherwise indicated, all spectroscopic analysis was carried out at 25 °C with samples placed in a 1.0 cm path-length quartz cuvette (1.0 mL volume). Probe RGNH was dissolved in ethanol as a 1.0 mM stock solution. The buffer solution for tests was PBS (10 mM). Probe RGNH (1.0 mM, 10 μL) was mixed with varying concentrations of analytes in PBS to a total volume of 1 mL. To investigate the kinetic behavior of the reaction between RGNH and HOCl, an appropriate amount of sodium hypochlorite (NaOCl) was added into the probe solution. The fluorescence development in the sample solution was recorded simultaneously at λex/em = 500/550 nm as a function of reaction time. For HOCl spectroscopic analysis, the measurement was performed immediately after the sample solutions were prepared. For ˙OH, ONOO−, 1O2 and metal ions, sample solutions were equilibrated for 10 min. For NO˙, the equilibration time was 30 min. As for H2O2, ROO˙ and ˙O2−, 1 h equilibration time was needed. In the HOCl-scavenging experiment, HOCl was pre-treated with 10 equiv. of L-methionine, a scavenger of HOCl,48 for 30 min, and then the same amount of probe was added. All tests were conducted at least in triplicate.Analysis of the reaction product between probe RGNH and HOCl
Probe RGNH was dissolved in ethanol and then diluted to 100 μM with PBS (10 mM, pH 7.4). Then 5 equiv. of NaOCl was injected into the probe solution. After 2 min, the reaction mixture was extracted with dichloromethane. The combined organic layer was analyzed by ESI-MS. High-resolution ESI-MS: m/z [M + H]+ calcd for C26H27N2O3+: 415.2022, found: 415.1982; [M + Na]+ calcd for C26H26N2NaO3+: 437.1841, found: 437.1802.To a solution of probe RGNH (50 mg, 0.09 mmol) in PBS (10 mM, pH 7.4, 20 mL) with N,N-dimethylformamide (8 mL) and ethanol (12 mL) as co-solvents, NaOCl (0.32 mL, 0.45 mmol) was added dropwise. Then the reaction mixture was stirred at room temperature for 30 min. After removal of the solvents under vacuum, the residue was extracted with dichloromethane (30 mL) and washed with saturated brine (3 × 10 mL). The organic layer was dried over anhydrous magnesium sulphate, filtered and evaporated. The crude product was purified by column chromatography (hexane–ethyl acetate = 1![[thin space (1/6-em)]](https://www.rsc.org/images/entities/char_2009.gif) :
:![[thin space (1/6-em)]](https://www.rsc.org/images/entities/char_2009.gif) 4 to ethyl acetate–methanol = 5
4 to ethyl acetate–methanol = 5![[thin space (1/6-em)]](https://www.rsc.org/images/entities/char_2009.gif) :
:![[thin space (1/6-em)]](https://www.rsc.org/images/entities/char_2009.gif) 2, v/v) to give the main product rhodamine 19 (29 mg, 82%) as a red solid. 1H NMR (400 MHz, CD3OD), δ (ppm): 8.10 (dd, J = 7.7, 1.3 Hz, 1H), 7.64–7.59 (m, 2H), 7.22 (dd, J = 7.3, 1.2 Hz, 1H), 7.05 (s, 2H), 6.86 (s, 2H), 3.50 (q, J = 7.2 Hz, 4H), 2.12 (s, 6H), 1.35 (t, J = 7.2 Hz, 6H). ESI-MS: m/z 415.4 [M + H]+, 437.2 [M + Na]+.
2, v/v) to give the main product rhodamine 19 (29 mg, 82%) as a red solid. 1H NMR (400 MHz, CD3OD), δ (ppm): 8.10 (dd, J = 7.7, 1.3 Hz, 1H), 7.64–7.59 (m, 2H), 7.22 (dd, J = 7.3, 1.2 Hz, 1H), 7.05 (s, 2H), 6.86 (s, 2H), 3.50 (q, J = 7.2 Hz, 4H), 2.12 (s, 6H), 1.35 (t, J = 7.2 Hz, 6H). ESI-MS: m/z 415.4 [M + H]+, 437.2 [M + Na]+.
Cell culture and fluorescence imaging
RAW264.7 macrophages were cultured in Dulbecco's modified Eagle's medium supplemented with fetal bovine serum (10%), penicillin (50 unit per mL), and streptomycin (50 μg mL−1) in a humidified incubator at 37 °C. The culture medium was replaced every two days. One day before assaying, cells were seeded on sterile glass coverslips in a 6-well permanox chamber in culture media.RAW264.7 cells were incubated with NaOCl (0–50 μM) in culture media for 30 min at 37 °C. Then an aliquot of the treated cells was incubated with 10 equiv. of L-methionine for 40 min at 37 °C. After washing with PBS (0.10 M, pH 7.4), all cells were incubated with probe RGNH (10 μM) in culture media for 30 min at 37 °C, and washed again with PBS (0.10 M, pH 7.4) before imaging.
For imaging endogenous HOCl, RAW264.7 cells were first incubated with LPS (1 μg mL−1) and IFN-γ (50 ng mL−1) in culture media for 12 h at 37 °C, and then were stimulated with PMA (10 nM) for 12 h at 37 °C. Next, an aliquot of the treated cells was incubated with L-methionine (300 μM) for 3 h at 37 °C. After washing with PBS (0.10 M, pH 7.4), all cells were incubated with probe RGNH (40 μM) in culture media for 30 min at 37 °C, and washed again with PBS (0.10 M, pH 7.4) before imaging.
Flow cytometry experiments
RAW264.7 cells were first incubated with LPS (1 μg mL−1) and IFN-γ (50 ng mL−1) in culture media for 12 h at 37 °C, and then were stimulated with PMA (10 nM) for 12 h at 37 °C. Subsequently, an aliquot of the treated cells was incubated with L-methionine (300 μM) for 3 h at 37 °C. After washing with PBS (0.10 M, pH 7.4), all cells were incubated with probe RGNH (40 μM) in culture media for an additional 30 min at 37 °C. Finally, the cells harvested by trypsin digestion were washed with PBS (0.10 M, pH 7.4) and then analyzed by flow cytometry. A total of 10![[thin space (1/6-em)]](https://www.rsc.org/images/entities/char_2009.gif) 000 cells were collected for each sample.
000 cells were collected for each sample.
Cytotoxicity test
The colorimetric 3-(4,5-dimethylthiazol-2-yl)-2,5-diphenyltetrazolium bromide (MTT) assay was used to determine the cytotoxicity of the probe. RAW264.7 macrophages were seeded in a 96-well plate for 24 h. After incubation with different concentrations of probe RGNH for 12 h, cells were added with MTT (5 mg mL−1, 20 μL) and incubated at 37 °C for 4 h. Then the remaining MTT solution was removed and dimethyl sulfoxide (150 μL) was added to each well and mixed thoroughly by agitation for 10 min at room temperature. Absorbance at 490 nm was determined using a Bio-Rad Model 550 automatic microplate reader.Results and discussion
Spectral characteristics of probe RGNH with HOCl
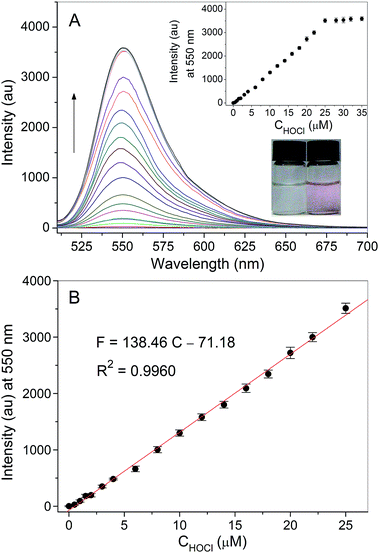
The fluorescence spectra of probe RGNH (10 μM) with different levels of HOCl (0–35 μM) in PBS (10 mM, pH 7.4, 1% ethanol, v/v) are shown in Fig. 1. Probe RGNH itself displayed no discernible fluorescence, which could be ascribed to its spiro-ring structure. However, in the presence of increasing concentrations of HOCl, dramatic fluorescence enhancement of the probe appeared with a new emissive band centered at 550 nm (Fig. 1A). In addition, the colorless to pink color change with an absorption peak at 525 nm was visually detectable (Fig. 1A inset and S1 in the ESI†). These are indicative of the spirolactam ring-opening of the probe triggered by HOCl. The emission intensity was linearly proportional to the content of HOCl from 0 to 25 μM with a detection limit of 3.3 nM (S/N = 3). Saturation was reached after addition of about 25 μM of HOCl, and a 1890-fold fluorescence increase was acquired (Fig. 1A inset and Fig. 1B). The sensitivity of probe RGNH for the detection of HOCl proved to be excellent.Effect of pH and kinetic assays
The effect of pH on the fluorescence response of probe RGNH toward HOCl was evaluated and the results are shown in Fig. 2. Compound RGNH itself was almost non-fluorescent in the tested pH range of 4.0–14.0, indicating that this probe remained in its closed spiro-ring form. This could be explained by the fact that the naphthoylhydrazide group in this probe may be more nucleophilic to stabilize a spirocyclic structure compared with rhodamine 6G hydrazide, in which the hydrazine group may be less nucleophilic and can undergo a spiro-ring opening process under acidic conditions (pH < 6) as demonstrated previously.37 In the presence of HOCl, although the strong fluorescence changes were observed from pH 8.0 to pH 12.5, there was a sufficient turn-on ratio over a comparatively wide pH range of 5–14, which is also suitable for the biological application. The fluorescence response of probe RGNH to HOCl was found to be dependent on the ratio of ethanol to water, and the result indicated that this fluorogenic detection system preferred aqueous media (Fig. S2†).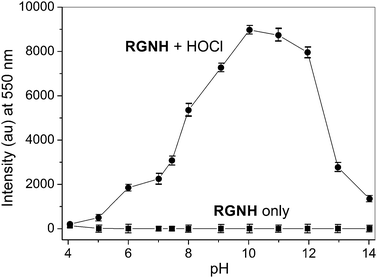 | ||
| Fig. 2 Fluorescence intensity (550 nm) of probe RGNH (10 μM) in the absence and presence of HOCl (20 μM) in PBS (10 mM, 1% ethanol, v/v) at various pH values (from 4.0 to 14.0). λex = 500 nm. | ||
Upon constant irradiation under excitation light at 500 nm for 1 h, the fluorescence intensity changes of both probe RGNH and its response to HOCl were recorded. Fig. 3 shows that the probe alone was almost non-fluorescent and the negligible background fluorescence was stable throughout the entire observation period. Besides, the fluorescence signal of the detection system reached its maximum immediately after the addition of various levels of HOCl (Fig. S3†) and remained basically unchanged at least for 1 h. So, with the electron-withdrawing group naphthoyl placed at the amino position of rhodamine 6G hydrazide, the fast analysis of HOCl by this probe was realized as expected, which may provide real-time sensing of HOCl in organisms. The fluorescence stability of the detection system and the probe also ensured the reliability of the assay method.
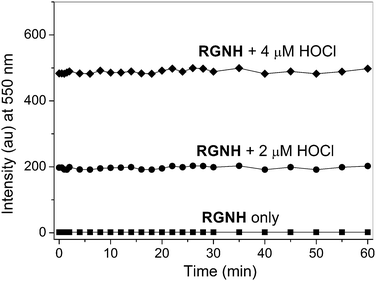 | ||
| Fig. 3 Kinetic behavior of the fluorescence intensity changes (550 nm) of probe RGNH (10 μM) in the absence and presence of HOCl (2 or 4 μM) in PBS (10 mM, pH 7.4, 1% ethanol, v/v). λex = 500 nm. | ||
Selectivity studies
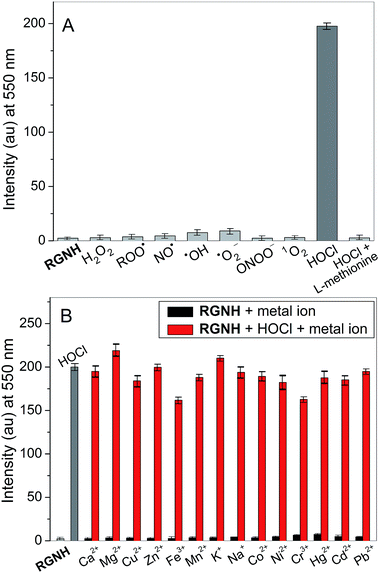
The selectivity of probe RGNH was investigated under the mimetic physiological conditions for other important representative ROS or RNS, including H2O2, ROO˙, NO˙, ˙OH, ˙O2−, ONOO−, and 1O2. It was revealed that only HOCl enhanced the fluorescence intensity greatly, while other ROS or RNS tested were relatively inert to probe RGNH with slight fluorescence signals, even though HOCl was fiftieth of other ROS or RNS in their contents (Fig. 4A and S4†). In addition to the fluorescence enhancement, the colorless to pink color change associated with the detection of HOCl by probe RGNH could be readily visible, but no significant color changes were promoted by other ROS or RNS (Fig. S5†). To ascertain that the fluorescence change of the probe was indeed induced by HOCl, L-methionine, a scavenger of HOCl,48 was employed in the detective system. The assay solution containing HOCl was pre-treated with 10 equiv. of L-methionine for 30 min, and then the same amount of probe was added. As a result, the fluorescence intensity was markedly suppressed by the addition of L-methionine as expected (Fig. 4A). The fluorescence intensity changes of the probe upon addition of various metal ions that are often present in biological specimens were studied as well under the same conditions (Fig. 4B). It was illustrated clearly that all tested ions (Ca2+, Mg2+, Cu2+, Zn2+, Fe3+, Mn2+, K+, Na+, Co2+, Ni2+, Cr3+, Hg2+, Cd2+, and Pb2+) displayed negligible fluorescence, and their coexistence could not affect the detection of HOCl either. These findings all together indicated that probe RGNH was highly selective for HOCl under biological pH conditions.Mechanism of HOCl detection
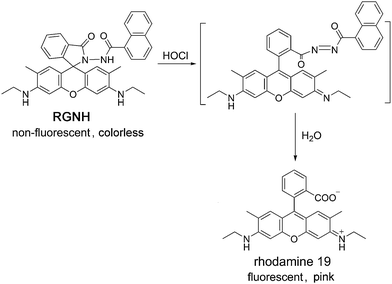
To investigate the mechanism responsible for the detection of HOCl by probe RGNH, the assay solution of the probe containing HOCl was subjected to high-resolution ESI-MS analysis (Fig. S6†). The experimental result revealed that, in the presence of HOCl, two major new peaks emerged at m/z 415.1982 and 437.1802, both of which represented the formation of rhodamine 19 (m/z 415.1982 [M + H]+, 437.1802 [M + Na]+). Therefore, based on the ESI-MS, fluorescence, and absorption data, the turn-on response of spectral signals in this detection system may be proposed to proceed through a similar route to that observed with rhodamine 6G hydrazide in a previous report (Scheme 2).37 Oxidation of probe RGNH by HOCl yields instantaneously diacyl diimide as an intermediate, and further undergoes decomposition in aqueous solutions to release the fluorophore of rhodamine 19. During the oxidation–hydrolysis process, probe RGNH converts its non-fluorescent and colorless spirolactam form into the fluorescent and colored ring-opened one. Although the highly unstable diacyl diimide intermediate was not able to be captured, rhodamine 19, as the main final product isolated from the reaction of probe RGNH with HOCl via column chromatography, could be confirmed by ESI-MS and 1H NMR spectra (Fig. S7 and S8†).Fluorescence imaging and flow cytometry analysis of HOCl in living cells
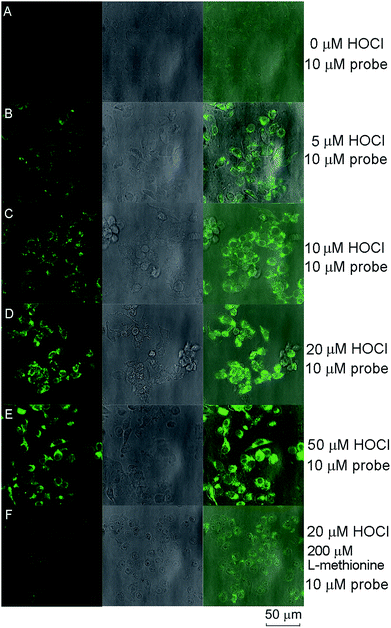
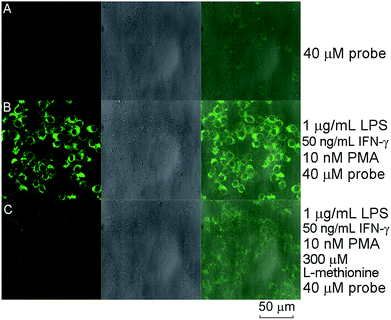
Compared with the recently reported hydrazide-based fluorescent probes for HOCl or OCl−, the spectroscopic findings all together illustrated that probe RGNH possessed low detection limit, fast response time, and high selectivity in aqueous media at physiological pH (Table S1†). So, our attention was turned to evaluating the applicability of the probe to report changes in HOCl levels in living cells. The probe was first used to track exogenous HOCl levels in RAW264.7 macrophage cells by confocal fluorescence microscopy. RAW264.7 macrophages were pre-cultured with different concentrations of HOCl (0–50 μM, 30 min), followed by incubation with probe RGNH (10 μM, 30 min) and rinsed with PBS. As shown in Fig. 5, the fluorescence of probe RGNH was clearly observed in cells treated with HOCl relative to control cells. And the fluorescence intensities tended to rise as the concentration of HOCl increased (Fig. 5A–E). It is known that RAW264.7 macrophages produce MPO by stimulation,49 and additionally will also activate the generation of other ROS and RNS by exposure to stimuli such as LPS/IFN-γ, and PMA.50,51 Consequently, encouraged by the above favorable results, probe RGNH was next used to detect endogenous HOCl generated by the stimulation of an MPO/H2O2/Cl− system. Fig. 6A and B depict that although negligible intracellular background fluorescence was observed in the probe-loaded (40 μM, 30 min) RWA264.7 cells prior to stimulation treatment, bright fluorescence appeared from the cells after stimulation with LPS, IFN-γ (1 μg mL−1, 50 ng mL−1, respectively, 12 h) followed by PMA (10 nM, 12 h). To further prove that probe RGNH can detect HOCl in living cells, tests were performed to investigate the effect of L-methionine, a scavenger of HOCl. When L-methionine was incubated with HOCl pre-treated or pre-stimulated RAW264.7 macrophages, much weaker fluorescence was visualized by probe RGNH (Fig. 5F and 6C). That is to say, the detection of HOCl by this probe was quite specific. The bright-field images illustrated that RAW264.7 cells were viable throughout the imaging experiments (Fig. 5 and 6). And using the layer scanning function of a confocal microscope, it could be observed clearly that probe RGNH penetrated the cell membrane and entered into cytoplasm. These results indicated that probe RGNH was capable of imaging both exogenous and endogenous HOCl in living RAW264.7 cells. The HOCl-mediated oxidation–hydrolysis of the probe in aqueous media is very quick (less than 1 s), and all measurements were conducted after the completion of the reaction.Flow cytometry can be used to quantitatively evaluate endogenous HOCl in individual cells on a large scale, compared with microscopy imaging which provides spatial information. The feasibility of the probe to respond to changes in endogenous HOCl levels within live-cell systems was additionally examined by flow cytometry. The dot plots of side scattering versus fluorescence obtained for the assay samples are displayed in Fig. 7A–C. In contrast to the background fluorescence detected for control cells with the probe alone (Fig. 7A), a significant fluorescence enhancement with a clear shift in the direction of high intensity was observed for probe-loaded cells after stimulation with LPS, IFN-γ (1 μg mL−1, 50 ng mL−1, respectively, 12 h) followed by PMA (10 nM, 12 h) (Fig. 7B). Coincident with the result of microscopy imaging, in the presence of L-methionine (300 μM, 3 h), much weaker fluorescence with a lower shift was visualized for probe-loaded cells after stimulation under the same conditions (Fig. 7C). A threshold of 160 arbitrary units was used on the fluorescence channel to facilitate discrimination. The percentages of populations that produced fluorescence intensities above this threshold were 7.25, 87.7, and 59.8% for RAW264.7 macrophages with the probe alone, incubated with various stimulants and the probe, incubated with various stimulants, L-methionine and the probe, respectively. The fluorescence histograms of these three samples are displayed in Fig. 7D, in which differences can be easily discerned. The median fluorescence intensities were 65, 952, and 318, respectively. Probe RGNH also showed good applicability in flow cytometry.
Cell cytotoxicity of probe RGNH
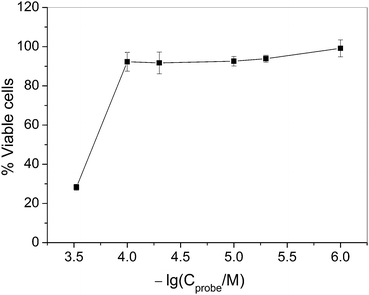
The cell cytotoxicity of probe RGNH was evaluated by MTT with its concentration ranging from 1 to 300 μM, and the results are shown in Fig. 8. When the concentration of probe RGNH was below 100 μM, there were almost no changes in cell viability, suggesting that the probe had low cell cytotoxicity to the cultured cell line under the experimental conditions.Conclusions
In summary, a simple rhodamine hydrazide-based fluorescent turn-on probe RGNH for HOCl was successfully developed via a facile HOCl-mediated oxidation–hydrolysis strategy in aqueous solutions. This new probe features high sensitivity, comparatively wide pH detection range, fast-response, and great photostability toward HOCl. Owing to its hydrazide structure, the probe also exhibits excellent selectivity for HOCl over a panel of biologically relevant ROS, RNS, and most of the common metal ions in neutral buffer. Particularly, with cell membrane permeability and low cytotoxicity, the probe is capable of reporting changes in HOCl levels in living cells by fluorescence imaging and flow cytometry. It is anticipated that these results might make this probe an efficient tool to facilitate the HOCl-relevant biological research.Acknowledgements
This work was financially supported by the National Natural Science Foundation of China (no. 21102112) and the Fundamental Research Funds for the Central Universities (no. 08142020).Notes and references
- J. D. Lambeth, Free Radical Biol. Med., 2007, 43, 332 CrossRef CAS PubMed.
- A. Gomes, E. Fernandes and J. L. F. C. Lima, J. Biochem. Biophys. Methods, 2005, 65, 45 CrossRef CAS PubMed.
- X. Li, G. Zhang, H. Ma, D. Zhang, J. Li and D. Zhu, J. Am. Chem. Soc., 2004, 126, 11543 CrossRef CAS PubMed.
- E. Hidalgo, R. Bartolome and C. Dominguez, Chem.–Biol. Interact., 2002, 139, 265 CrossRef CAS.
- D. I. Pattison and M. J. Davies, Chem. Res. Toxicol., 2001, 14, 1453 CrossRef CAS PubMed.
- P. J. O'Brien, Chem.–Biol. Interact., 2000, 129, 113 CrossRef.
- Z. M. Prokopowicz, F. Arce, R. Biedron, C. L. Chiang, M. Ciszek, D. R. Katz, M. Nowakowska, S. Zapotoczny, J. Marcinkiewicz and B. M. Chain, J. Immunol., 2010, 184, 824 CrossRef CAS PubMed.
- C. C. Winterbourn, M. B. Hampton, J. H. Livesey and A. J. Kettle, J. Biol. Chem., 2006, 281, 39860 CrossRef CAS PubMed.
- J. I. Kang and J. W. Neidigh, Chem. Res. Toxicol., 2008, 21, 1028 CrossRef CAS PubMed.
- Y. W. Yap, M. Whiteman and N. S. Cheung, Cell. Signalling, 2007, 19, 219 CrossRef CAS PubMed.
- D. I. Pattison and M. J. Davies, Biochemistry, 2006, 45, 8152 CrossRef CAS PubMed.
- N. Ornelas Soto, B. Horstkotte, J. G. March, P. L. Lopez de Alba, L. Lopez Martinez and V. Cerda Martin, Anal. Chim. Acta, 2008, 611, 182 CrossRef CAS PubMed.
- O. Ordeig, R. Mas, J. Gonzalo, F. J. Del Campo, F. J. Munoz and C. de Haro, Electroanalysis, 2005, 17, 1641 CrossRef CAS.
- J. Ballesta Claver, M. C. Valencia Miron and L. F. Capitan-Vallvey, Anal. Chim. Acta, 2004, 522, 267 CrossRef CAS PubMed.
- D. T. Quang and J. S. Kim, Chem. Rev., 2010, 110, 6280 CrossRef CAS PubMed.
- S. R. Liu and S. P. Wu, Org. Lett., 2013, 15, 878 CrossRef CAS PubMed.
- G. Li, D. Zhu, Q. Liu, L. Xue and H. Jiang, Org. Lett., 2013, 15, 2002 CrossRef CAS PubMed.
- B. Wang, P. Li, F. Yu, P. Song, X. Sun, S. Yang, Z. Lou and K. Han, Chem. Commun., 2013, 49, 1014 RSC.
- Z. Lou, P. Li, Q. Pan and K. Han, Chem. Commun., 2013, 49, 2445 RSC.
- S. Y. Yu, C. Y. Hsu, W. C. Chen, L. F. Wei and S. P. Wu, Sens. Actuators, B, 2014, 196, 203 CrossRef CAS PubMed.
- M. Emrullahoglu, M. Ucuncu and E. Karakus, Chem. Commun., 2013, 49, 7836 RSC.
- X. Cheng, H. Jia, T. Long, J. Feng, J. Qin and Z. Li, Chem. Commun., 2011, 47, 11978 RSC.
- W. Lin, L. Long, B. Chen and W. Tan, Chem.–Eur. J., 2009, 15, 2305 CrossRef CAS PubMed.
- Q. Xu, K. A. Lee, S. Lee, K. M. Lee, W. J. Lee and J. Yoon, J. Am. Chem. Soc., 2013, 135, 9944 CrossRef CAS PubMed.
- Y. Koide, Y. Urano, K. Hanaoka, T. Terai and T. Nagano, J. Am. Chem. Soc., 2011, 133, 5680 CrossRef CAS PubMed.
- X. Chen, K. A. Lee, E. M. Ha, K. M. Lee, Y. Y. Seo, H. K. Choi, H. N. Kim, M. J. Kim, C. S. Cho, S. Y. Lee, W. J. Lee and J. Yoon, Chem. Commun., 2011, 47, 4373 RSC.
- S. Kenmoku, Y. Urano, H. Kojima and T. Nagano, J. Am. Chem. Soc., 2007, 129, 7313 CrossRef CAS PubMed.
- T. I. Kim, S. Park, Y. Choi and Y. Kim, Chem.–Asian J., 2011, 6, 1358 CrossRef CAS PubMed.
- Q. A. Best, N. Sattenapally, D. J. Dyer, C. N. Scott and M. E. McCarroll, J. Am. Chem. Soc., 2013, 135, 13365 CrossRef CAS PubMed.
- Y. Koide, Y. Urano, S. Kenmoku, H. Kojima and T. Nagano, J. Am. Chem. Soc., 2007, 129, 10324 CrossRef CAS PubMed.
- J. Shepherd, S. A. Hilderbrand, P. Waterman, J. W. Heinecke, R. Weissleder and P. Libby, Chem. Biol., 2007, 14, 1221 CrossRef CAS PubMed.
- Z. Lou, P. Li, P. Song and K. Han, Analyst, 2013, 138, 6291 RSC.
- C. C. Zhang, Y. Gong, Y. Yuan, A. Luo, W. Zhang, J. Zhang, X. Zhang and W. Tan, Anal. Methods, 2014, 6, 609 RSC.
- L. Long, D. Zhang, X. Li, J. Zhang, C. Zhang and L. Zhou, Anal. Chim. Acta, 2013, 775, 100 CrossRef CAS PubMed.
- F. Wei, Y. Lu, S. He, L. Zhao and X. Zeng, Anal. Methods, 2012, 4, 616 RSC.
- X. Zhang, Y. Zhang and Z. Zhu, Anal. Methods, 2012, 4, 4334 RSC.
- Z. Zhang, Y. Zheng, W. Hang, X. Yan and Y. Zhao, Talanta, 2011, 85, 779 CrossRef CAS PubMed.
- Y. Liu, Y. Sun, J. Du, X. Lv, Y. Zhao, M. Chen, P. Wang and W. Guo, Org. Biomol. Chem., 2011, 9, 432 CAS.
- X. Chen, X. Wang, S. Wang, W. Shi, K. Wang and H. Ma, Chem.–Eur. J., 2008, 14, 4719 CrossRef CAS PubMed.
- M. Beija, C. A. M. Afonso and J. M. G. Martinho, Chem. Soc. Rev., 2009, 38, 2410 RSC.
- V. Dujols, F. Ford and A. W. Czarnik, J. Am. Chem. Soc., 1997, 119, 7386 CrossRef CAS.
- H. N. Kim, M. H. Lee, H. J. Kim, J. S. Kim and J. Yoon, Chem. Soc. Rev., 2008, 37, 1465 RSC.
- J. E. Leffler and W. B. Bond, J. Am. Chem. Soc., 1956, 78, 335 CrossRef CAS.
- Y. K. Yang, H. J. Cho, J. Lee, I. Shin and J. Tae, Org. Lett., 2009, 11, 859 CrossRef CAS PubMed.
- X. F. Yang, X. Q. Guo and Y. B. Zhao, Talanta, 2002, 57, 883 CAS.
- P. Di Mascio, E. J. H. Bechara, M. H. G. Medeiros, K. Briviba and H. Sies, FEBS Lett., 1994, 355, 287 CrossRef CAS.
- D. Wu, W. Huang, C. Duan, Z. Lin and Q. Meng, Inorg. Chem., 2007, 46, 1538 CrossRef CAS PubMed.
- K. Mera, R. Nagai, N. Haraguchi, Y. Fujiwara, T. Araki, N. Sakata and M. Otagiri, Free Radical Res., 2007, 41, 713 CrossRef CAS PubMed.
- Y. Adachi, A. L. Kindzelskii, A. R. Petty, J. B. Huang, N. Maeda, S. Yotsumoto, Y. Aratani, N. Ohno and H. R. Petty, J. Immunol., 2006, 176, 5033 CrossRef CAS.
- T. Salonen, O. Sareila, U. Jalonen, H. Kankaanranta, R. Tuominen and E. Moilanen, Br. J. Pharmacol., 2006, 147, 790 CrossRef CAS PubMed.
- R. B. R. Muijsers, E. van den Worm, G. Folkerts, C. J. Beukelman, A. S. Koster, D. S. Postma and F. P. Nijkamp, Br. J. Pharmacol., 2000, 130, 932 CrossRef CAS PubMed.
Footnote |
| † Electronic supplementary information (ESI) available: Additional spectroscopic data of probe RGNH with HOCl; ESI-MS, 1H NMR, and 13C NMR spectra of probe RGNH; ESI-MS and 1H NMR spectra of the reaction product between probe RGNH and HOCl. See DOI: 10.1039/c4ay02281e |
| This journal is © The Royal Society of Chemistry 2015 |

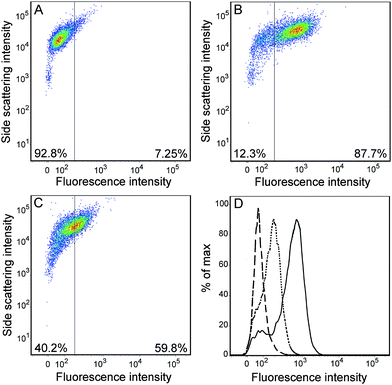
![[dash dash, graph caption]](https://www.rsc.org/images/entities/char_e091.gif) ), (B) (—), and (C) (⋯) incubation conditions.
), (B) (—), and (C) (⋯) incubation conditions.