 Open Access Article
 This Open Access Article is licensed under a
 Creative Commons Attribution 3.0 Unported Licence
Oxidized polyethylene films for orienting polar molecules for linear dichroism spectroscopy†
Kasra
Razmkhah
,
Nikola Paul
Chmel
*,
Matthew I.
Gibson
and
Alison
Rodger
Department of Chemistry and Warwick Analytical Science Centre, University of Warwick, Coventry, CV4 7AL, UK. E-mail: N.Chmel@warwick.ac.uk; Fax: +44 2476575795; Tel: +44 2476574696
First published on 21st January 2014
Abstract
Stretched polyethylene (PE) films have been used to orient small molecules for decades by depositing solutions on their surface and allowing the solvent to evaporate leaving the analyte absorbed on the polymer film. However, the non-polar hydrophobic nature of PE is an obstacle to aligning polar molecules and biological samples. In this work PE film was treated with oxygen plasma in order to increase surface hydrophilicity. Different treatment conditions were evaluated using contact angle measurement and X-ray photoelectron spectroscopy. Treated PE (PEOX) films are shown to be able to align molecules of different polarities including progesterone, 1-pyrenecarboxaldehyde, 4′,6-diamidino-2-phenylindole (DAPI) and anthracene. The degree of alignment of each molecule was studied by running series of linear dichroism (LD) experiments and the polarizations of electronic transition moments were determined. For the first time optimal conditions (such as stretching factor and concentration of the sample) for stretched film LD were determined. PEOX aligning ability was compared to that of normal PE films. Progesterone showed a slightly better alignment on PEOX than PE. 1-Pyrenecarboxaldehyde oriented differently on the two different films which enabled transition moment assignment for this low symmetry molecule. DAPI (which does not align on PE) aligned well on PEOX and enabled us to obtain better LD data than had previously been collected with polyvinyl alcohol. Anthracene alignment and formation of dimers and higher order structures were studied in much more detail than previously possible, showing a variety of assemblies on PE and PEOX films.
Introduction
Planar aromatic molecules are seeing increasing applications as spectroscopic labels in optical microscopy and spectroscopy, particularly to probe the behaviour of complex biomolecular assemblies. If one merely wishes to see where a label is and perhaps how its concentration changes in time by analysing images for localisation or dynamics of cellular components or in FRAP (fluorescence recovery after bleaching) experiments, a coloured label, usually with a good quantum yield, is all that is required. However, if one is trying to extract geometric information from an experiment, as we do in flow linear dichroism experiments, more information about transition polarizations and changes in probe spectroscopy with probe–probe interactions are required. The aim of this work was to develop methods to help us understand the spectroscopy of potential probe molecules.Linear dichroism (LD) is the difference in absorbance, A, of light polarized parallel (Z) and perpendicular (Y) to the orientation direction
| LD = AZ − AY | (1) |
Flow LD can be used to determine relative orientations of molecules, such as DNA-binding ligands and DNA bases,1–6 or peptides and lipids in liposomes,7–9 or nucleotides and proteins in fibrous proteins such as FtsZ10 or tubulin,11 or molecules binding to carbon nanotubes.12 More recently we have been attaching fluorescent probes to proteins on viruses and proteins that make up the bacterial cell division machinery and have been surprised how little spectroscopic information is available in the literature on the transition polarizations of molecules routinely used as optical probes. In a recent paper we determined the polarizations of the accessible UV absorbance bands of fluorene and the Fmoc group using stretched polyethylene (PE) films and used the results to interpret flow LD data collected on peptide fibres including the Fmoc chromophore.13
We have previously been precluded from following a similar approach for many of the molecules in which we are interested because they are too hydrophilic to be oriented on stretched PE films made from commercial sandwich-bag PE films (our preferred substrate).14 Although we have previously collected stretched film data on polyvinylalcohol (PVA) films, these films take days to prepare and usually involve the analyte being integrated into the polymerising film.15 This makes the kind of experiments discussed below, where we vary concentration of parent solution and degree of stretch, extremely time consuming. PVA films are also very brittle and hard to stretch reproducibly.14
There has been discussion in the literature about the mechanisms that operate to cause small molecules to orient on PE films. Thulstrup et al. in 197016 concluded that it was generally agreed that most of the solute was dissolved in the amorphous parts of a PE sheet. Despite this, Wirtz et al.17 concluded in 2011 that the oriented chromophores are bound to PE crystals (though with a distribution about the stretch direction) and are oriented when the crystallites to which they are bound orient. They also deduced that the crystallites become oriented along the stretching direction of a film, because the large local strain destroys the lamellae (thin extended sheets of crystallites that are typically tens of nanometers thick and tens of micrometers long) and subsequently recrystallization occurs. Thus they concluded that stretching does not cause a gradual increase in alignment of a molecule but causes the crystallite to which it is bound to orient or, at higher stretch ratios, a phase change that leads to more crystallites. We do know that molecules are likely to orient on PE with their long axes parallel to the stretching direction.18
In this paper we report the development and application of oxidised polyethylene films (PEOX) to determine transition polarizations of polar molecules with the same versatility and ease of use that is possible with PE. We illustrate its utility by considering the spectroscopy of progesterone, 1-pyrenecarboxaldehyde (PyCO), 4′,6-diamidino-2-phenylindole (DAPI) and anthracene. Contrary to our expectations, the D2h symmetric hydrocarbon anthracene proved to be the most challenging due to its propensity to assemble into higher order structures. Our results show that PEOX behaves in much the same as PE except that it attracts hydrophilic molecules. We have also made some further progress in understanding the nature of the films.
Materials and methods
Materials
All chemicals were purchased from Sigma-Aldrich and used without further purification. Solvents used in the measurements were 18.2 MΩ water (Millipore Direct-QTM), chloroform (spectrophotometric grade, Sigma-Aldrich), methanol (Laboratory grade, Fisher Chemicals) and methyl cyclohexane (spectrophotometric grade, Sigma-Aldrich). The PE films to be used as sample matrices were cut from Glad® Snap Lock® bags, and stretched so that the direction of stretch is parallel to the observable faint lines in the film. Stock solutions of each analyte were prepared in chloroform (for PE) or methanol (for PEOX).PEOX oxidised films
PE sheets with dimensions of 2.5 × 4 cm were placed in an Emitech K1050X Plasma Asher connected to an oxygen gas supply for 1 min at 50 W power setting.Sample preparation
For most experiments, a piece of PE or PEOX film (of size 2.5 × 4 cm2) was placed between two jaws of the mechanical stretcher designed for this purpose (Fig. 1a). The film was then stretched from 2.5 centimetres to different lengths. The analyte was sometimes added before and sometimes after stretching the film (see details in Results and discussion). Baselines were collected on stretched films where a small volume of solvent had been dropped on and left to dry. Samples (30–40 μL in solution with the same solvent as the baseline) were placed on the stretched film, then left to evaporate creating a dried layer. The stretched film and its holder were usually placed horizontally into the spectrometer so that the light beam was incident on the analyte with the stretch direction was horizontal (in our instrument the direction of the parallel polarized light). | ||
| Fig. 1 (a) Mechanical film stretcher designed and built at the University of Warwick. (b) Cylindrical film holder (originally designed for oriented circular dichroism measurements)19 where film is held between two quartz plates (1 mm thick) themselves sandwiched between Teflon rings and O-rings. | ||
In order to check for the presence of higher order structures e.g. formation of dimers or sample crystallisation on the surface of the film, several samples were routinely prepared using serial dilutions of the stock solution. In the absence of higher order structures, shapes of the obtained LD spectra are independent of concentration.
In some experiments the film was mounted in a cylindrical holder (Fig. 1b) and rotated to different orientations. For these film-rotation LD experiments, the film was first stretched in the film stretcher, the sample added and then the film transferred (ensuring it remained stretched) to the cylindrical film holder shown in Fig. 1b. To secure the sample within the cylindrical film holder, the two quartz plates were placed on either side of the PE film and clamped to maintain the tension on film. The film was cut to remove excess PE film. The sandwiched film was then placed in the holder and fixed in place by a screw fitting which, when screwed fully into the holder, maintained the tension on the film.
Ultra-violet absorbance and linear dichroism spectroscopy
Ultra-violet absorbance and LD spectra on films oriented with the stretch direction parallel to the horizontally polarized light were measured using a JASCO J-815 circular dichroism spectropolarimeter adapted for LD spectroscopy by collecting LD in one data channel and A in another. In general, baselines were collected on the films before the addition of the sample. The data acquisition and baseline subtraction were performed using the J-815 Spectra Manager software version 2.07.02. The spectra of samples (and baselines) were measured as a function of different stretching lengths of polyethylene. If a single film was measured at different stretch factors, baselines were measured on three independent films treated in as close to identical fashion as was possible. All measurements for film-rotation LD were performed using a Bio-Logic MOS-450 spectrometer.Reduced LD (LDr), the LD divided by the isotropic absorbance, is independent of concentration and path length (sample thickness, which can change upon stretching). The usefulness of the LDr depends on both spectra being measured on exactly the same molecules. This requires both the film not to be moved and there not to be any unoriented molecules in the light beam whose absorbance is measured but which do not contribute to the LD. In the simple case of uniaxial orientation with the horizontal polarization of the instrument along the film stretch direction14
 | (2) |
X-ray photoemission spectroscopy
The X-ray photoemission spectroscopy (XPS) data20 were collected at the Science City Photoemission Facility, University of Warwick. The samples investigated in this study were mounted on Omicron sample plates using electrically conductive carbon tape and loaded in to the fast-entry chamber. Once a pressure of less than 1 × 10⁻⁷ mbar had been achieved (approx. 1 hour), the samples were transferred to a 12-stage storage carousel, located between the preparation and main analysis chambers, for storage at pressures of less than 2 × 10⁻¹⁰ mbar. XPS measurements were conducted in the main analysis chamber (base pressure 2 × 10⁻¹¹ mbar), with the sample being illuminated using an XM1000 monochromatic Al-Kα X-ray source (Omicron Nanotechnology). The measurements were conducted at room temperature and at a take-off angle of 90° (more penetration depth) and 30° (closer to the surface). The photoelectrons were detected using a Sphera electron analyser (Omicron Nanotechnology), with the core levels recorded using a pass energy of 10 eV (resolution approx. 0.47 eV). Due to the insulating nature of the samples, a CN10 charge neutralizer (Omicron Nanotechnology) had to be used in order to prevent surface charging, whereby a low energy (typically 1.5 eV) beam of electrons was directed on to the sample during XPS data acquisition. The data were analysed using the CasaXPS package, using Shirley backgrounds and mixed Gaussian–Lorentzian (Voigt) line shapes. All binding energies were calibrated to the C 1s peak at 284.6 eV. The energy is calibrated weekly using the Fermi edge of a polycrystalline Ag sample is accurate to (±)0.02 eV. Compositional analysis of Au, Cu and Ag samples was used to give a transmission function for the analyser resulting in an accuracy of around 1%.Contact angle measurements
Contact angle measurements were performed using a Krüss DSA (droplet shape analyser) 100 (Krüss Instruments, Germany) on a 10 μL droplet of water dispensed onto polyethylene substrate. The Tangent-1 fitting measurement was used to yield the left and right three phase contact angles of the droplet.XRD measurements
X-ray diffraction (XRD) experiments were performed on Siemens D500 diffractometer with the CuKα (λ = 1.5428 Å) radiation source, step 0.02° and step interval 20 s.Results and discussion
Linear dichroism, LD, is a differential absorption spectroscopy technique from which one can extract transition moment polarizations if the sample orientation is known or chromophore orientation information if transition moments have been assigned. The main work of this paper relates to a new polymer surface for LD, PEOX. The results below describe how PEOX was produced and characterised thus enabling us to collect data on previously intractable samples.Producing and characterising non-polar and polar PE films
Tissington, et al.,21 showed that by using oxygen plasma treatment it is possible to form active oxygen containing groups on the surface of the polyethylene film. In this work pieces of PE film were placed in a Plasma Asher and treated with two different powers (50 and 100 W) and four different timings (10, 30, 60 and 120 seconds). As Fig. 2 shows, the hydrophilicity of the surface increases with the duration of the treatment. However, the lower power showed higher final levels of hydrophilicity as deduced from the water contact angle (Fig. 2). This could be caused by the degradation of the PE fibres at high plasma power.22 For our spectroscopy experiments we therefore prepared films using 50 W and 1 minute and denote the treated films as PEOX. | ||
| Fig. 2 (a) Water drops on polyethylene films treated at the indicated power levels for the indicated times. (b) The contact angle of PE films placed in the plasma asher at different power levels as a function of time. | ||
The XPS data for oxygen functional groups on PE and PEOX are summarised in Table 1. The 30° data are indicative of surface groups as the beam penetrates less than in the 90° configuration. The treated samples show a slight enhancement over time in carbonyls relative to OH, consistent with oxidation proceeding from alcohol, to aldehyde, to carboxylic acid. The difference as a function of angle of incidence suggests that the surface is slightly enriched with carbonyls (relative to OH) compared to the depth of the film.
| Peak energy | Assignment | % of counts in region | ||||
|---|---|---|---|---|---|---|
| PE 90° | PEOX 50 W, 30 s 30° | PEOX 50 W, 30 s 90° | PEOX 50 W, 60 s 30° | PEOX 50 W, 60 s 90° | ||
| 284.6 | C–C, C–H | 54.70% | 51.56% | 49.46% | 51.22% | 48.44% |
| 284.99 | PET loss peak 1 | 27.35% | 25.78% | 24.73% | 25.61% | 24.22% |
| 285.38 | PET loss peak 2 | 5.47% | 5.16% | 4.95% | 5.12% | 4.84% |
| 285.77 | PET loss peak 3 | 0.88% | 0.83% | 0.79% | 0.82% | 0.78% |
| 285.93 | C–OH | 3.57% | 1.13% | 8.10% | 0.60% | 8.55% |
| 287.06 | H–O–C–O–H (?) | 0.00% | 5.84% | 3.46% | 6.64% | 4.02% |
| 288.02 | C![[double bond, length as m-dash]](https://www.rsc.org/images/entities/char_e001.gif) O O |
7.53% | 4.39% | 3.16% | 3.97% | 3.14% |
| 289.31 | COOH | 0.51% | 5.31% | 5.35% | 6.01% | 6.02% |
| Total O% | 11.5% | 16.5% | 20.0% | 17.0% | 20.5% | |
The XRD pattern of non-stretched PE (prestretched by the manufacturer during production) and 2× stretched (using the LD stretcher) film are shown in Fig. 3. Our X-ray diffraction studies seem to support the conclusion that stretching increases the crystallinity of PE. The two reflections at 22° and 24° are characteristic of the typical orthorhombic Pnam crystalline phase of PE.23 The intensity of these reflections, however, suggests that they are not the prevalent phase in the unstretched film. The intense reflections at 14° and 17° dominate the diffractogram. There is an excellent agreement between these and other less intense reflections and the monoclinic Cc phase of polyisopropylene (PP),24 suggesting that the film used is in fact a ethylene/propylene co-polymer—with the propylene component being highly crystalline. This is further supported by the NMR analysis (see ESI†) which suggests that 1.5% of the film by weight is PP. There are also several less intense reflections of varying sharpness present in the diffractogram, suggesting presence of at least one more crystalline or semi-crystalline phase in the sample.
 | ||
| Fig. 3 X-ray diffraction patterns of un-stretched and 2× stretched PE films. | ||
There are significant changes in the diffractogram after stretching 2×. The relative intensities of the reflections characteristic of the orthorhombic crystallites are much stronger than for an unstretched film, suggesting that the crystallites of this structure are now prevalent in the film. The relative intensities of the 22° and 24° reflections (orthorhombic PE) have also changed after stretching suggesting a change in preferred orientation of the crystallites in the film. Other differences include appearance of new reflections at 19° and 36° as well as disappearance of a low intensity sharp reflection at 12°, which suggests profound changes in the relative amounts and orientations of different crystal phases present throughout the film.
Using the Scherrer equation it was possible to estimate the size of the crystallites in the polymer.25 The estimated values for PP crystallites do not change after stretching, while the average size of the PE crystallites decreases with stretching, which is consistent with creation of new (smaller) crystallites in the polymer.
Orienting small molecules on PE
 | ||
| Fig. 4 Spectra of progesterone (deposited from 0.65 mg mL−1 in chloroform for PE and methanol for PEOX and left to dry). LD on (a) PE, and (b) PEOX prestretched by factors ranging from 1 to 2.2×. (c) and (d) LDr for data from (a) and (b) respectively overlaid with absorbance and LD spectra for 1.8× stretch. | ||
We wished to optimise the sample orientation in the films and also to check whether degree of stretching affected the spectroscopy. The progesterone spectra suggest that the maximum LD is obtained with a stretch factor of ∼1.8 and a maximum LDr with factors of ∼2.0. This ran counter to our expectation that more stretching would always correspond to more orientation. For progesterone, and for the other analytes discussed below, the variation in LDr maximum proved to be due mainly to variations in the absorbance; molecules unoriented on the film absorb light but may not contribute to the LD. The film thickness did not change significantly with stretching, though the changes in the spectra do show changes in the binding of the analytes to the PE.
 | (3) |
An overlay of the LD (not baseline corrected) of pyrenecarboxaldehyde (PyCO) as a function of film-rotation angle, χ, is shown in Fig. 5 along with a plot of signals at the LD maxima as a function of χ. The cos(2χ) dependence of the signals means that either the molecule behaves as a uniaxial rod or the film ensures uniaxial orientation or a combination of the two. The equivalent plots for the other molecules discussed below are given in ESI† for both PE and PEOX (Fig. SI1–SI4, ESI†). Within experimental error of loading the sample and noting none of the spectra are baseline corrected, each molecule and film studied in this work behave consistently with a uniaxial orientation mechanism.
 | ||
| Fig. 5 (a) LD (not baseline corrected) of pyrenecarboxaldehyde (deposited from 0.35 mg mL−1 in methanol) on PEOX stretched 1.8× as a function of rotation angle, χ, of the film. 0° is where the stretch direction is as close to horizontal as loading the film in a small circle enabled. (b) LD at wavelength indicated as a function of χ. Dashed line is the plot of cos(2χ). See Fig. 7 for molecular structure. | ||
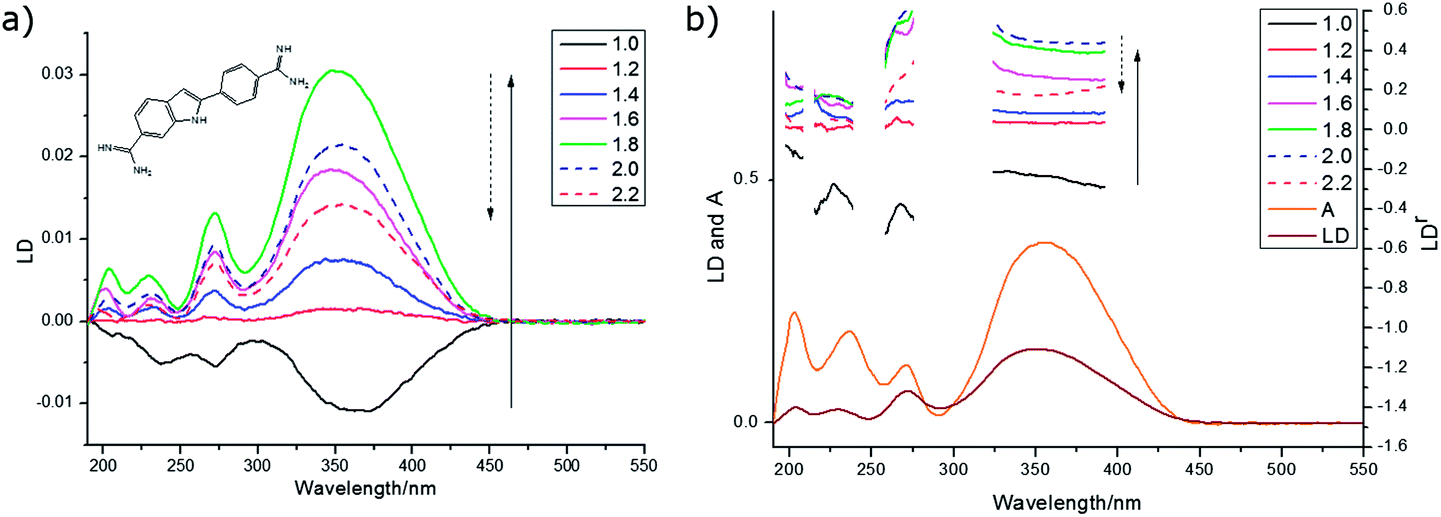 | ||
| Fig. 6 Spectra of DAPI on PEOX (deposited from 0.4 mg mL−1 in methanol and left to dry). (a) LD prestretched by factors ranging from 1 to 2.2×. (b) LDr for data from (a) overlaid with absorbance and LD spectra for 1.8× stretch. | ||
The 270 nm transition for PEOX (Table 2) has the largest value of LDr, so we assume it is along z. It then follows that for the 1.8× stretch PEOX experiment, S = 0.18. The directions of z and the other transition moments can then be deduced from LDr data and are given in Table 2 where the PVA results are also summarized. Transition moment polarizations consistent with both data sets are illustrated in Fig. 7. Overall, the quality of the DAPI–PEOX spectra suggest PEOX can replace PVA for polar molecules making a much simpler quicker experiment.
| Wavelength | PVA angle | PEOX angle | LDr on PEOX |
|---|---|---|---|
| 380 nm | 0–5° | 26° | 0.39 |
| 330 nm | 15–17° | 17° | 0.48 |
| 270 nm | 12–19° | 0° | 0.55 |
| 228 nm | >50° | 45° | 0.14 |
 | ||
| Fig. 7 4′,6-Diamidino-2-phenylindole illustrating approximate transition polarizations consistent with this work and the PVA data of ref. 26. | ||
 | ||
| Fig. 8 LDr spectra of pyrenecarboxaldehyde (deposited from 0.4 mg mL−1 in methanol and left to dry) on films prestretched by factors ranging from 1 to 2.2× overlaid with absorbance and LD spectra for 1.8× stretch. (a) PE and (b) PEOX. | ||
| Wavelength | LDr on PE | LDr on PEOX | Pyrene assignment16 | PyCO assignment |
|---|---|---|---|---|
| 207 nm | 0.39 | 0.64 | ∼0° | |
| 234 nm | 0.53 | 0.62 | +9° | |
| 246–253 nm | 0.57 | 0.51 | 220–240 nm: long | −21° |
| 276 nm | 0.28 | 0.13 | 260 nm: long | −46° |
| 288 nm | 0.077 | 0.038 | 270–280 nm: short | +53° |
| 350–400 nm | 0.51 | 0.56 | 300–340 nm: long | −16° |
 | ||
| Fig. 9 Polarizations of PyCO transitions assuming the orientation direction on PEOX is as indicated by the thick solid line (the longest molecular axis with O lying flat on the film). The thick dashed line is then the orientation axis on PE. | ||
 | ||
| Fig. 10 Spectra of anthracene. (a) Absorbance of anthracene in solution (0.3 mg mL−1 cyclohexane) overlaid on absorbance spectra of 1.8× stretch films (PE) deposited from chloroform solutions of the concentrations indicated in the figure. (b) LD corresponding to (a) film spectra with solution absorbance overlaid normalised to have areas under the curves equal to one. (c) LD (deposited from 0.1 mg mL−1 solution in methanol, to ensure monomer, see text) on PEOX as a function of stretch factor (indicated – sample deposited after stretching). LD deposited from solutions in chloroform in (e) 1 mg mL−1 (g) 8 mg mL−1 as a function of stretch (sample added before stretching). (d), (f), and (h) LDr for data from respectively (c), (e), and (g) overlaid with absorbance and LD spectra for 1.8× stretch. | ||
A further complication is the possibility of anthracene forming dimers (or other higher order structures).29 Chandross et al. identified two dimer forms with different spectroscopy: a so-called sandwich dimer which required a cryogenic glass to stabilize it and a stable dimer (or higher order structure) which they concluded had ∼55° between the short axes and not more than 5° between the long axes. They were unable to study the 254 nm band of their stable dimer of anthracene as they found that the transition was shifted beyond their range of observation.29 Consistent with these structures, the crystal structure30 has two distinct anthracene pairs, one parallel and slightly displaced and one skewed with angles of 54° between the short axes and 14° between the long axes (more information on the angles between the monomer units is given in Table SI1, ESI†). However, we found we could not interpret our film data in terms only of these structures.
Despite being a non-polar molecule, anthracene orients well on both PE and PEOX. The PEOX data are usually slightly better as the sample spreads more uniformly on the film. LD film-rotation experiments show that the anthracene orientation is always uniaxial in our experiments (Fig. SI4, ESI†). By depositing anthracene from a dilute solution of CHCl3 (0.1 mg mL−1) we are able to ensure a fairly pure monomer spectrum as shown by a comparison of the film and solution (methylcyclohexane) absorption spectra (Fig. 10a) where the solution has a slight blue shift relative to the 0.1 mg mL−1 film spectra. The monomer spectra as a function of stretch factor are shown in Fig. 10c and d. The longest wavelength band (the 0–0 vibronic band of the 1La band) in solution absorbance, film absorbance and film LD occurs at ∼378 nm and the main vibronic components occur at ∼1400 cm−1 intervals. The third vibronic band has a positive LD signal indicating that the contribution of the 254 nm band is becoming dominant. If we assume that the LD from 245–258 nm is long axis polarized with α = 0°, then from eqn (2)S ∼ 0.22 for the 1.8× stretch (PE or PEOX). It then follows that the vibronic components of the 377 nm band have average angles as indicated in Table 4 with gradually increasing contribution from the long axis polarized electronic transition. The fact that the 378 nm (fundamental band) α is not 90° reflects the fact that we do have some oligomeric species present (see below).
| Wavelength maximum assuming 1400 cm−1 progression | Wavelength maximum of LD | LD sign | α effective | Fraction of ag progression (assuming only monomer present) |
|---|---|---|---|---|
| 378 nm | 378 nm | — | 75°–90° | 0.93–1.0 |
| 360 nm | 360 nm | — | 62° | 0.78 |
| 342 nm | 339 nm | + | 47° | 0.59 |
| 327 nm | 323.5 nm | + | 34° | 0.45 |
| 313 nm | 309 nm | + | 31° | 0.36 |
Most of our concentrated films showed positive LD signals for the longest wavelength signal at 397 nm (the maximum of the stable dimer of Chandross etal.29) and at 266–267 nm. Some showed negative signals at both 399 nm and at 268 nm. There are at least 4 different component spectra apparent in our spectra, all overlaid on each other and the monomer. The monomer is dominant at low concentration (see above) and becomes dominant at high stretch with medium concentration stock solutions (1 mg mL−1), reflecting the increased crystallinity of the PE with stretch making more monomer binding sites available. The high concentration (8 mg mL−1) spectra seems to be an overlay of the 1 mg mL−1 unstretched spectrum with one that has negative LD occurring at the monomer transition energies for both the long and short axis polarized transitions. There is also a spectrum that has positive signals at energies lower than the monomer transitions (396 nm plus vibronic progression and 268 nm), but which matching higher energy exciton component is small or zero. Another spectrum with negative LD at 399 nm and 268 nm and positive (shoulder) at 230 nm is observed in a 0.5 mg mL−1 film. The features of these spectra are summarized in Table 5.
| Spectrum in which component is most apparent | LD at ∼230 nm | LD at ∼254 nm | LD at ∼268 nm | LD at 379 nm | LD at ∼400 nm | Geometry consistent with LD |
|---|---|---|---|---|---|---|
| Monomer | 0 | +ve | 0 | −ve, from 379 nm 14![[thin space (1/6-em)]](https://www.rsc.org/images/entities/char_2009.gif) 000 cm−1 000 cm−1 |
0 | Fig. 10a |
| 0.5 mg mL−1, Fig. 10b | +ve (sh) | (?) | −ve | −ve, from 399 nm, 16000 cm−1 (large) |
Fig. 10d | |
| 1 mg mL−1, Fig. 10e, unstretched | 0 | (?) | +ve | +ve, from 396 nm, 14800 cm−1 (large) |
Fig. 10c | |
| 1 mg mL−1, Fig. 10e, stretched | 0 | + | +ve (small) | −ve | +ve (small) | Fig. 10a and c |
| 8 mg mL−1, Fig. 10g, stretched | 0 | −ve | 0 | −ve (large), from 378 nm, ∼14000 cm−1 |
0 | Fig. 10b |
The monomer, as discussed above, is uniaxially oriented with its long axis along the stretch direction giving positive 250 nm LD and negative 379 nm LD. The complex spectral features discussed above are the result of higher order anthracene structures adopting other orientations on the film and exciton coupling to give signals at higher and lower energies usually with one positive and one negative in sign.
To have completely negative LD at the monomer transitions (8 mg mL−1, last line of Table 5), the anthracenes must be oriented with their planes perpendicular to the stretch direction. If the anthracenes have parallel molecular planes, but the nearest neighbor long axes are twisted by 90° with respect to one another then there is zero exciton energy shift (see ESI†). An extended cross-hatched structure as illustrated in Fig. 11b is consistent with this and is expected to be stable on the stretched film. We postulate this is what is happening in the 8 mg mL−1 film. The geometries giving rise to the 1 mg mL−1 unstretched and 0.5 mg mL−1 spectra are harder to identify uniquely. Possible arrangements include the following. A geometry similar to that of the skew pair in the crystal structure32 gives rise to almost no intensity for the out-of-phase couplings for both long and short-axis anthracene transitions and (if the long axes are along the stretch direction) positive LD for the in-phase coupling (Table SI2, ESI†). A geometry where one layer of anthracenes are aligned in a head-to-tail trail along the stretch direction (as are the monomers) and a second layer is tilted as in the crystal (14.4° between long axes and 54° between short axes) but displaced enough to ensure V < 0 (Table SI1, ESI†) as illustrated in Fig. 11c accounts for the 1 mg mL−1 unstretched spectrum. The 0.5 mg mL−1 spectrum is consistent with a geometry where the first layer is the same as this but the second layer has the molecules parallel to the first and rotated about X axis by 2γ = 60° (Fig. 11c). This geometry has V > 0 (Table SI1, ESI†), both in-phase and out-of-phase short axis transitions positive, and long-axis in-phase positive but out-of-phase negative.
 | ||
| Fig. 11 The three proposed orientations of anthracene on PEOX films, (a) uniaxially oriented single molecules, (b) extended cross-hatched structure and (c) skewed dimers. | ||
Conclusions
In this work we have shown that we can change the surface properties of polyethylene (PE) by oxygen plasma treatment enough to enable even the most polar of small molecules to be oriented on its oxidised surface (PEOX). Overall, the quality of the DAPI PEOX spectra suggest PEOX can replace polyvinyl alcohol for polar molecules making a much simpler and quicker experiment. In general we found that the sample deposition was more uniform with the PEOX surfaces making it usually the preferred substrate. The orientation of our films increased with stretch factor due to changes in crystallinity and crystallite orientation in the PE substrate (which also includes crystalline polypropylene). For some molecules (e.g. 1-pyrenecarboxaldehyde) we found the different interactions between analyte and the two films enabled us to assign transition moments of low symmetry molecules. Easy transition moment assignment follows if the molecules orient uniaxially on the polymer film. We have shown that a simple matrix rotation experiment can be used to determine whether or not the orientation may be assumed to be uniaxial.Our work on anthracene stretched film samples shows the importance of knowing what is being studied. For anthracene, the analyte must be deposited from quite low concentration solutions to ensure monomers dominate the spectroscopy. Films prepared from high concentration stock solutions of anthracene showed a variety of different higher order structures with corresponding variations in spectra resulting from different exciton couplings. The LD sign patterns can be readily used to eliminate possible oligomer geometries, however, the overlay of spectra for different structures usually makes it challenging to definitively identify structures.
Acknowledgements
XPS data were collected at the Science City Photoemission Facility, University of Warwick and contact angle measurements were performed using the Science City Advanced materials 2 Facility. The equipment used was obtained through Birmingham Science City: Innovative Uses for Advanced Materials in the Modern World with support from Advantage West Midlands (AWM) and part funded by the European Regional Development Fund (ERDF). The Jasco J-815 spectropolarimeter was obtained through Biotechnology and Biological Sciences Research Council grant (BBSRC; grant no. BB/F011199/1). The authors would like to thank Richard Walton for his help with X-ray diffraction experiments and Christopher Kay for his help with NMR data collection and analysis.Notes and references
- B. Nordén and F. Tjerneld, FEBS Lett., 1976, 67, 368–370 CrossRef.
- P. E. Schipper, B. Nordén and F. Tjerneld, Chem. Phys. Lett., 1980, 70, 17–21 CrossRef CAS.
- C. Hiort, B. Nordén and A. Rodger, J. Am. Chem. Soc., 1990, 112, 1971–1982 CrossRef CAS.
- A. Rodger, I. S. Blagbrough, G. Adlam and M. L. Carpenter, Biopolymers, 1994, 34, 1583–1593 CrossRef CAS PubMed.
- D. Z. Coggan, I. S. Haworth, P. J. Bates, A. Robinson and A. Rodger, Inorg. Chem., 1999, 38, 4486–4497 CrossRef CAS PubMed.
- R. Marrington, T. R. Dafforn, D. J. Halsall, M. Hicks and A. Rodger, Analyst, 2005, 130, 1608–1616 RSC.
- M. Ardhammar, N. Mikati and B. Nordén, J. Am. Chem. Soc., 1998, 120, 9957–9958 CrossRef CAS.
- A. Rodger, J. Rajendra, R. Marrington, M. Ardhammar, B. Nordén, J. D. Hirst, A. T. B. Gilbert, T. R. Dafforn, D. J. Halsall, C. A. Woolhead, C. Robinson, T. J. Pinheiro, J. Kazlauskaite, M. Seymour, N. Perez and M. J. Hannon, Phys. Chem. Chem. Phys., 2002, 4, 4051–4057 RSC.
- M. Hicks, T. Dafforn, A. Damianoglou, P. Wormell, A. Rodger and S. Hoffman, Analyst, 2009, 134, 1623–1628 RSC.
- E. Small, R. Marrington, A. Rodger, D. J. Scott, K. Sloan, D. Roper, T. R. Dafforn and S. G. Addinall, J. Mol. Biol., 2007, 369, 211–221 CrossRef PubMed.
- R. Marrington, M. Seymour and A. Rodger, Chirality, 2006, 18, 680–690 CrossRef CAS PubMed.
- J. Rajendra and A. Rodger, Chem. – Eur. J., 2005, 11, 4841–4848 CrossRef CAS PubMed.
- Y. Zou, K. Razmkhah, N. P. Chmel, I. W. Hamley and A. Rodger, RSC Adv., 2013, 3, 10854–10858 RSC.
- B. Nordén, A. Rodger and T. R. Dafforn, Linear dichroism and circular dichroism: a textbook on polarized spectroscopy, Royal Society of Chemistry, Cambridge, 2010 Search PubMed.
- M. A. Ismail, K. J. Sanders, G. C. Fennel, H. C. Latham, P. Wormell and A. Rodger, Biopolymers, 1998, 46, 127–143 CrossRef CAS.
- E. W. Thulstrup, J. Michl and J. H. Eggers, Phys. Chem., 1970, 74, 3878–3884 CrossRef.
- A. Wirtz, C. Hofmann and E. Groenen, ChemPhysChem, 2011, 12, 1519–1528 CrossRef CAS PubMed.
- E. W. Thulstrup, J. Michl and J. H. Eggers, J. Phys. Chem., 1970, 74, 3868–3877 CrossRef CAS.
- H. Juul and S. Vrønning Hoffmann, private communication, 2009.
- D. Briggs and N. Fairley, Surf. Interface Anal., 2002, 33, 283–290 CrossRef CAS.
- B. Tissington, G. Pollard and I. M. Ward, Compos. Sci. Technol., 1992, 44, 185–195 CrossRef CAS.
- S.-G. Lee, T.-J. Kang and T.-H. Yoon, J. Adhes. Sci. Technol., 1998, 12, 731–748 CrossRef CAS PubMed.
- C. W. Bunn, Trans. Faraday Soc., 1939, 35, 482–491 RSC.
- G. Natta and P. Corradini, Nuovo Cimento, 1960, 15, 40–51 CrossRef CAS.
- A. L. Patterson, Phys. Rev., 1939, 56, 978–982 CrossRef CAS.
- M. Kubista, B. Åkerman and B. Albinsson, J. Am. Chem. Soc., 1989, 111, 7031–7035 CrossRef CAS.
- D. M. Friedrich, R. Mathies and A. C. Albrecht, J. Mol. Spectrosc., 1974, 51, 166–188 CrossRef CAS.
- J. Michl, E. W. Thulstrup and J. H. Eggers, Ber. Bunsen-Ges. Phys. Chem., 1974, 78, 575–586 CAS.
- E. A. Chandross, J. Ferguson and E. G. McRae, J. Chem. Phys., 1966, 45, 3546–3553 CrossRef CAS PubMed.
- A. M. Mathieson, J. M. Robertson and V. C. Sinclair, Acta Crystallogr., 1950, 3, 245 CrossRef CAS.
- M. Kasha, H. R. Rawls and M. Ashraf El-Bayoumi, Pure Appl. Chem., 1965, 11, 371–392 CrossRef CAS.
- A. M. Mathieson, J. M. Robertson and V. C. Sinclair, Acta Crystallogr., 1950, 3, 245–250 CrossRef CAS.
Footnote |
| † Electronic supplementary information (ESI) available: Additional experimental details and data, and derivation of the equations used. See DOI: 10.1039/c3an02322b |
| This journal is © The Royal Society of Chemistry 2014 |