 Open Access Article
Creative Commons Attribution 3.0 Unported Licence
Self-reporting hybridisation assay for miRNA analysis
Jo-Anne
Riley
a,
Tom
Brown
a,
Nittaya
Gale
b,
Julie
Herniman
a and
G. John
Langley
*a
aChemistry, FNES, University of Southampton, Southampton, SO17 1BJ, UK. E-mail: gjl@soton.ac.uk; Tel: +44 (0)23 8059 2182
bATDBio LTD, University of Southampton, Southampton, SO17 1BJ, UK. E-mail: n.gale@soton.ac.uk; Fax: +44 (0)23 8059 2991; Tel: +44 (0)23 8059 6778
First published on 2nd January 2014
Abstract
Hybridisation assays, which are commonly used to analyse oligonucleotides such as siRNAs and miRNAs, often employ detection probes with fluorescent tags. The signal emitted by a fluorescent tag covers a broad range of wavelengths and this limits the multiplexing potential due to overlapping signals. A novel method of indirect oligonucleotide analysis has been developed which combines a hybridisation assay with cleavable small molecule mass tags using HPLC-ESI MS detection. A self-reporting detection probe has been designed which incorporates a DNA/RNA chimeric oligonucleotide sequence in the reporter region, which generates small nucleotide products upon RNase cleavage of the ribose-phosphate backbone. These small nucleotides can then serve as mass tags for the indirect detection of oligonucleotide analytes. The narrow mass range covered by a small molecule mass tag combined with the wide range of possible mass tags provides a high degree of multiplexing potential. This approach has been demonstrated for the analysis of a synthetic miRNA.
Introduction
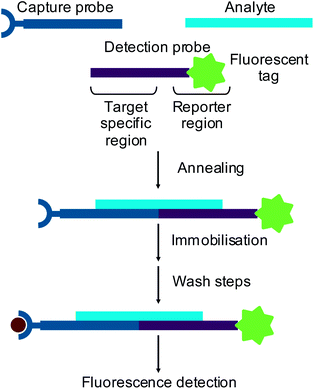
Small interfering RNAs (siRNAs)1 and microRNAs (miRNAs)2 are short (∼20 nt) oligonucleotides which are involved in genetic regulation. Through recently discovered naturally occurring mechanisms, these oligonucleotides can regulate protein synthesis in vivo by base pairing to complementary messenger RNA (mRNA) to prevent translation. This type of regulation has been shown to be important in many normal cellular processes3 and has also been linked to a wide variety of diseases.4 The understanding of these regulatory mechanisms has provided the potential to use oligonucleotides as therapeutic agents to treat many diseases. Consequently, novel methods of oligonucleotide analysis are required to support the drug discovery and development process.Standard methods of RNA analysis now rely on hybridisation assays with fluorescence detection. In a hybridisation assay an oligonucleotide analyte is captured onto a solid support using an immobilised complementary probe. Sandwich hybridisation assays use a detection probe designed with a region complementary to part of the target analyte and a labelled reporter region5,6 (Fig. 1). Alternatively, reverse transcription of an RNA analyte can be performed in the presence of fluorescently labelled dNTPs to produce fluorescently labelled cDNA, which is then used as a surrogate for the RNA.
A fluorescent label generates a broad signal covering a wide wavelength range. This limits the use of fluorescent labels in a multiplexed system due to overlapping signals. Two colour systems are often employed where two fluorescent labels are used for RNA from two different biological samples, e.g. two different cell types or diseased and non-diseased tissue. Samples can then be mixed and analysed simultaneously for a direct comparison.
An alternative to using fluorescent tags is the use of cleavable small molecule mass tags, which can be employed for the indirect analysis of large biomolecules with detection by mass spectrometry. Mass tags have been used for oligonucleotide analysis where a small molecule label was conjugated to an oligonucleotide probe via a synthetic photocleavable linker which was cleaved during the matrix-assisted desorption/ionisation (MALDI) process7–10 or a synthetic linker cleaved during the electrospray ionisation (ESI) process.11
Previous work has shown that the ribose-phosphate backbone of RNA can be used as a built-in enzyme cleavable linker, which upon cleavage of custom designed oligonucleotides with a specific ribonuclease can produce mono- di- or trinucleotide digestion products. These small molecules could themselves be used as mass tags with HPLC-ESI MS or MALDI-TOF MS analysis.12 Here, this approach has been combined with a hybridisation assay, where the detection probe has been designed to include a target specific region at one end and a DNA/RNA chimeric reporter region at the other end. This reporter region is designed to produce bromine labelled small molecule mass tags upon RNase digestion. Use of these self-reporting probes has been demonstrated for the indirect analysis of miRNA as an alternative to fluorescent labels for oligonucleotide analysis, giving a greater potential for multiplexing.
miRNA-155 was chosen as target analyte for this proof of concept hybridisation assay due to the wide range of processes it is reported to affect, including the immune system13 and autoimmune diseases14 including rheumatoid arthritis,15 lupus,16 and multiple sclerosis.17
Results
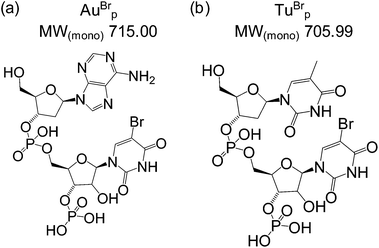
A biotinylated capture probe and a self-reporting detection probe were designed to target the miRNA-155 sequence (Table 1). The reporter region of the detection probe was designed to be cleaved by RNase A to release the bromine labelled dinucleotide mass tag AuBrp into solution (Fig. 2(a)). RNase A is an endoribonuclease which cleaves the phosphate group at the 3′ side of cytidine and uridine bases to produce 3′ phosphate and 5′-OH oligonucleotides and also cleaves at the 3′ side of 5-bromouridine.| ID | Sequence (5′ → 3′) | MW(av) |
|---|---|---|
| a Upper case = DNA, lower case = RNA, uBr = 5-bromouridine, + = LNA, underline = site of mutation. | ||
| Capture probe | CGATTA + G + C + ATTAATTT-biotin | 5537.9 |
| Detection probe 1 | TTTTTTcAuBrAuBrAuBrTTTTTACC + C + C + TATCA | 8790.1 |
| Detection probe 2 | TTTTTTcTuBrTuBrTuBrTTTTTACC + C + G + TATCA | 8789.1 |
| miRNA-155 | uuaaugcuaaucgugauaggggu | 7389.4 |
| RNA-c | uuaaugcuaaucgugaua![[c with combining low line]](https://www.rsc.org/images/entities/char_0063_0332.gif) gggu gggu |
7349.4 |
| RNA-a | uuaaugcuaaucgugaua![[a with combining low line]](https://www.rsc.org/images/entities/char_0061_0332.gif) gggu gggu |
7373.4 |
| RNA-u | uuaaugcuaaucgugaua![[u with combining low line]](https://www.rsc.org/images/entities/char_0075_0332.gif) gggu gggu |
7350.4 |
| RNA-scrambled | aggugcaugucgaauuaguauug | 7389.4 |
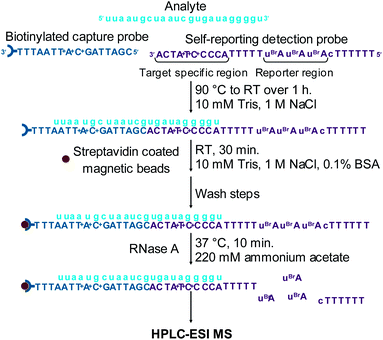
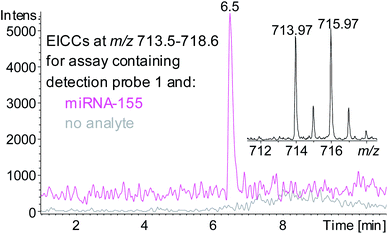
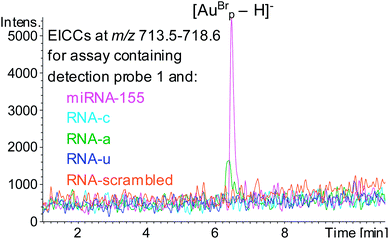
A sandwich hybridisation assay was performed with biotinylated capture probe, detection probe 1 and miRNA-155 (Fig. 3). A control assay which omitted miRNA-155 was also performed. Following the hybridisation, capture, washing and enzyme digestion steps, HPLC-ESI MS analysis of the solution of the assay containing miRNA-155 showed that AuBrp was observed. The singly deprotonated species was seen with the distinctive bromine isotope pattern, giving a peak in the extracted ion current chromatogram (EICC) at tR 6.5 min. For the control assay, no evidence of AuBrp was observed by UV or MS, i.e. the mass tag was only observed when the analyte was present (Fig. 4).
The specificity of the hybridisation assay was evaluated by using RNA analytes with the sequence of miRNA-155 but with single base substitution mutations at position 19 (RNAc, RNAa and RNAu, Table 1) in place of miRNA-155. HPLC ESI MS analysis following these assays showed that for the assays containing RNA-c or RNAu no evidence of the mass tag was observed, however for the assay containing RNA-a AuBrp was observed. This highlights a limitation of hybridisation assays for oligonucleotide analysis (Fig. 5). The UV and the MS peak areas relating to the mass tag for the assay containing RNA-a were 18% and 28%, respectively, compared to the assay containing the target analyte.
To test the potential for multiplexing, a detection probe was designed to target RNAc with a reporter region designed to produce the mass tag TuBrp (Fig. 2(b) and Table 1). An assay was performed with biotinylated capture probe, detection probe 1, miRNA-155, detection probe 2 and RNAc. Following the hybridisation assay, capture, washing and enzyme digestion steps, HPLC-ESI MS analysis of the solution showed both mass tags AuBrp and TuBrp were observed as the singly deprotonated species (Fig. 6).
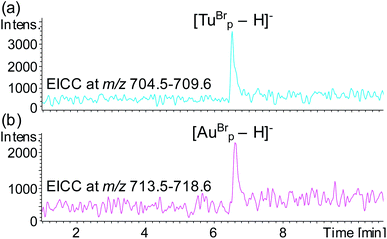 | ||
| Fig. 6 EICCs of m/z (a) 704.5–709.6 ([TuBrp − H]−) and (b) 713.5–718.6 ([AuBrp − H]−) for the hybridisation assay containing capture probe, detection probe 1, miRNA-155, detection probe 2 and RNA-c. | ||
Discussion
Results of the assays presented above demonstrate that HPLC-ESI MS can be used for the indirect analysis of miRNA via cleavable small molecule mass tags. Integration of the custom designed sequence at the reporting end of the detection probe allows the production of cleavable small molecule mass tags without the need for custom design or synthesis of a cleavable linker, which is required by existing mass tag technologies.Locked nucleic acids (LNAs)18,19 were incorporated into the design of the capture and detection probes as they have been shown to improve base pair mismatch discrimination.20 Washing steps were also performed prior to analysis to ensure the assay is specific for the target analyte. However, oligonucleotides with sequences similar to the target analyte, e.g. with single base substitution mutations, can hybridise to probes designed for the analyte, although the stability of the mismatched duplex, i.e. melting temperature (Tm), will be lower. If the mismatched sequence remains bound, it will produce a signal for the mass tag and if present in an assay which also contains the target sequence it will contribute to the signal of the analyte. Inability to discriminate between similar sequences is a limitation of hybridisation assays, however only one of the mismatched analytes tested gave a signal for the mass tag, whereas for the other mismatched analytes, no evidence of the mass tag was observed (Fig. 5).
A significant advantage of the approach presented here over assays which use fluorescence detection is the potential for multiplexing. Signals produced by fluorophores are broad, typically covering around 100 nm in a wavelength window of approximately 600 nm. In contrast, ion signals from bromine labelled small molecule mass tags cover in the region of 6 Da, taking into account all isotopic contributions, in a mass window of approximately 1000 Da. This allows many mass tags to be simultaneously analysed without overlapping signals. By using nucleotide digestion products as small molecule mass tags, the identity of the bases, and therefore the masses of the digestion products, can be changed to give a range of possible mass tags. This range of mass tags could be further extended by the use of chlorine or multiple chlorine and/or bromine atoms as labels or synthesis of bases containing custom isotope patterns. Introducing additional functional groups would also further extend the multiplexing possibilities.
Experimental
Materials and reagents
Trizma base, NaCl, acetylated bovine serum albumin (BSA), sodium dodecyl sulfate (SDS), ammonium acetate and RNase A were biological grade and were obtained from Sigma (Poole, UK) and used without further purification. Magnetic beads used were Dynabeads® MyOne Streptavidin C1 (Life Technologies). All water used was obtained from an Elga system at 15 MΩ and was autoclaved prior to use.Oligonucleotide synthesis and purification
Oligonucleotide synthesis was performed on an Applied Biosystems 394 automated DNA/RNA synthesiser. The phosphoramidite monomers used for DNA/RNA/LNA chimera synthesis were dmf-dG-CE, Bz-dA-CE, Bz-dC-CE, dT-CE, 5-Br-rU-CE and Ac-rC and were purchased from Link Technologies Ltd (Lanarkshire, UK) and Applied Biosystems Ltd (Paisley, UK). The LNA amidites used were LNA™-A(Bz), LNA™-mC(Bz), LNA™-G(dmf) and LNA™-T purchased from Exiqon (Vedbæk, Denmark). All oligonucleotides were synthesised on standard 1.0 μmol DNA phosphoramidite cycle, except where stated, with the following steps; acid catalysed detritylation, coupling, capping and iodine oxidation. Directly before use, β-cyanoethyl phosphoramidite RNA and DNA monomers were dissolved in anhydrous acetonitrile, to a 0.1 M concentration. The LNA monomers were also dissolved in acetonitrile except LNA™-mC(Bz) which was dissolved in anhydrous THF–acetonitrile (4![[thin space (1/6-em)]](https://www.rsc.org/images/entities/char_2009.gif) :
:![[thin space (1/6-em)]](https://www.rsc.org/images/entities/char_2009.gif) 6, v/v) and left over 3 Å activated molecular sieves for 4 hours before use. Coupling time for the standard DNA monomers was 40 seconds and for the RNA and LNA monomers was 480 seconds. For the first monomer after the biotin TEG resin, coupling time was extend to 120 seconds using 5-benzylthio-1H-tetrazole (BTT) as the coupling reagent. Oxidation time for the RNAs/LNAs was extended from 15 seconds to 40 seconds. Cleavage from the solid support in conjunction with exocyclic amino group deprotection was completed by exposing the solution to a mixture of aqueous ammonia and ethanol (3
6, v/v) and left over 3 Å activated molecular sieves for 4 hours before use. Coupling time for the standard DNA monomers was 40 seconds and for the RNA and LNA monomers was 480 seconds. For the first monomer after the biotin TEG resin, coupling time was extend to 120 seconds using 5-benzylthio-1H-tetrazole (BTT) as the coupling reagent. Oxidation time for the RNAs/LNAs was extended from 15 seconds to 40 seconds. Cleavage from the solid support in conjunction with exocyclic amino group deprotection was completed by exposing the solution to a mixture of aqueous ammonia and ethanol (3![[thin space (1/6-em)]](https://www.rsc.org/images/entities/char_2009.gif) :
:![[thin space (1/6-em)]](https://www.rsc.org/images/entities/char_2009.gif) 1, v/v) for 12 hours at room temperature.
1, v/v) for 12 hours at room temperature.
Purification of oligonucleotides was achieved by reversed-phase HPLC using a Gilson system with an 805 manometric module, 811C dynamic mixer, 306 pump and a 118 UV/vis detector. A Phenomenex C8 column (10 μm, 10 mm × 250 mm) was used for separation. The following protocols were used: run time 20 min, flow rate 4 mL min−1, binary gradient: time in min (% buffer B); 0 (0); 3 (0); 3.5 (5); 15 (45); 16 (100); 17 (100); 17.5 (0); 20 (0). Buffer A: 0.1 M triethylammonium acetate (TEAA) in water, pH 7.0, buffer B: 0.1 M TEAA in water–acetonitrile (1![[thin space (1/6-em)]](https://www.rsc.org/images/entities/char_2009.gif) :
:![[thin space (1/6-em)]](https://www.rsc.org/images/entities/char_2009.gif) 1), pH 7.0. Elution of oligonucleotides was monitored by UV absorption. Oligonucleotides were then desalted using NAP 25 and NAP 10 Sephadex columns (G 25, GE-Healthcare), aliquoted into eppendorf tubes and stored at −20 °C.
1), pH 7.0. Elution of oligonucleotides was monitored by UV absorption. Oligonucleotides were then desalted using NAP 25 and NAP 10 Sephadex columns (G 25, GE-Healthcare), aliquoted into eppendorf tubes and stored at −20 °C.
Buffer preparation
Binding buffer was prepared as 10 mM tris and 1 M NaCl in water, adjusted to pH 7.2 with HCl. Wash buffer was prepared as 10 mM tris and 0.1% SDS in water. Ammonium acetate buffer was prepared as 220 mM ammonium acetate in water.21 All buffers were filtered and degassed prior to use.Hybridisation assays
Each hybridisation assay with individual analytes was undertaken using the following oligonucleotides: capture probe (150 pmol), miRNA analyte (150 pmol) and detection probe (200 pmol) in binding buffer (250 μL). For the control assay the analyte was omitted. For the assay using two analytes the following oligonucleotides were used: capture probe (300 pmol), miRNA-155 (150 pmol), RNA-c (150 pmol), detection probe 1 (200 pmol) and detection probe 2 (200 pmol) and the amount of beads and volumes of buffers used were doubled. Samples were heated to 90 °C for 15 minutes and then cooled to room temperature over 1 h for annealing to take place. Streptavidin coated magnetic beads (30 μL, 300 μg) were washed with binding buffer (3 × 500 μL) and then to the beads was added the hybridised oligonucleotide solution along with BSA (0.1%). The solution was vortexed and then incubated at room temperature for 30 min for immobilisation. The beads were then isolated using a magnet, washed with binding buffer (2 × 500 μL), wash buffer (2 × 500 μL) and water (2 × 500 μL) and resuspended in binding buffer (250 μL). The solution was then heated to 56 °C for 10 minutes, a temperature which was determined by melting temperature analyses. The solution was then washed with binding buffer heated to 56 °C, (2 × 500 μL), wash buffer (2 × 500 μL) and water (2 × 500 μL) and re-suspended in ammonium acetate buffer (20 μL). The assay was then heated to 37 °C and RNase A was added (10 μL, 0.1 Kunitz units22 per μg detection probe, in ammonium acetate buffer) and the solution was incubated at 37 °C for 10 minutes. The beads were then isolated and 5 μL supernatant was diluted in 15 μL water and analysed using HPLC-ESI MS.HPLC-ESI MS analysis
HPLC separation was performed using a Dionex UltiMate 3000 liquid chromatography system with a quaternary solvent delivery system, UV/visible detector, heated column compartment and chilled autosampler (Dionex, Hemel Hempstead, UK). An Acquity UPLC BEH C18 column (1.7 μm, 1 mm × 100 mm, Waters, Milford, MA, USA) was used for separation. The column temperature was set to 40 °C and UV absorbance was measured at 290 nm. A binary gradient solvent system was used with mobile phase A consisting of 10 mM TEAA and 100 mM hexafluoroisopropanol (HFIP) in water and mobile phase B consisting of 20 mM TEAA in acetonitrile. Mobile phase B was at 1% for 1 minute, then increased to 20% over 7 minutes, then increased to 40% over 2 minutes and then returned to 1% until 13 minutes. A flow rate of 100 μL min−1 and a 2 μL injection volume were used. Negative ion ESI data were acquired using a MicrOTOF (Bruker, Bremen, Germany) mass spectrometer over the m/z range 250–3500. Data were analysed using Data Analysis™ software v4.0.Conclusions
Self-reporting probes have been used in a sandwich hybridisation assay for the indirect analysis of miRNA with HPLC ESI MS detection. The probes which have an analyte complementary region at one end and a DNA/RNA chimeric reporter region designed to produce small molecule mass tags upon RNase A cleavage at the other end. Use of the ribose-phosphate group of the RNA molecule as an enzyme cleavable linker eliminates the need for design and synthesis of a cleavable linker and this approach provides a much higher degree of multiplexing potential than commonly used fluorescent labels.Acknowledgements
The authors thank BBSRC/Pfizer for the PhD CASE Award and ATDBio for oligonucleotide synthesis.Notes and references
- A. Fire, S. Q. Xu, M. K. Montgomery, S. A. Kostas, S. E. Driver and C. C. Mello, Nature, 1998, 391, 806–811 CrossRef CAS PubMed.
- R. C. Lee, R. L. Feinbaum and V. Ambros, Cell, 1993, 75, 843–854 CrossRef CAS.
- L. He and G. J. Hannon, Nat. Rev. Genet., 2004, 5, 522–531 CrossRef CAS PubMed.
- M. I. Almeida, R. M. Reis and G. A. Calin, Mutat. Res., Fundam. Mol. Mech. Mutagen., 2011, 717, 1–8 CrossRef CAS PubMed.
- A. R. Dunn and J. A. Hassell, Cell, 1977, 12, 23–36 CrossRef CAS.
- M. Ranki, A. Palva, M. Virtanen, M. Laaksonen and H. Soderlund, Gene, 1983, 21, 77–86 CrossRef CAS.
- J. Olejnik, H. C. Ludemann, E. Krzymanska-Olejnik, S. Berkenkamp, F. Hillenkamp and K. J. Rothschild, Nucleic Acids Res., 1999, 27, 4626–4631 CrossRef CAS PubMed.
- N. Hammond, P. Koumi, G. J. Langley, A. Lowe and T. Brown, Org. Biomol. Chem., 2007, 5, 1878–1885 CAS.
- M. Kokoris, K. Dix, K. Moynihan, J. Mathis, B. Erwin, P. Grass, B. Hines and A. Duesterhoeft, Mol. Diagn., 2000, 5, 329–340 CAS.
- R. Ball, P. S. Green, N. Gale, G. J. Langley and T. Brown, Artificial DNA: PNA & XNA, 2010, 1, 27–35 Search PubMed.
- A. Thompson, M. Prescott, N. Chelebi, J. Smith, T. Brown and G. Schmidt, Nucleic Acids Res., 2007, 35, e28 CrossRef PubMed.
- J.-A. Riley, T. Brown, N. Gale, J. Herniman and G. J. Langley, Analyst, 2012, 137, 5817–5822 RSC.
- A. Rodriguez, E. Vigorito, S. Clare, M. V. Warren, P. Couttet, D. R. Soond, S. van Dongen, R. J. Grocock, P. P. Das, E. A. Miska, D. Vetrie, K. Okkenhaug, A. J. Enright, G. Dougan, M. Turner and A. Bradley, Science, 2007, 316, 608–611 CrossRef CAS PubMed.
- R. X. Leng, H. F. Pan, W. Z. Qin, G. M. Chen and D. Q. Ye, Cytokine Growth Factor Rev., 2011, 22, 141–147 CrossRef CAS PubMed.
- J. Stanczyk, D. A. L. Pedrioli, F. Brentano, O. Sanchez-Pernaute, C. Kolling, R. E. Gay, M. Detmar, S. Gay and D. Kyburz, Arthritis Rheum., 2008, 58, 1001–1009 CrossRef PubMed.
- R. J. Dai, Y. Zhang, D. Khan, B. Heid, D. Caudell, O. Crasta and S. A. Ahmed, PLoS One, 2010, 5, e14302 Search PubMed.
- A. Junker, M. Krumbholz, S. Eisele, H. Mohan, F. Augstein, R. Bittner, H. Lassmann, H. Wekerle, R. Hohlfeld and E. Meinl, Brain, 2009, 132, 3342–3352 CrossRef PubMed.
- S. Obika, D. Nanbu, Y. Hari, K. Morio, Y. In, T. Ishida and T. Imanishi, Tetrahedron Lett., 1997, 38, 8735–8738 CrossRef CAS.
- A. A. Koshkin, S. K. Singh, P. Nielsen, V. K. Rajwanshi, R. Kumar, M. Meldgaard, C. E. Olsen and J. Wengel, Tetrahedron, 1998, 54, 3607–3630 CrossRef CAS.
- Y. You, B. G. Moreira, M. A. Behlke and R. Owczarzy, Nucleic Acids Res., 2006, 34, e60 CrossRef PubMed.
- M. Hossain and P. A. Limbach, Anal. Bioanal. Chem., 2009, 394, 1125–1135 CrossRef CAS PubMed.
- M. Kunitz, J. Biol. Chem., 1946, 164, 563–568 CAS.
| This journal is © The Royal Society of Chemistry 2014 |

