Synthesis and photocatalytic performance of quasi-fibrous ZnO

Sangeeta Adhikaria, Debasish Sarkar*a and Giridhar Madrasb
aDepartment of Ceramic Engineering, National Institute of Technology, Rourkela, India. E-mail: dsarkar@nitrkl.ac.in; Tel: +91 0661-2462207
bDepartment of Chemical Engineering, Indian Institute of Science, Bangalore, India

Received 28th August 2014 , Accepted 22nd October 2014

First published on 23rd October 2014


Abstract

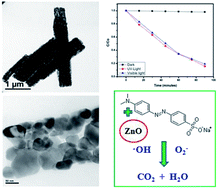
The combustion of oxidizer zinc nitrate and fuel oxalic acid results in quasi-fibrous zinc oxide. The processing parameters including oxidizer to fuel ratio, time and temperature were optimized for the resultant crystal structure and morphology. Pure hexagonal phase formation does not depend on the fuel ratio, but a stoichiometric ratio of oxidizer to fuel at 450 °C and 30 min results in highly crystalline ZnO with 3 μm length and 0.5 μm width. This quasi-fiber originates from partial fusion of near spherical, ∼60 nm particles during the rapid rate of reaction in the combustion process. Transmission electron microscopic analysis confirms the anisotropic primary particle orientation and pore distribution within the developed quasi-fibrous particles. The degradation of methyl orange was assessed by degrading the dye in the presence of the synthesized ZnO (2.95 eV) under both UV and visible light. Quasi-fibrous zinc oxide exhibits effective photocatalytic efficiency under visible light irradiation.

1. Introduction

Zinc oxide is an n-type semiconductor that occurs as a stable hexagonal wurtzite structure at room temperature.1 The interesting properties like piezoelectricity, large photoconductivity, semiconducting properties, wide energy band gap and high excitonic binding energy make it suitable for various applications in the field of photoelectrics, UV-light emitters, window materials, solar blind photodetectors, transparent power electronics, displays etc.2–4 Moreover, its greater ability to harvest solar energy than that of TiO2 makes it useful in the field of photocatalysis.5 In the above mentioned applications, the parameters that play a key role are the morphology, grain size and surface area of the particles. There are several methods such as precipitation,6 hydrothermal,7 template based growth,8 sol–gel,9 solvothermal,10 and combustion synthesis11 for the synthesis of nanosized ZnO. Combustion synthesis (CS) has many advantages such as high production rate, energy efficiency, low processing cost and easy tailoring of the properties. This method requires low cost starting materials with no requirement for high temperature furnaces. The self-propagating exothermic redox reaction during combustion takes place with environmentally friendly by-products.12 The major advantage of combustion synthesis is that this method yields highly porous structures that could be beneficial for photochemical applications.

The influence of zinc nitrate to glycine ratio has been studied by Hwang et al.13 Fuels such as valine, β-alanine, zinc acetate and acrylamide have been successfully tested for the synthesis of ZnO nanopowders where the smallest crystallite size was obtained with acrylamide fuel.14 Lin et al. prepared ZnO particles, rod like structures and tetra-pod whiskers using metallic zinc and glycine in the presence of zinc nitrate as oxidant.15 A pure mesoporous nanosized ZnO powder has been synthesized using various fuels like citric acid, dextrose, glycine, oxalyl dihydrazide, oxalic acid and urea. The photocatalysis of ZnO nanopowders obtained from oxalic acid showed highest activity for the degradation of orange G dye.16 The thermal decomposition of zinc acetate in the presence of oleic acid as fuel was studied to fabricate size dependent ZnO nanocrystals for enhanced photocatalytic activity.17 As reported, oxalic acid has proved to be an efficient fuel for the synthesis of highly porous crystalline ZnO nanopowders. Therefore, in the present study, we have chosen oxalic acid as fuel with zinc nitrate as the precursor to synthesize ZnO nanopowders. The synthesized materials were then characterized in terms of phase, morphology and functional groups through physicochemical techniques. The photocatalytic ability of the synthesized ZnO was determined by degrading a dye, methyl orange.

2. Experimental procedure

2.1. Synthesis of ZnO quasi-fiber

A similar synthesis procedure was given by Potti et al.16 Zinc oxide (ZnO) quasi-fiber was formed by the combustion synthesis method. According to this method, stoichiometric composition of oxalic acid as fuel and zinc nitrate hexahydrate as oxidizer was dissolved in minimal amount of water in a beaker to form a solution. The prepared solution was kept in a preheated muffle furnace at 450 ± 10 °C until complete combustion. Higher temperature was required for complete decomposition of the intermediates formed during the combustion reaction. After complete combustion, a white colored porous material was formed. The stoichiometric composition of both fuel and oxidizer was calculated based on the concepts of propellant chemistry of solution combustion synthesis by taking oxidizing and reducing valences, respectively.18 The experiments have been carried out by varying the oxidizer by fuel ratio, time and combustion temperature to optimize the crystal structure and morphology. A series of experiments were conducted at various ratios at 450 °C with 30 min duration. Similarly, additional experiments were carried out to determine the effect of time and temperature on crystallinity, crystal structure, and morphology characterized through different physicochemical techniques.

2.2. Material characterization

X-ray diffraction (XRD) patterns for all the powders was obtained using a Philips X-ray diffractometer with Ni filtered Cu-Kα radiation (λ = 1.5418 Å). FESEM images for all ZnO nanoparticles were carried out using NOVA NANOSEM FEI 450 system. The powder was mounted on a double-sided carbon tape attached to a SEM stub and sputter coated with gold for 2 min. Specific surface area of optimized powders was measured using nitrogen as the adsorbate in a BET apparatus (Quantachrome Autosorb, USA). Transmission electron microscopy (JEOL JEM-2100) was carried out to understand the morphology of ZnO nanoparticles. FT-IR spectrum was measured using spectrophotometer (Thermo Scientific iS10 Nicolet). UV-DRS measurement was done through Shimadzu spectrophotometer (UV-2450) to evaluate the band gap energy of ZnO nanoparticles in the wavelength region 200–800 nm using barium sulphate as reference.

2.3. Photocatalytic experiments

The photocatalysis experiments were carried under both UV and visible light for the degradation of an azo-dye namely methyl orange (MO, C14H14N3NaO3S). The catalyst concentration of 1 g L−1 was maintained in all the experiments. MO solution of 20 mg l−1 concentration was prepared as stock solution. 50 ml of MO dye solution was taken into pyrex reactor and 50 mg catalyst was suspended. The suspension was magnetically stirred for 90 min in dark for adsorption–desorption equilibrium between the photocatalyst and the dye. At certain time intervals, 1 ml of aliquots was sampled followed by centrifugation to separate the catalyst and the dye. The change in concentration was determined by recording the optical absorption spectra of the dye solution at 464 nm using UV-vis spectroscopy.

3. Results and discussions

3.1. Phase analysis of ZnO powders under influence of processing parameters

Powder X-ray diffraction pattern confirmed the crystal structure, crystallinity and phase content of ZnO powders as shown in Fig. 1. Primarily, experiments were designed to determine the crystal structure and phase purity with respect of varying oxidizer to fuel ratio under constant temperature of 450 °C and time of 30 min. All the XRD patterns can be indexed to pure wurtzite crystal phase of ZnO matching well with JCPDS# 79-0206 having space group P63mc with a = b = 3.2499 Å, c = 5.2066 Å and α = β = 90° and γ = 120°. Fuel deficient ratio (O/F = 4/1), stoichiometric ratio (O/F = 5/1) and fuel excess ratio (O/F = 6/1) shows no change in the crystal phase but a change in crystallinity is observed for the powders, as presented in Fig. 1a. High crystallinity has been observed for the powders obtained from combustion of stoichiometrically considered reactants. Thus, the stoichiometric ratio of oxidizer/fuel has been optimized for synthesis of ZnO powders. The growth of the particle relies on the time dependent isothermal conditions. Therefore, the optimization of formation of pure phase with respect to time at an interval of 10 min has been carried at temperature 450 °C with stoichiometric ratio of reactants (Fig. 1b). Initially, the reactant solution was retained after first 10 min of combustion reaction but after 20 min brown porous powder was observed. The XRD pattern of powder obtained after 20 min shows peak for wurtzite ZnO along with some impurity peak. The time duration of 30 min produced pure ZnO wurtzite phase with no impurity peaks. Further increasing the time shows no characteristic change in the phase and crystallinity. The impurity peak that was observed has been indexed as ‘*’ in the XRD pattern corresponding to the presence of oxidizer zinc nitrate hydrate (JCPDS# 19-1464). Similar observation was observed at temperatures below 450 °C having other parameters constant time at 30 min and O/F = 5/1 (Fig. 1c). There is a gradual formation of ZnO phase with decreasing oxidizer content from 300 °C to 350 °C to 400 °C, respectively. The impurity peak of zinc nitrate hydrate depicts the incomplete combustion of the oxidizer during the process. It indicates that the combustion reaction with time and temperature less than 30 min and 450 °C do not decompose the oxidizer completely. The final ZnO wurtzite phase is obtained at temperature 450 °C. The above result suggests that 30 min and 450 °C are the minimum requirements for producing pure phase ZnO powders under stoichiometric ratio. Thus, these parameters are taken as optimized reaction parameters. The following observation is further supported by the FT-IR spectra.
image file: c4ra09376c-f1.tif
Fig. 1 Composite XRD patterns: (a) effect of Oxidizer/Fuel ratio, (b) effect of time and (c) effect of temperature.

3.2. Functional group analysis of ZnO powders

The presence of functional groups for powders obtained at optimized condition (O/F = 5/1, 30 min, 450 °C), at low time/time deficient (O/F = 5/1, 20 min, 450 °C) and low temperature/temperature deficient (O/F = 5/1, 30 min, 400 °C) has been studied from FT-IR spectroscopy as shown in Fig. 2. All the powders had one common sharp absorption band at lower wavenumber of 536.86 cm−1 corresponding to the vibrations from Zn–O group. The broad absorption peak at about 3396.61 cm−1 corresponds to the stretching vibration of O–H mode from chemisorbed or physisorbed water molecules on the powders obtained from deficit of both time and temperature. The sharp absorption peaks observed at 1614.86 cm−1 & 1325 cm−1 can be attributed to the asymmetric and symmetric stretching from carboxyl group (C[double bond, length as m-dash]O). The corresponding vibration peak at 818.83 cm−1 was assigned to presence of NO3−1 ions. The presence of NO3−1, C[double bond, length as m-dash]O and O–H group confirms the incomplete decomposition of nitrate and carbonaceous matter from organic acid after the combustion reaction. Pure ZnO has no other functional groups present other than Zn–O. This supports the formation of pure ZnO without any impurity content at stoichiometric ratio.19
image file: c4ra09376c-f2.tif
Fig. 2 Composite FTIR-Spectrum of ZnO nanopowders under different conditions.

3.3. Morphological analysis of ZnO powders

The morphology optimization of ZnO has been studied by FESEM and TEM. XRD analysis suggests the stoichiometric ratio to be the optimum condition for the development of an adequate and high crystalline crystal structure of ZnO. The FESEM images obtained for powders under the series of varying reaction parameters of oxidizer/fuel ratio, time, and temperature has been presented in Fig. 3–5. Fig. 3 represents the images of the powders obtained under fuel deficient (Fig. 3a), stoichiometric (Fig. 3b) and fuel rich ratio (Fig. 3c). Unlike any change in the XRD pattern, no major change in the morphology was observed. Combustion reaction produces distinct rod-shaped particles with high dispersibility observed for stoichiometrically obtained ZnO powders. However, change in fuel ratio shows some influence on the specific surface area. The surface areas obtained for the fuel deficient, stoichiometric content and fuel rich conditions are 20.19, 17.8 and 16.9 m2 g−1, respectively. The highest and lowest surface area value corresponds to small particles for fuel deficient and large agglomerated particles for fuel rich content. The average particle size of stoichiometrically synthesized ZnO quasi-fiber is ∼2.8 μm in length and ∼0.5 μm in width.
image file: c4ra09376c-f3.tif
Fig. 3 FESEM images with respect to Oxidizer/Fuel ratio (a) O/F = 4/1, (b) O/F = 5/1 and (c) O/F = 6/1 at temperature 450 °C for 30 min.

Apart from the O/F ratio, growth of particles during combustion process also depends on parameters such as time and temperature. Therefore, particle images corresponding to variation in time has been shown in Fig. 4. Interestingly, during the first 10 min of reaction, there was only boiling of the solution to form gel. Although rod shaped particles with small spherical and plate shaped particles are observed after 20 min (Fig. 4a), but impurities were observed in XRD due to incomplete combustion of zinc nitrate. After 30 min of combustion, particles were observed to have soft agglomeration with less uniformity (Fig. 4b–d). The surface area of particles formed after 30 min with increment of 10 min decreases following the sequence: 15.8 < 11.4 < 9.3 m2 g−1, respectively. In accordance to the above result, uniform sized rod particles are formed in minimum time duration of 30 min. Similarly, temperature less than 450 °C showed impurity peaks of zinc nitrate but traces of rod shaped ZnO particle was also observed that increases upon the temperature sequence of 300 to 350 to 400 °C (Fig. 5a–c). High temperature led to form large agglomerated particles with increased particle size (Fig. 5d). The surface area of ZnO particles at 500 °C drastically decreases to 10.2 m2 g−1. Thus, dispersed uniform ZnO quasi fiber particles are formed at 450 °C for 30 min with stoichiometric ratio.


image file: c4ra09376c-f4.tif
Fig. 4 FESEM images with respect to time (a) 20 min, (b) 40 min, (c) 50 min and (d) 60 min at temperature 450 °C with O/F = 5/1.

image file: c4ra09376c-f5.tif
Fig. 5 FESEM images with respect to temperature (a) 300 °C, (b) 350 °C, (c) 400 °C, and (d) 500 °C for 30 min with O/F = 5/1.

TEM image (Fig. 6) shows a clear picture of apparent 1-D rod shaped particles that are composed of many small spherical particles forming a quasi-fiber like structure. Low magnification image (Fig. 6a) shows fiber like particles having average particle size of length ∼3 μm and width ∼0.5 μm, respectively. High magnification image (Fig. 6b & c) shows that individual spherical particles are co-joined to each other during combustion process and aligns to form 1-D structure. The rapid dissolution – recrystallization favors the formation of neck within two particles and thereafter results in the formation of continuous fiber like structure.20 The spherical particles forming quasi-fiber are found to have average particle size of ∼60 nm. The uneven diameter and pore distribution is observed along the longitudinal direction of quasi-fiber ZnO particles. The quasi-fibers are porous in nature as observed from the image. The SAED pattern (Fig. 6d) shows distinct concentric circles from agglomerated spherical particles depicting high crystallinity of the particles. Similar mechanism has also been illustrated by Sutka et al., whereby formation of 1-D nanostructure is seen through 3D and 2D structures.21


image file: c4ra09376c-f6.tif
Fig. 6 TEM images under (a) low magnification, (b) & (c) high magnification and (d) SAED pattern of optimized ZnO nanopowders.

3.4. UV-DRS and band gap calculation

The diffuse reflectance spectrum of ZnO has been presented in Fig. 7 with Tauc plot as the inset representing the energy band gap of quasi fibrous ZnO. The diffuse reflectance data is converted to Kubelka–Munk Unit of absorption (KMU) using the following equation: F(R) = (1 − R)2/2R, where, R is the reflectance.22 Band gap energy was estimated using Tauc plot calculated by the multiplication of the square root of Kubelka–Munk function (F(R)) and photon energy (), which is plotted against photon energy. The extrapolated linear slope to photon energy gives the band gap energy as shown in inset figure. The band gap energy of ZnO quasi fiber was found to be 2.95 eV, which is consistent with the values reported in the literature.23,24
image file: c4ra09376c-f7.tif
Fig. 7 UV-vis absorbance spectra of ZnO.

3.5. Photocatalytic measurements

In our study, one step synthesis of ZnO with high yield was achieved through a simple, easy and cost-effective method. Textile industry uses several organic dyes that get released in the water bodies without any prior treatment.25 Methyl orange (MO) (C14H14N3NaO3S, sodium 4-[(4-dimethylamino) phenyldiazenyl] benzenesulfonate) is a typical organic pollutant released from textile industry that has a negative effect on the environment. Therefore, in the present study, combustion synthesized quasi-fibrous ZnO was used for the evaluation of photocatalytic activity against MO dye.

Fig. 8a shows the degradation profile as C/Co of MO under dark, UV and visible light conditions, where C is the concentration of MO remaining in the solution after irradiation time t and Co is the initial concentration. Adsorption–desorption equilibrium was achieved by the stirring of the solution in dark for over 90 min. There was no adsorption observed for MO with catalyst for this time period. The degradation percentages of MO under UV and visible light after irradiation of 90 min are 84% and 80%, respectively. Literature reports zinc oxide to be a UV activated photocatalyst because of larger band gap energy (∼3.2 eV) with photocatalysis taking place at wavelengths shorter than 400 nm. However, it is observed that the degradation difference between UV and visible light is only 4% for the degradation of MO. This suggests that quasi-fibrous ZnO photocatalyst is more active under UV compared to visible light though the intensity of radiation is different in both cases. Moreover, high crystallinity and BET surface area of particles also play a favorable role to enhance the activity of the photocatalyst.26


image file: c4ra09376c-f8.tif
Fig. 8 (a) Photocatalytic degradation profile and (b) kinetic profile of methyl orange.

The kinetics of photocatalytic degradation can be described by pseudo first order kinetic rate equation, ln (C/Co) = −kt, where k is the pseudo first order kinetic rate constant and t is the irradiation time. The plot of ln (C/Co) as a function of irradiation time is shown in Fig. 8b with correlation coefficient greater than 0.98 supporting the first order rate of reaction. The apparent rate constant for MO degradation under irradiation of UV and visible light is 0.0205 min−1 and 0.0183 min−1, respectively. Ma et al. reported similar phenomenon for degradation of methylene blue under UV and visible light using ZnO/Ag2O heterostructures.27 Recent literature have also depicted similar phenomena where comparatively strong visible activity of ZnO nanocrystals is observed due to anisotropic structures having random pore distribution.28,29 Although ZnO shows poor activity under visible light irradiation, the misorientation of lattice planes along the quasi-fiber with random distribution of pore enhances the strain and absorption under visible region. Additionally, the porous nature of the quasi-fiber exposes more sites for photochemical reaction that acts as an added advantage during photocatalysis. Similar porous structures have been observed in an attempt to synthesize hollow structures of ZnO and Pt/ZnO porous nanocages for enhanced photocatalytic activity.30,31 Hence, such improved photocatalytic activity can be attributed to the more effective electron–hole separation and larger specific surface area of these specific porous structures. Such improvement of photocatalysis performance implies their potential application in purification of waste water.

3.6. Reusability and mechanism of photocatalyst

The reusability of photocatalyst is essential to investigate the stability of photocatalytic performance under both UV and visible region. The synthesized quasi-fibrous ZnO has been used to degrade MO dye for five consecutive cycles, and the results are shown in Fig. 9a and b, respectively. Effective photostability was observed for ZnO photocatalyst under visible light irradiation with only a 3.5% decrease in photocatalytic efficiency after five cycles. ZnO after UV irradiation for each cycle shows instability with continuous decrement up to 6% in photocatalytic efficiency at the end of five cycles. This continuous decrease in photocatalytic activity can be attributed to the photocorrosion effect under UV radiation.32 Photocorrosion of ZnO indicates that in addition to the chemical dissolution process during recycling, photo-assisted dissolution also occurs where both OH and hole concentrations at the surface actively take part in the photo-chemical reaction.33 Thus, a high specific surface area nanoparticle probably favors to adsorb oxygen molecules on the catalyst surface to produce more hydroxyl radicals for faster transport of photogenerated carriers enhancing the photocatalytic activity.34 These hydroxyl radicals directly trap the organic pollutant for further oxidation. Moreover, the adsorbed oxygen molecules at surface also react with photogenerated electrons to produce superoxide (˙O2), hydroperoxy (˙OH2) and hydroxyl (˙OH) radicals that act as strong oxidizing agents for decomposition of organic dye a shown in Fig. 10. The excitation of electron to conduction band generates photo-holes that produce hydroxyl radical by trapping the surface hydroxyl group, that also take part in oxidation of dye. However, recombination of electron–hole pair is very difficult to avoid during a photochemical reaction. In our work, ZnO acts as a suitable photocatalyst with good photodegradation efficiency and recycling performance.
image file: c4ra09376c-f9.tif
Fig. 9 Reuse of the photocatalyst under (a) UV light and (b) Visible light.

image file: c4ra09376c-f10.tif
Fig. 10 Schematic mechanism of ZnO as photocatalyst.

4. Conclusions

In summary, we have demonstrated the successful synthesis of quasi-fibrous zinc oxide through a solution-combustion method. This synthesis method is an easy, simple, cost-effective technique that results in a high yield of ZnO photocatalyst. The synthesized quasi-fibrous zinc oxide showed high photocatalytic activity for the degradation of the dye (methyl orange) under both UV and visible light irradiation. While some photocorrosion of quasi-fiber ZnO was observed under UV light, reasonable reuse performance was observed under visible light.

References

  1. C. A. K. Gouvea, F. Wypych, S. G. Moraes, N. Duran and P. Peralta-Zamora, Chemosphere, 2000, 40, 427–432 CrossRef CAS.
  2. H. Cao, J. Y. Xu, D. Z. Zhang, S. H. Chang, S. T. Ho, E. W. Seeling, X. Liu and R. P. H. Chang, Phys. Rev. Lett., 2000, 84, 5584–5587 CrossRef CAS.
  3. E. Ohshima, H. Ogino, I. Niikura, K. Maeda, M. Sato, M. Ito and T. Fukuda, J. Cryst. Growth, 2004, 260, 166–170 CrossRef CAS PubMed.
  4. S. Park, D. W. Lee, J. C. Lee and J. H. Lee, J. Am. Ceram. Soc., 2003, 86, 1508–1512 CrossRef CAS PubMed.
  5. A. Fujishima and K. Honda, Nature, 1972, 238, 37–38 CrossRef CAS.
  6. R. Ullah and J. Dutta, J. Hazard. Mater., 2008, 156, 194–200 CrossRef CAS PubMed.
  7. M. A. Mahmood, S. Baruah and J. Dutta, Mater. Chem. Phys., 2011, 130, 531–535 CrossRef CAS PubMed.
  8. Y. Li, G. W. Meng, L. D. Zhang and F. Phillip, Appl. Phys. Lett., 2000, 76, 2011–2013 CrossRef CAS PubMed.
  9. R. Slama, F. Ghribi, A. Houas, C. Barthou and L. E. Mir, Thin Solid Films, 2011, 519, 5792–5795 CrossRef CAS PubMed.
  10. C. Yu, K. Yang, Y. Xie, Q. Fan, J. C. Yu, Q. Shu and C. Wang, Nanoscale, 2013, 5, 2142–2151 RSC.
  11. R. Nagaraja, N. Kottam, C. R. Girija and B. M. Nagabhushana, Powder Technol., 2012, 215, 91–97 CrossRef PubMed.
  12. A. J. Reddy, M. K. Kokila, H. Nagabhushana, J. L. Rao, C. Shivakumara, B. M. Nagabhushana and R. P. S. Chakradhar, Spectrochim. Acta, Part A, 2011, 1, 53–58 CrossRef PubMed.
  13. C. C. Hwang and T. Y. Wu, Mater. Sci. Eng., B, 2004, 111, 197–206 CrossRef PubMed.
  14. R. Lanos, I. Lazau, C. Pacurariu and P. Sfirloaga, Mater. Chem. Phys., 2011, 129, 881–886 CrossRef PubMed.
  15. C. S. Lin, C. C. Hwang, W. H. Lee and W. Y. Tong, Mater. Sci. Eng., B, 2007, 140, 31–37 CrossRef CAS PubMed.
  16. P. R. Potti and V. C. Srivastava, Ind. Eng. Chem. Res., 2012, 51, 7948–7956 CrossRef CAS.
  17. A. Mclaren, T. V. Solis, G. Li and S. C. Tsang, J. Am. Chem. Soc., 2009, 131, 12540–12541 CrossRef CAS PubMed.
  18. K. C. Patil, M. S. Hegde, T. Rattan and S. T. Aruna, Chemistry of nanocrystalline oxide materials – Combustion synthesis, properties and applications, World Scientific publishing Ltd., 2008 Search PubMed.
  19. N. Rajamanickam, R. N. Mariammal, S. Rajashabala and K. Ramachandran, J. Alloys Compd., 2014, 614, 151–164 CrossRef CAS PubMed.
  20. P. Pinceloup, C. Courtois, J. Vicens, A. Leriche and B. Thierry, J. Eur. Ceram. Soc., 1999, 19, 973–977 CrossRef CAS.
  21. A. Sutka and G. Mezinskis, Front. Mater. Sci., 2012, 6, 128–141 CrossRef PubMed.
  22. I. Fatimah, S. Wang and D. Wulandari, Appl. Clay Sci., 2011, 53, 553–560 CrossRef CAS PubMed.
  23. L. Song, S. Zhang, X. Wu and Q. Wei, Ind. Eng. Chem. Res., 2012, 51, 4922–4926 CrossRef CAS.
  24. P. Cai, D. Zhen, X. Xu, Y. Liu, N. Chen, G. Wei and C. Sui, Mater. Sci. Eng., B, 2010, 17, 116–119 CrossRef PubMed.
  25. A. Leelavathi, G. Madras and N. Ravishankar, Phys. Chem. Chem. Phys., 2013, 15, 10795–10802 RSC.
  26. W. Zhou, F. F. Sun, K. Pan, G. H. Tian, B. J. Jiang, Z. Y. Ren, C. G. Tian and H. G. Fu, Adv. Funct. Mater., 2011, 21, 1922–1930 CrossRef CAS.
  27. S. Ma, J. Xue, Y. Zhou and Z. Zhang, J. Mater. Chem. A, 2014, 2, 7272–7280 CAS.
  28. S. Dhara and P. K. Giri, J. Nanosci. Nanotechnol., 2011, 11, 1–7 CrossRef PubMed.
  29. B. Cao, F. Sun and W. Cai, Electrochem. Solid-State Lett., 2005, 8, 237–240 CrossRef PubMed.
  30. H. Zeng, W. Cai, P. Liu, X. Xu, H. Zhou, C. Klingshim and H. Kalt, ACS Nano, 2008, 2, 1661–1670 CrossRef CAS PubMed.
  31. H. Zeng, P. Liu, W. Cai, S. Yang and X. Xu, J. Phys. Chem. C, 2008, 112, 19620–19624 CAS.
  32. H. Zhang, R. Zong and Y. Zhu, J. Phys. Chem. C, 2009, 113, 4605–4611 CAS.
  33. X. G. Zhang, Corrosion and Electrochemistry of Zinc, Springer, 1996 Search PubMed.
  34. S. Ma, R. Li, C. Lv, W. Xu and X. Gou, J. Hazard. Mater., 2011, 192, 730–740 CrossRef CAS PubMed.

This journal is © The Royal Society of Chemistry 2014