DOI:
10.1039/C4RA01263A
(Paper)
RSC Adv., 2014,
4, 16632-16640
Full factorial design applied to the synthesis of Pd–Ag nanobars by the polyol method and the perspective for ethanol oxidation
Received
12th February 2014
, Accepted 13th March 2014
First published on 18th March 2014
Abstract
Full factorial design methodology was applied to the synthesis and optimization of Pd–Ag nanobars using the polyol process as the reducer. The concentration of Br− ions, the temperature and the reaction time were selected as factors to study, whereas the yield (% nanobars) was the response to be analyzed. The nanoparticles were characterized by X-ray diffraction, energy-dispersive X-ray spectroscopy, transmission electron microscopy, high-resolution transmission electron microscopy and X-ray photoelectron spectroscopy. The nanoparticles were also tested for the ethanol electro-oxidation reaction by cyclic voltammetry in alkaline solution. The three factors had a positive effect on the response: the nanobar yield increased as the level of the variables changed from −1 to +1. The temperature and reaction time were the most determinant variables (main and interacting) on the nanobar yield, whereas the concentration of Br− influenced the yield to a lesser extent. After designing three optimum experiments, a maximum nanobar yield of 47.3% was obtained. The more negative electro-oxidation onset, higher current density and more negative current peak potential show that the incorporation of Ag into Pd nanobars improves the kinetic and thermodynamic behavior towards the ethanol electro-oxidation reaction compared with that obtained with nanometrically pure Pd nanobars. This improvement is the result of surface modification caused by the incorporation of Ag in the formation of Pd–Ag bimetallic nanobars with (200) surfaces.
1 Introduction
The synthesis of metallic nanobars has attracted great attention in recent years in electrocatalysis due to their enhanced specific catalytic activity in the electro-oxidation of methanol, formic acid and dimethyl ether. Metallic nanoparticles owe their catalytic activity to the preferential exposure of their crystalline faces.1
In the case of Pd, it has been reported that Pd nanobars in acidic and alkaline media offer superior electrocatalytic activity in the oxygen reduction reaction compared with spherically shaped and bulk Pd.2 The specific activity of Pd nanobars 48 nm in height was almost three times greater than 9 nm diameter Pd nanoparticles in H2SO4–methanol electrolyte, showing the nanobars' high tolerance to the poisoning effect of methanol.3 From theoretical density functional theory calculations and from experimental results, a similar enhanced behavior of Pd nanobars has been observed in the electrocatalytic activity of the ethanol reaction in alkaline medium. This enhanced performance was attributed to the prevalence of Pd (100) faces.4
Pd-based alloys have been selected as catalysts in many important physical processes and chemical and electrochemical reactions, including: the separation of hydrogen from gaseous mixtures without further purification using membrane technologies,5 the oxygen reduction reaction6 and the direct oxidation of alcohols such as methanol, ethanol, formic acid and ethylene glycol.7 Among the Pd-based alloys, Pd–Ag nanoparticles have received increasing attention due to their higher catalytic and electrocatalytic properties compared with those of monometallic Pd nanoparticles.8 Moreover, the synergetic interaction between Pd and Ag atoms not only produces materials that exhibit excellent catalytic activity, but also enhances the tolerance of adsorbed CO and improves the stability for ethanol electro-oxidation compared with Pd–C catalysts.9 Considering this background, interesting electrocatalytic properties could be expected from the morphological manipulation of Pd–Ag alloy nanoparticles compared with typical spherical Pd–Ag nanoparticles or monometallic Pd nanoparticles. To our knowledge, the synthesis of 10 nm Pd–Ag nanobars has not previously been reported; the objective of the work reported here was to analyze their synthesis using the polyol method.
Of the existing chemical methods, the polyol process is the technology most commonly used for the synthesis of Pd nanobars due to its relative simplicity and potential to be easily scaled up.4b,10 Previous papers have reported that the formation of Pd nanobars using the polyol synthesis method can be influenced by temperature, the concentration of Br− ions and the reaction time.4b,10 The novelty of the work reported in this paper is based on the fact that this method has not been extended to prepare bimetallic or multi-metallic nanobars.
Factorial design is an experiment design methodology that enables: (a) among the variables studied, the determination of the main factor that affects the response by analyzing the effects plots; (b) the study of the parallel effects of two or more factors on the responses studied; and (c) faster optimization of the response by manipulating the main factor that affected the response.11 This information can be obtained with a relatively small number of runs per factor, thus making the experimentation process quicker and cheaper than the traditional approach of a “one factor at a time” method, in which experimental factors are varied one at a time while the remaining factors are held constant. For these reasons, this methodology has recently been successfully applied to the synthesis of nanoparticles, including lanthanum oxide and Ag nanoparticles.11,12 In the present study, a full factorial design with two levels and three variables 23 was designed and applied to the synthesis and optimization of Pd–Ag nanobars by the polyol method. The concentration of Br− ions, the temperature and the reaction time were selected as the main factors to study, whereas the nanobar yield (% nanobars) was the response studied. The Pd–Ag bimetallic nanoparticles were characterized by transmission electron microscopy (TEM), X-ray diffraction (XRD), high-resolution TEM (HRTEM) and X-ray photoelectron spectroscopy (XPS) and were tested for the ethanol electro-oxidation reaction by cyclic voltammetry in alkaline solution.
2 Experimental
2.1 Experiment design
An experimental design with two levels and three variables (23) full factorial planning was performed to synthesize Pd–Ag nanobars by the polyol process. The selection of experimental factors is a crucial step in factorial experimental designs and careful selection of the key factors determines the success of the factorial design. In this work, we selected three factors to be analyzed (Table 1). The selection was performed based on our previous experience producing pure Pd nanobars and on reported polyol methodologies.4b,10a In the 23 full factorial design, it is postulated that the final properties obtained by experiments can be expressed as a linear function of experimental factors. Therefore the experiments were designed at only two levels for each factor. As this paper reports the first study of factorial design applied to the synthesis of Pd–Ag nanobars, the curvature was not verified by performing experiments at the center point. The experimental domain of each factor (X) is expressed with the maximum and minimum values taken during the experiment. A coded notation of −1 for the lowest level and +1 for the highest level (− and + to simplify) was then assigned.
Table 1 Chosen factors and experimental domain
| Factors |
Experimental domain |
| Level (−) |
Level (+) |
| X1 = Temperature (K) |
373 |
400 |
| X2 = Time (h) |
1 |
3 |
| X3 = Br− concentration (g) |
0.6 |
1.2 |
The experimental design and polynomial models were fitted using MiniTab 16 Statistical Software. The mathematical model of eqn (1) was applied to describe the principal factors and interactions among the variables studied:13
| | |
Y (%) = β0 + β1X1 + β2X2 + β3X3 + β12X1X2 + β13X1X3 + β23X1X2 + ε
| (1) |
Coded (−1, +1) levels were used for each independent variable X1, X2 and X3, in which the −1 level corresponds to the lower value of each variable and +1 to the higher value. The choice of these values was based on acceptable domains for each variable considering previous reports of nanobar synthesis. After analyzing the effect plots, three experiments were designed and performed around these domains to optimize the response.
2.2 Synthesis example
The Pd–Ag nanobars were synthesized using a modified method for obtaining pure Pd nanobars.4b,10a In the case of Exp. 1 (Table 2), 5 cm3 of ethylene glycol (EG, J. T. Baker, Austin, TX, USA, 99.9%) were placed in a 25 cm3 three-necked flask equipped with a reflux condenser and a PTFE-coated magnetic stirring bar. The flask was heated in an oil-bath and stirred under static air at a constant temperature of 373 K. Meanwhile, 0.024 g of Na2PdCl4 (Sigma-Aldrich, St. Louis, MO, USA, 98%) and 0.6 g of KBr (J. T. Baker, 99%) were dissolved in 3 cm3 of deionized water; 0.0916 g of polyvinylpyrrolidone (Aldrich, Mw 55![[thin space (1/6-em)]](https://www.rsc.org/images/entities/char_2009.gif) 000) and 0.019 g of AgNO3 (J. T. Baker, 99%) were dissolved in 3 cm3 of EG at room temperature (298 K). The two solutions were then injected simultaneously into the three-necked flask using two syringe pumps (Cole Palmer Instruments Company, Vernon Hills, IL, USA) at a rate of 45 cm3 h−1. The reactive mixture was heated at 373 K. After 1 h, the reaction was cooled down to room temperature and the product was separated by adding 30 cm3 of ketone and centrifuged at 4000 rpm for 20 min. The Ag–Pd nanoparticles were re-dispersed in deionized water and separated by ultracentrifugation at 35000 rpm for 2 h. The last process was repeated several times to remove the remaining impurities. Finally, the product was dried at 333 K for 12 h.
000) and 0.019 g of AgNO3 (J. T. Baker, 99%) were dissolved in 3 cm3 of EG at room temperature (298 K). The two solutions were then injected simultaneously into the three-necked flask using two syringe pumps (Cole Palmer Instruments Company, Vernon Hills, IL, USA) at a rate of 45 cm3 h−1. The reactive mixture was heated at 373 K. After 1 h, the reaction was cooled down to room temperature and the product was separated by adding 30 cm3 of ketone and centrifuged at 4000 rpm for 20 min. The Ag–Pd nanoparticles were re-dispersed in deionized water and separated by ultracentrifugation at 35000 rpm for 2 h. The last process was repeated several times to remove the remaining impurities. Finally, the product was dried at 333 K for 12 h.
Table 2 Matrix of experiments for a 23 completed factorial design, experimentation plan and measured responses
| Exp. no. |
Matrix of experiments |
Experimentation plan |
Response |
| X1 |
X2 |
X3 |
T (K) |
Time (h) |
KBr (g) |
(%) |
| 1 |
− |
− |
− |
373 |
1 |
0.6 |
1.3 |
| 2 |
+ |
− |
− |
400 |
1 |
0.6 |
8.9 |
| 3 |
− |
+ |
− |
373 |
3 |
0.6 |
3.1 |
| 4 |
+ |
+ |
− |
400 |
3 |
0.6 |
23.7 |
| 5 |
− |
− |
+ |
373 |
1 |
1.2 |
0 |
| 6 |
+ |
− |
+ |
400 |
1 |
1.2 |
2.5 |
| 7 |
− |
+ |
+ |
373 |
3 |
1.2 |
3 |
| 8 |
+ |
+ |
+ |
400 |
3 |
1.2 |
43 |
2.3 Materials characterization
The crystalline nature of the Pd–Ag nanoparticles was investigated using a Bruker D8 Advance X-ray diffractometer operated using Cu-Kα radiation at 40 kV and 40 mA over a 2θ range of 30–90° with a step size of 0.05° and a step time of 1 s. The diffraction patterns were compared with the Joint Committee on Powder Diffraction Standards; crystalline size composition was calculated from XRD patterns using the Rietveld analysis and TOPAS software. A JEOL JEM-100S and JEOL JEM-1010, operating at 60 kV and 100 kV respectively, were utilized for TEM and energy-dispersive X-ray spectroscopy (EDX) analyses. The specimens were prepared by ultrasonic dispersion in isopropyl alcohol, depositing a drop of suspension on a carbon-coated grid before the TEM session. HRTEM analyses were conducted on a Titan 80-300 FEI apparatus operated at 300 kV to observe the detailed morphology, and fast Fourier transform analysis was used to obtain the electron diffraction pattern. The XPS characterizations were carried out with a Versaprobe PHI 5000 system using Al monochromatic X-rays at 25 W and 15 kV. The survey and detailed spectra were obtained at 1–1000 and 331–345 eV, with step sizes of 0.5 and 0.05 eV and pass energies of 117.4 and 23.5 eV, respectively. The C 1s peak was used as the standard for shifting corrections.
2.4 Electrochemical experiments
All electrochemical measurements were conducted in a three-electrode cell at room temperature connected to an Autolab PSSTAT 302 potentiostat–galvanostat. An Hg–HgO electrode in 1 M KOH and a platinum foil electrode were used as the reference electrode and counter electrode respectively. The working electrode was prepared using a glassy carbon disc measuring 3 mm in diameter, which was previously polished with alumina powder (0.05 μm), sonicated for 10 min and washed with deionized water. During the electrochemical measurements, a mixture containing 1.0 mg of electrocatalyst and 73 μl of isopropyl alcohol (Baker, 99.9%) was pretreated for 20 min under ultrasonication. Then 7 μl of Nafion solution (5% isopropyl alcohol, Electrochem) was added to the mixture and sonicated for another 20 min to obtain a well-dispersed ink. A 2.2 μl portion of the catalyst ink was then transferred onto the surface of the glassy carbon electrode and dried in air to obtain a thin film catalyst. Cyclic voltammetry was performed in aqueous solutions of 1 M KOH in both the absence and presence of ethanol solutions of various concentrations from −1 to 0.4 V versus the normal hydrogen electrode (NHE) at 0.05 V s−1. Electrochemical cycling in 1 M KOH solution (without ethanol) was performed as an additional cleaning treatment of the material. The reported electro-oxidation cycle was the tenth cycle, when the electrochemical signal had been stabilized.
3 Results and discussion
3.1 Morphology and size
Fig. 1 shows the TEM images for the Pd–Ag nanoparticles resulting from each run. Fig. 1 (Exp. 1) corresponds to the product obtained using the same conditions as other works to synthesize pure Pd nanobars.4b,10a However, the small nanobar yield was evident as the image shows a mixture of irregular Pd–Ag nanoparticles about 5–20 nm in diameter. This result suggested that large changes in the methodology had to be made to improve nanobar formation. As shown in Fig. 1 (Exp. 2), most of the nanoparticles consisted of irregular forms with an average size of about 7 nm. However, a few Pd–Ag nanobars with an average particle size of approximately 5–7 nm (width) × 7–9 nm (length) could be observed. EDX counts indicated that the larger nanoparticles (Exp. 2) were composed of 88% Ag and 12% Pd, whereas the smaller nanoparticles contained 92% Pd and 8% Ag (spectrum not shown). The images for Exps 3, 5 and 7 show a mixture of small nanoparticles and large agglomerates; among the small nanoparticles, irregular and rectangular nanoparticles (the amount and size of the nanoparticles are detailed and discussed in further sections) can be observed. The number of Pd–Ag nanobars was notably higher in Exps 4 and 8 (Fig. 1). Moreover, the composition of the small nanoparticles was found to be 88.5% Pd and 11.5% Ag. This result shows for the first time the formation of bimetallic Pd–Ag nanobars smaller than 10 nm by the polyol method.
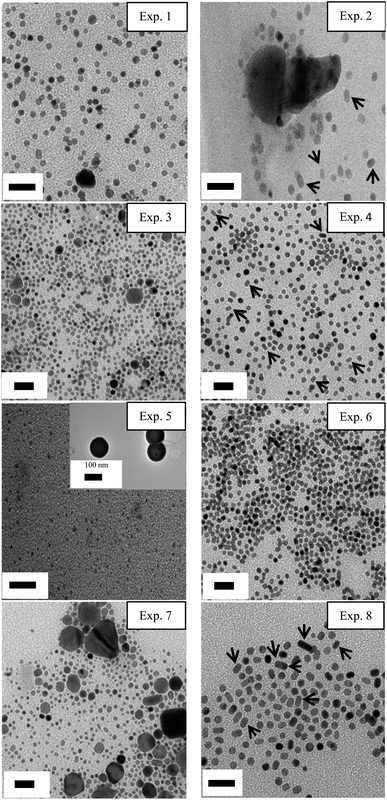 |
| | Fig. 1 Transmission electron microscopy images of all the experiments resulting from combining factors and levels. The exact value of the experimental conditions is shown in Table 2. The amounts of polyvinylpyrrolidone, H2O and ethylene glycol were maintained constant in all the experiments. The arrows indicate nanobars in the images. Scale bar = 20 nm. | |
3.2 Model fitting
Table 2 shows all the runs (23) or experiments resulting from the factor level combination according to the full factorial experiments design methodology.13 The factor levels are expressed in the matrix of experiments with coded units such as − and +, and the numerical values of these codes are detailed in the experimentation plan. The sequence of runs was performed randomly to eliminate any influence of systematic errors, which are difficult to stabilize and control. The response (% nanobars) is shown in the last column (Table 2).
The effects of the independent variables on the size of Pd–Ag nanobars were investigated using the lineal model, which was estimated based on the experimental results with the respective coefficients as given in eqn (2):
| | |
Y (%) = 10.65 + 8.79X1 + 7.46X2 + 1.46X3 + 6.27X1X2 + 1.82X1X3 + 3.40X2X3
| (2) |
where Y (%) is the Pd–Ag nanobar yield calculated by counting the amount of Pd–Ag nanobars found in the TEM images (considering at least 100 nanoparticles). The analysis of variance based on the ANOVA test for this regression model is given in Table 3. The model equation for the Pd–Ag nanobar preparation falls within the limit of a well-described model within the range of the independent variables. The F value of 3.29 indicates that the model is not significant for Pd–Ag nanobar synthesis because a value greater than 4 is considered desirable.14 The p value of the model is considered to be significant when p < 0.05, whereas values greater than this are considered not significant. The results of the model indicated that it is non-significant as the p values are slightly greater than 0.05 (Table 3). The correlation coefficients of R2 and Radj2 for this model were 0.95 and 0.6627, respectively, indicating a good fit between the regression model [eqn (2)] and the experimental values (Table 2).
Table 3 ANOVA parameters obtained for fitting eqn (2)a
| Source |
C |
DOF |
SS |
SS adjust |
MS |
F value |
T value |
p value |
| *S = 8.76459; R2 = 95.18%; significance value = 5%. C = coefficient; DOF = degrees of freedom, SS = sum of squares; MS = mean square. |
| C |
10.65 |
|
|
|
|
|
3.44 |
0.18 |
| X1 |
8.79 |
1 |
619.34 |
619.34 |
619.34 |
8.06 |
2.83 |
0.216 |
| X2 |
7.46 |
1 |
445.96 |
445.96 |
445.95 |
5.80 |
2.40 |
0.25 |
| X3 |
1.46 |
1 |
17.2 |
17.2 |
17.19 |
0.22 |
0.47 |
0.72 |
| X1*X2 |
6.27 |
1 |
315.13 |
315.13 |
315.13 |
4.10 |
2.02 |
0.29 |
| X1*X3 |
1.82 |
1 |
26.68 |
26.68 |
26.68 |
0.34 |
0.58 |
0.66 |
| X2*X3 |
3.40 |
1 |
92.96 |
92.96 |
92.95 |
1.21 |
1.1 |
0.47 |
| Reg. |
|
6 |
1517.27 |
1517.27 |
252.87 |
3.29 |
|
0.39 |
| Error |
|
1 |
76.82 |
76.82 |
76.81 |
|
|
|
| Total |
|
7 |
1594.09 |
|
|
|
|
|
Even though the F and p values of the model are within the limit of acceptance, it should be noted that the formation of small Pd–Ag nanobars measuring less than 10 nm in length was observed for the first time using the polyol process. Moreover, the T values for the temperature, reaction time and temperature–reaction time interaction coefficients are greater than the KBr-containing parameters, thus showing the high significance of these factors on the Pd–Ag nanobar yield. These results suggest that the analysis of these factors and interactions can conduce to improved response, as shown in later sections of this paper.
3.3 Analysis of main factors and interactions
The plots of the main effects on the formation of the nanobars are shown in Fig. 3 to analyze the influence of each variable on the nanobar yield. These results show that the three factors have a positive effect on the response; the nanobar yield increases as the level changed from −1 to +1. This result is also evident in Table 3, where a positive coefficient indicates an increase in nanobar yield. In addition, in the considered range of parameters, the temperature and reaction time have high slopes resulting from their strongest effect on the nanobar yield, whereas the Br− concentration had less impact on nanobar formation.
3.3.1 Effect of Br− concentration. It has been demonstrated that Br− can chemisorb onto the surface of Pd seeds and alter the order of surface free energies for different facets so that the formation of the (100) surface can be strongly promoted to generate nanocubes and nanobars.15 In the present study, Br− also played an important role in promoting the (100) facets, resulting in the formation of square-shaped nanostructures. However, it is believed that the addition of Br− also contributed to the slow reduction because the overall stability constant of PdBr42− is nearly 104 times higher than that of PdCl42−; almost all Cl− in the PdCl42− ions can be substituted by Br− to form the complex ions PdBr42− when the Na2PdCl4 is mixed with KBr in water.10a According to thermodynamic calculations, the potential of the Pd precursor (Na2PdCl4) is greatly reduced due to the formation of the more stable PdBr42− complex, as can be inferred by comparing the electrode potential (versus the NHE) of eqn (3)–(5).16 We believe that this ligand replacement could significantly reduce the reduction rate in a similar way in Pd nanobar formation.10a However, unlike the synthesis of pure Pd nanobars, the Pd–Ag nanobar yield was not substantially changed by the change in the Br− ion concentration in the composition range studied here (Fig. 3).| | |
Pd2+ + 2e− → Pd, E° = 0.915 V vs. NHE
| (3) |
| | |
PdCl42− + 2e− → Pd + 4Cl−, E° = 0.59 V vs. NHE
| (4) |
| | |
PdBr42− + 2e− → Pd + 4Br−, E° = 0.49 V vs. NHE
| (5) |
3.3.2 Effect of temperature. It is believed from thermodynamics that Pd atoms nucleate and grow into cuboctahedrons (with a nearly spherical shape) enclosed by a mix of (111) and (100) facets to minimize the total surface energy. In general, an fcc metal can only be forced to grow into anisotropic nanostructures through kinetic control. For instance, when the rate of atomic addition is sufficiently fast, the preferential growth on this particular face leads to the formation of an elongated nanostructure with a square cross-section. More specifically, when the reduction is at a medium rate, the seeds take on a cubic shape with a slight truncation at the corners and the product contains mainly nanobars. As the reduction rate becomes much faster, more seeds are formed in the nucleation step. These cubic seeds are smaller, but have more significant truncation at the corners, and the final product is dominated by nanorods thinner than the nanobars.10a,17 In the present case, the Pd and Ag reduction was slower at lower temperatures (Exps 1, 3, 5 and 7) than at higher temperatures as the product consisted mainly of irregular nanoparticles instead of Pd–Ag nanobars (Fig. 1 and 2). This slow reduction was evident during the experiments as the color change from reddish brown to black, which indicates that the reduction of the precursors was slower; this could have resulted from the addition of Ag+ ions to the reaction. The higher concentration of the more stable AgBr in the final product (see Fig. 4 and Table 4) suggested another source of kinetic hindering; this may result from the more negative reduction potential of Ag+ and AgBr compared with the PdBr42− ions formed during the reduction process to obtain pure Pd nanobars [eqn (6) and (7)]:10a,16a,16b| | |
Ag+ + e− → Ag, E° = 0.799 V
| (6) |
| | |
AgBr + e− → Ag + Br−, E° = 0.071 V
| (7) |
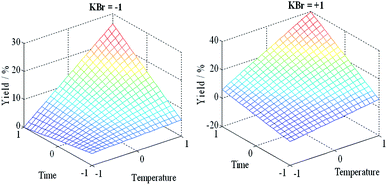 |
| | Fig. 2 Plots of the Pd–Ag nanobar yield calculated using the model obtained [eqn (2)]. | |
Table 4 Structural parameters and composition calculated by fitting the XRD patterns shown in Fig. 4 using the Rietveld method
| Exp. no. |
Pd crystal size (nm) |
Pd lattice parameter (Angstroms) |
AgBr (%) |
| 1 |
5.4 |
3.8976 |
25.9 |
| 2 |
5.8 |
3.8956 |
12.1 |
| 3 |
6.6 |
3.9012 |
24.6 |
| 4 |
5.6 |
3.8961 |
8.6 |
| 5 |
Clusters |
3.8760 |
100 |
| 6 |
5.4 |
3.8960 |
11 |
| 7 |
18.7 |
3.9094 |
54.12 |
| 8 |
5.8 |
3.8956 |
9.45 |
| Pd |
6.7 |
3.8847 |
0 |
This kinetic obstruction of the reduction rate by Ag species is supported by the strong suppression of the AgBr diffraction peaks observed at higher temperatures, where the reduction rate increased leading to both higher Pd–Ag nanobar yields and lower AgBr production (Table 4). In addition, the incorporation of some Ag atoms into the nanobar structure was evident by the lattice expansion observed when comparing the lattice parameter of the Pd–Ag material with the pure Pd material. This lattice expansion was more significant at high temperatures.
3.3.3 Effect of reaction time. In the case of pure Pd, it has been reported that Pd nanobars can be formed via growth from small, near-spherical seeds or through the evolution of nanorods in an aging process.10a In the present study, the reaction time was found to be as important as the reaction temperature (Table 3 and Fig. 3); the absence of nanorods in all the experiments points towards the Pd–Ag nanobars forming from the small nanoparticles during the nucleation step. The similar width of the Pd–Ag nanobars in all the experiments (5–7 nm; Fig. 1) also supports this argument because nanobars evolved from nanorods during the aging process should have a smaller diameter.10a Lowering the concentration of AgBr at shorter reaction times (Fig. 4 and Table 4) suggested that the Ag atom reduction took place through the more stable AgBr reduction pathway. On the other hand, the small yield obtained at the 1 h reaction suggested that this time was not enough to allow the Pd and Ag atoms to incorporate into the nanoparticle. This significant dissimilarity between the Pd and Pd–Ag nanobar formation time could be related to the differences in the reduction potential discussed in Sections 3.3.1 and 3.3.2.
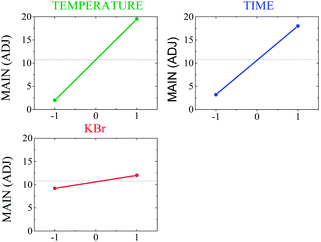 |
| | Fig. 3 Plot of the main effects for the full factorial design. | |
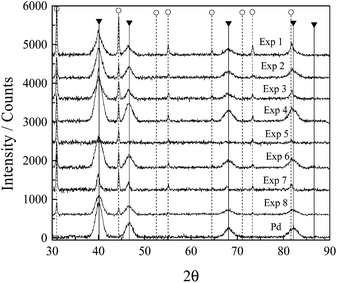 |
| | Fig. 4 XRD patterns of the eight experiments and pure Pd nanobars. (○) AgBr; (▼) Pd. | |
3.3.4 Interaction effects. Fig. 5 illustrates the effect of the interaction between the three factors on the Pd–Ag nanobar yield. Here it is possible to observe which interactions between factors are stronger for the nanobar formation yield. When the difference in the slope of the two lines in each cell is large, the interaction between the two factors of the cell is strong.11 The nanobar yield remained almost unchanged at low reaction temperatures (−1), independent of the level observed by time and Br− concentration. In contrast, at high temperatures, the temperature–reaction time showed the strongest interaction effect as the slope is markedly steeper than for the temperature–Br− concentration interaction.
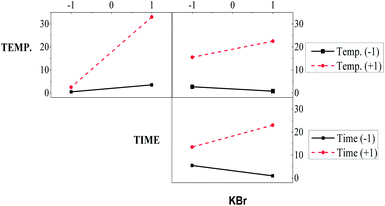 |
| | Fig. 5 Interaction effects plot (y axes are the main adjusted values for Pd–Ag nanobar yield). | |
If we look at the high levels (reaction time and temperature) in the KBr column of Fig. 5, we observe that the nanobar yield increased as the Br− concentration increased from low to high levels. In contrast, a decrease in nanobar yield was observed at low levels (temperature and reaction time) as the Br− concentration changed from low to high levels. The individual and interaction effects discussed earlier can also be observed in Table 3, where the F values for the temperature, reaction time and temperature–reaction time interaction are the highest, showing the significance of these factors on the Pd–Ag nanobar yield.
3.4 Optimization trials
According to the results from the previous sections, the temperature and reaction time must be controlled carefully due to their strong effect on the final product. Thus three experiments were planned and executed to improve the Pd–Ag nanobar yield. The analysis of the main factors and interactions suggested that increasing the value of these factors would increase the nanobar yield.
Fig. 6 shows the TEM images of the samples formed under experimental conditions around Exp. 8 (Table 2), which represented the highest yield from the full factorial design application. In the optimization trials, the Br− concentration remained unchanged at the high level. Fig. 6a is the result obtained by increasing the temperature by 13 K (to 413 K), while the reaction time remained at 3 h. In this case, the Pd–Ag nanobar yield increased to 47.3%. In contrast, increasing the reaction time to 4.5 h while keeping a reaction temperature of 400 K resulted in a decrease in the nanobar yield from 43 to 37.5% (Fig. 6b). Moreover, increasing both the temperature and reaction time (413 K, 4.5 h) resulted in a decrease in the nanobar yield to 35.8% (Fig. 6c). This decrease in nanobar yield in Fig. 6b and c could be due to the evolution from nanobars to irregular nanoparticles during growth, or the aging process, or both, as has been reported to occur for Pd nanobars.10a However, the 47.3% nanobar yield corresponds to the maximum value obtained under the experimental conditions analyzed, considering the impossibility of increasing the temperature reaction due to the boiling point of the ethylene glycol–water mixture (413 K). The highest yield of Pd–Ag nanobars is comparable with other syntheses of Pd nanostructures with controlled morphology by chemical methods.15,17
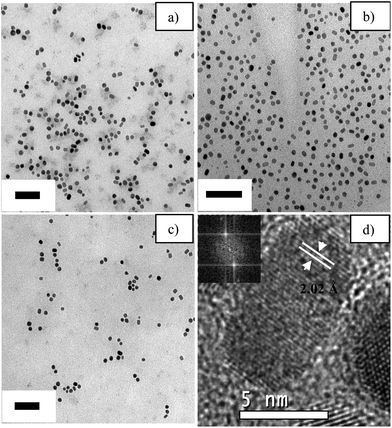 |
| | Fig. 6 Transmission electron microscopy (TEM) images for the experiments at: (a) 413 K, 3 h; (b) 400 K, 4.5 h; (c) 413 K, 4.5 h. (d) High-resolution TEM of a Pd–Ag nanobar from (a); the inset is a fast Fourier transform analysis calculated from a beam perpendicular to the surface. Scale bar = 50 nm. | |
Fig. 6d shows the HRTEM image of a Pd–Ag nanobar from Fig. 6a. It is worth noticing that the nanobar size was very similar in all the syntheses, as also seen in Table 4. It has been reported that when AgNO3 is added at a moderate rate (during a seed-mediated process) into the Pd nanobar suspension, the Ag grows preferably on three adjacent faces of a Pd seed, resulting in an eccentric heterostructure of Pd–Ag and the formation of an Ag plate, cube and then bar with slight truncations at the corners.18 This phenomenon could explain the truncation of the Pd–Ag nanobar observed in this study, considering that the one-pot co-reduction process is similar to seed-mediated growth in nature because one metal ion will be reduced first due to the difference in the reduction potentials of the two metal cations. The pre-formed metal will serve as in situ seeds for the successive reduction and growth of another metal.19 However, the surface of the Pd–Ag nanobar seems very homogeneous and the interplanar distance calculated (by fast Fourier transform analysis) is closer to the Ag(200) than the Pd(200) (2.045 and 1.945 angstroms, respectively), perhaps due to the preferential growth of Ag discussed earlier that resulted in an Ag layer thin enough to avoid being observed by XRD. Moreover, the HRTEM data indicated that the (200) faces observed in pure Pd nanobars are also observed in Pd–Ag nanobars. This result is interesting because the preferential orientation of the Pd–Ag nanobars could have catalytic effects on structure–sensitivity reactions, such as the EOR.
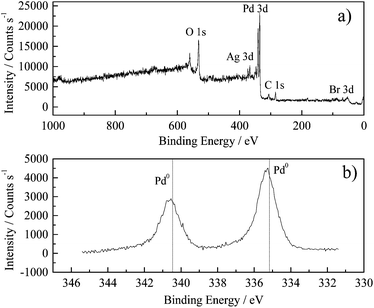
The surface composition for the nanoparticles shown in Fig. 6a was analysed by XPS. The survey scan (Fig. 7a) showed the presence of C and Br− residuals from the synthesis step. The atomic concentration at the surface was found to be 11.8, 28.3, 56.54, 1.94 and 1.4 for Pd, C, O, Br and Ag, respectively. The high oxygen content suggests the presence of a thin film of Ag and Pd oxides that commonly coexist at the surface of Pd nanoparticles exposed to the air,19 which could not be detected by XRD patterns. Furthermore, the Pd:Ag atomic ratio calculated was 8.42, which corresponds to 89.5 and 10.5% Pd and Ag respectively (without considering impurities). This result is consistent with the composition obtained by EDX (Section 3.1). Density functional theory studies have already shown that clean Pd(100) displays a surface core level shift to lower binding energies in Pd 3d photoemission spectra, whereas a shift to higher binding energies relative to the bulk contribution is observed for Pd75Ag25(100). This contribution is caused by Pd atoms embedded in the surface region of an Ag-terminated Pd75Ag25(100) surface.5a The results obtained in the present work agreed with density functional theory results, as a small shift towards higher binding energy was found in Pd 3d5/2 (335.2 eV) and Pd 3d3/2 (340.4 eV) compared with pure Pd materials (dotted lines in Fig. 7b).
 |
| | Fig. 7 X-ray photoelectron spectroscopy spectrum for the nanoparticles shown in Fig. 6a. | |
3.5 Application of Pd–Ag as a catalyst
The Pd–Ag nanobars observed in Fig. 6a and pure Pd nanobars obtained by a methodology reported previously4b were supported on Vulcan carbon to obtain a catalyst. These catalysts were tested for ethanol electro-oxidation in 1 M KOH solution by cyclic voltammetry (Fig. 8). The voltammograms were characterized by two well-defined current peaks: one in the anodic scan and the other in the cathodic scan. In the anodic scan, the oxidation peak was related to the oxidation of freshly chemisorbed species derived from ethanol adsorption. The oxidation peak in the reverse scan is associated with the removal of carbonaceous species that are not completely oxidized in the positive scan, rather than the oxidation of freshly chemisorbed species.20 For the Pd–Ag/C and Pd–C catalysts, the onset potentials of the EOR were −0.6 and −0.5 V, whereas the peak current densities were found at −0.13 and −0.12 V versus the NHE, respectively. Moreover, the peak current density for the bimetallic catalysts was 2.5 times higher than the pure Pd catalysts. As the Pd–Ag and Pd nanobar sizes (lengths) were comparable (6.7 and 8 nm, respectively) for the electrocatalysts, the difference in the EOR activity should be associated with the different structures and elemental compositions on the surface. The higher suppression of the hydrogen adsorption–desorption peaks (at E < −0.7 V versus the NHE) in the Ag-containing catalyst was further evidence of surface modification, as it has been associated with the Pd surface alteration due to the introduction of Ag.8c The more negative onset, higher and more negative current peak potential showed that the incorporation of Ag in Pd nanobars improves the kinetic and thermodynamic behavior towards the EOR compared with that obtained on nanometrically pure Pd nanobars. These pure Pd nanostructures have been identified as excellent electrocatalysts due to their preferential exposition of Pd(100) faces which favor the adsorption and oxidation process of ethanol.4b
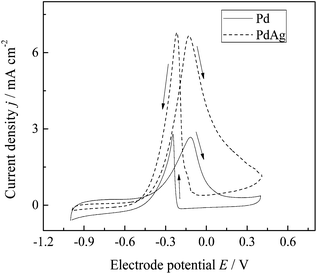 |
| | Fig. 8 Cyclic voltammograms obtained at 1 M ethanol for the nanoparticles shown in Fig. 6a and a squared Pd–C catalyst. Experimental conditions: 1 M KOH, 40 mV s−1, electrode diameter = 3 mm, room temperature. | |
4 Conclusions
Factorial design methodology was applied to the synthesis and optimization of Pd–Ag nanobars using the polyol process as the reducer. The concentration of Br− ions, temperature and the reaction time were selected as factors to study, whereas the yield (% nanobars) and particle size were the expected responses to be analyzed. The nanoparticles were characterized by XRD, TEM, HRTEM and XPS. The three factors have a positive effect on the response; the nanobar yield increased as the level changed from −1 to +1. The temperature and reaction time presented the strongest effect on nanobar yield, whereas the Br− concentration affected nanobar formation to a lesser extent. The temperature–reaction time had the strongest interaction effect on the Pd–Ag nanobar yield. The 47.3% nanobar yield corresponds to the maximum value obtained under the experimental conditions analyzed and showed, for the first time, the possibility of reducing Pd and Ag to generate Pd–Ag bimetallic nanobars smaller than 10 nm in width. These bimetallic nanobars showed better electrocatalytic performance as the onset potential was 0.1 V more negative and the current density was 2.5 higher than for pure Pd nanobars, which have been reported to present excellent performance towards the EOR due to their preferential exposition of Pd(100) faces. This result exemplified the important catalytic properties that these nanobars could have, especially in the catalytic field where small size is often preferred.
Acknowledgements
We acknowledge use of the WVU Shared Research Facilities for the XPS data. We also thank Pilar Herrasti (UAM) and Lourdes Palma (UNAM) for the TEM images. R. Carrera-Cerritos thanks CONACYT for financial support during his PhD studies, Grant no. 213850.
Notes and references
- E. Antolini and J. Perez, J. Mater. Sci., 2011, 46, 4435 CrossRef CAS.
-
(a) H. Erikson, A. Sarapuu, N. Alexeyeva, K. Tammeveski, J. Solla Gullon and J. M. Feliu, Electrochim. Acta, 2012, 59, 329 CrossRef CAS PubMed;
(b) H. Erikson, A. Sarapuu, N. Alexeyeva, K. Tammeveski, J. Solla Gullon and J. M. Feliu, Electrochem. Commun., 2011, 13, 734 CrossRef CAS PubMed.
- C. L. Lee and H. P. Chiou, Appl. Catal., B, 2012, 117–118, 204 CrossRef CAS PubMed.
-
(a) E. D. Wang, J. B. Xu and T. S. Zhao, J. Phys. Chem. C, 2010, 114, 10489 CrossRef CAS;
(b) R. Carrera Cerritos, M. Guerra-Balcázar, R. Fuentes Ramírez, J. Ledesma-García and L. G. Arriaga, Materials, 2012, 5, 1686 CrossRef.
-
(a) L. E. Walle, H. Grönbeck, V. R. Fernandes, S. Blomberg, M. H. Farstad, K. Schulte, J. Gustalfson, J. N. Anderson, E. Lundgren and A. Borg, Surf. Sci., 2012, 606(23–24), 1777 CrossRef CAS PubMed;
(b) I. H. Svenum, J. A. Herron, M. Mavrikakis and H. J. Venvik, Catal. Today, 2012, 10, 193 Search PubMed.
- J. B. Xu, T. S. Zhao, Y. S. Li and W. W. Yang, Int. J. Hydrogen Energy, 2010, 35, 9693 CrossRef CAS PubMed.
-
(a) V. Bambagioni, C. Bianchini, A. Marchionni, J. Filippi, F. Vizza, J. Teddy, P. Serp and M. Zhiani, J. Power Sources, 2009, 190, 241 CrossRef CAS PubMed;
(b) T. Maiyalagan and K. Scott, J. Power Sources, 2010, 195, 5246 CrossRef CAS PubMed;
(c) W. Li and P. Haldar, Electrochem. Commun., 2009, 11, 1195 CrossRef CAS PubMed;
(d) R. Wang, S. Liao and S. Ji, J. Power Sources, 2008, 180, 205 CrossRef CAS PubMed.
-
(a) Q. Wang, J. Zheng and H. Zhang, J. Electroanal. Chem., 2012, 674, 1 CrossRef CAS PubMed;
(b) A. Godínez-García, J. F. Pérez-Robles, H. V. Martínez-Tejada and O. Solorza-Feria, Mater. Chem. Phys., 2012, 134, 1013 CrossRef PubMed;
(c) G. Li, L. Jiang, Q. Jiang, S. Wang and G. Sun, Electrochim. Acta, 2011, 56, 7703 CrossRef CAS PubMed.
-
(a) S. T. Nguyen, H. M. Law, H. T. Nguyen, N. Kristian, S. Wang, S. H. Chan and X. Wang, Appl. Catal., B, 2009, 91, 507 CrossRef CAS PubMed;
(b) E. H. Yu, U. Krewer and K. Scott, Energies, 2010, 3, 1499 CrossRef CAS.
-
(a) Y. Xiong, H. Cai, B. J. Wiley, J. Wang, M. J. Kim and Y. Xia, J. Am. Chem. Soc., 2007, 129, 3665 CrossRef CAS PubMed;
(b) M. Jin, H. Liu, H. Zhang, Z. Xie, J. Liu and Y. Xia, Nano Res., 2011, 4(1), 83 CrossRef CAS PubMed.
- J. H. Lim and J. S. Lee, Colloids Surf., A, 2008, 322, 155 CrossRef CAS PubMed.
- S. J. Nejad, H. Abolghasemi, M. A. Moosavian, A. Golzary and M. G. Maragheh, J. Supercrit. Fluids, 2010, 52, 292 CrossRef PubMed.
- C. Vitorino, F. A. Carvalho, A. J. Almeida, J. J. Sousa and A. A. C. C. Pais, Colloids Surf., B, 2011, 84, 117 CrossRef CAS PubMed.
- M. M. Ba-Abbad, A. A. H. Kadhum, A. B. Mohmad, M. S. Takriff and K. Sopian, J. Ind. Eng. Chem., 2013, 19, 99 CrossRef CAS PubMed.
- W. U. Binghui, Z. Huihui and Z. Nanfeng, [OL], [2012-02-15 14:02:47], http://www.paper.edu.cn/index.php/default/en_releasepaper/downPaper/201202-431, (accessed October 2013).
-
(a) A. J. Bard, R. Parsons and J. Jordan, in Standard Potentials in Aqueous Solution (prepared under the auspices of the International Union of Pure and Applied Chemistry), Dekker, New York, 1985 Search PubMed;
(b) G. C. Zoski, in Handbook of Electrochemistry, Elsevier B.V., UK, 1st edn, 2007, p. 815 Search PubMed;
(c) Y. Xiong, J. M. McLellan, J. Chen, Y. Yin, Z. Y. Li and Y. Xia, J. Am. Chem. Soc., 2005, 127, 17118 CrossRef CAS PubMed.
- Y. Xiong, H. Cai, Y. Yin and Y. Xia, Chem. Phys. Lett., 2007, 440, 273 CrossRef CAS PubMed.
-
(a) X. Liu, D. Wang and Y. Li, Nano Today, 2012, 7, 448 CrossRef CAS PubMed;
(b) J. Zeng, C. Zhu, J. Tao, M. Jin, H. Zhang, Z. Y. Li, Y. Zhu and Y. Xia, Angew. Chem., Int. Ed., 2012, 51, 2354 CrossRef CAS PubMed.
- C. M. Ghimbeu, C. Zlotea, R. Gadiou, F. Cuevas, E. Leroy, M. Latroche and C. Vix-Guterl, J. Mater. Chem., 2011, 21, 17765 RSC.
- R. N. Singh, A. Singh and A. Anindita, Carbon, 2009, 47, 271 CrossRef CAS PubMed.
|
| This journal is © The Royal Society of Chemistry 2014 |


