 Open Access Article
Creative Commons Attribution 3.0 Unported Licence
Ability of co-administered peptide liposome nanoparticles to exploit tumour acidity for drug delivery
Shaun C.
Offerman
a,
Anita V.
Kamra Verma
b,
Brian A.
Telfer
a,
David. A.
Berk
a,
David J.
Clarke
a and
Harmesh S.
Aojula
*a
aManchester Pharmacy School, The University of Manchester, Manchester, M13 9PL, UK
bNanobiotech lab, Kirori Mal College, University of Delhi, Delhi 110007, India
First published on 20th December 2013
Abstract
Using a previously-characterised solid tumour model we demonstrate that a mixture of pH sensitive peptide and liposome nanoparticles (PLNs) can be used to induce payload release in response to small changes in tumour acidity. The classical pH sensitive GALA peptide was modified at two different positions to help tether with preformed liposomes and cause release of calcein marker in response to a less than 1.0 unit drop in pH from the physiological value. The circular dichroic spectra of the peptide showed that, unlike the GALA sequence, its helical structure was unusually independent of pH suggesting a different mechanism of action for calcein release. Intravenously-administered PLNs accumulated in tumour tissue in mice, and subjecting the excised tumour tissue slices to low pH buffer confirmed that these nanoparticles remained pH responsive. Quantitative in vivo imaging of tumours implanted in mouse dorsal skin allowed real time measurements of nanoparticle accumulation, monitored through DiI labelling of the liposome membrane, and intra-tumour pH dependent release, monitored by calcein release, to be followed. The release of calcein in the live tumours at their natural acidity of pH 6.8 was further enhanced with MIBG glucose treatment to induce tumour acidification to approximately pH 6.5. Following accumulation a substantially greater and more rapid calcein release was observed in tumours administered with PLNs and subjected to pH-lowering using MIBG treatment, compared to control tumours administered with liposomes lacking the peptide or tumours not treated with MIBG. This work highlights that while PLNs were relatively unresponsive to intrinsic tumour pH, they did have the ability to respond rapidly to extrinsically-induced small changes in pH near the patho-physiological range.
Introduction
Development of pH responsive nanoparticles for controlled drug delivery of chemotherapeutics is scientifically a fast growing area. Although cancer cells vary widely with respect to function and molecular markers, solid tumours are recognised to share certain physiological characteristics, including for example: chronic hypoxia, disorganised neo-vasculature, and a lower extracellular pH than most normal tissues.1–3 Various investigators have sought to exploit these characteristic features of tumour physiology, for example by designing prodrugs that are acid-labile or hydrolysed by specific enzymes.1,4 Studies across a range of animal tumour models, and using various measurement techniques, demonstrate that acidification of the tumour extracellular fluid is typical but small in magnitude, with the pH seldom below a value of 6.5 and usually higher. Hence, “physiological targeting” of tumours based on extracellular pH, while theoretically possible, presents a highly challenging design problem for drug delivery.Many polymer based nanoparticles are in development and have shown potential to be comprised into nanosized vehicles for targeting the slightly acidic extracellular microenvironment of solid tumours.5 Compared to polymer systems liposomes, being approved clinical products for more than a decade, have a greater appeal, if they can be suitably engineered to respond better in vivo. Use of modified lipids to prepare nanosized lipid vesicles is a well documented strategy for preparing liposomes sensitive to hyperthermia, pH and enzymes.6–8 Although these specifically-modified lipids respond to various stimuli their range of responses in vitro can be far removed from that elicited from the much smaller physiological variations found in vivo. Engineered pH-sensitive liposomes are usually based upon non-bilayer-forming lipids stabilised into bilayer structures at neutral pH by specific amphiphiles which protonate, in the pH range of 4.0–6.0, to destabilise the bilayer structure and release the payload.7 While this pH range is ideally suited for intracellular release from endosomes or lysosomes such highly acidic conditions are biologically insignificant elsewhere in tissues. Classical and stealth liposomal formulations of anticancer drugs, now in clinical use, both rely on passive targeting9 without direct binding to specific cells. In the absence of any receptor-targeting ligand the internalisation of these liposomes is limited. Thus to a great extent the liposome's degradation, and hence drug release, is thought10,11 to occur in the tumour interstitium by a slow process of non-specific degradation.5,12 Preceding this process the released drug may be internalised into a cell to elicit a pharmacological response. Highly-stable liposomes, including those used clinically, have a drawback in that drugs may remain entrapped within the liposomes for prolonged periods thereby reducing bioavailability.9,13,14 Stability of pH-sensitive liposomes in the circulation and the ability to release the drug at the tumour site are the two opposing features for which a delicate balance is difficult to conceive using lipid only formulations.
Compared to lipids, amphipathic peptides are an alternative, and more flexible, means of triggering release of drugs from liposomes15 over a pH range. These peptides are yet to be explored in vivo for delivering anticancer drugs. Usually such amphipathic peptides undergo a coil to helix transition to fully integrate with the lipid bilayer and show membrane permeablising (lytic) activity. GALA17 is one of the best characterised and is an efficient pH specific model peptide that shows formation of an alpha helix linked to its lytic activity as the pH is lowered to 5.0. An analogue of the GALA peptide, with carefully positioned glutamyl residues on the same face of the α-helix, succeeded in triggering drug release around pH 6, while retaining drug above pH 6.5 in cell models.18 Similarly cholesterol modified GALA, when anchored to a membrane, was able to trigger cytosolic release of rhodamine from internalised liposomes.19 However, to exploit the mild acidity found in the tumour interstitium, the peptide mediated release of payload needs to be abrupt and closer to pH 7.0. Hence we attempted to prepare a mixture of peptide–liposome nanoparticles herein named in short as “PLNs” with an operating pH shifted more towards the pH value found in tumours. To do this we modified the GALA sequence at two residues, to help stabilise the helix and assist its integration with the liposomes. As the interaction between peptide and liposome is reversible the study is restricted to exploring whether PLNs, produced by simple pre-incubation of peptide and liposomes would be able to show targeted release of encapsulated calcein, in the extracellular tumour interstitial fluid where the minimum pH value may be in the 6.8–6.5 range. The study provides a proof-of concept that liposomes and pH-sensitive peptide when co-administered have the potential to reach the tumour as an integrated nanoparticle assembly that remains pH responsive in tumour tissues.
Materials and methods
Materials
All general chemicals were purchased from Sigma-Aldrich (UK) and Fisher Scientific (UK) unless stated otherwise. Nα-Boc-Ala, Nα-Boc-Arg (Tos), Nα-Boc-Glu (Obzl), Nα-Boc-His (Bom), Nα-Boc-Leu, Nα-Boc-Trp (CHO), MBHA resin, 2-(1H-benzotriazole-1-yl)-1,1,3,3-tetram ethyluronium hexafluorophosphate (HBTU) were purchased from Bachem (UK). The peptide GALA was purchased from AnaSpec. Analogs (Table 1) of GALA, peptide were synthesized manually on a 0.25 mmole scale using t-Boc chemistry. For amino acids coupling 3![[thin space (1/6-em)]](https://www.rsc.org/images/entities/char_2009.gif) :
:![[thin space (1/6-em)]](https://www.rsc.org/images/entities/char_2009.gif) 3
3![[thin space (1/6-em)]](https://www.rsc.org/images/entities/char_2009.gif) :
:![[thin space (1/6-em)]](https://www.rsc.org/images/entities/char_2009.gif) 9 equivalents of amino acid, HBTU and N,N-diisopropylethylamine (DIPEA) were used allowing 40 minutes for the reaction to complete. Double couplings were performed when necessary as judged by testing the resin with ninhydrin. Peptides 2 and 3 were myristoylated by capping the N-terminal amino with myristic anhydride (3 eq.) in DMF containing DIPEA (6 eq.) base. Resin assembled peptides were pretreated with 20% piperidine in DMF for 1 hour to remove the formyl group from the tryptophan and then cleaved from the resin with hydrogen fluoride (BOC, UK) in the presence of p-thiocresol and p-cresol as scavengers. Crude peptides were purified on a C-4 reverse-phase HPLC column (Vydac 21.2 × 250 mm) using a gradient from 30% acetonitrile–0.1%TFA to 80% acetonitrile–0.1%TFA over 50 minutes with a flow rate of 8 ml min−1. Final products were characterised to show HPLC purity in excess of 95% and M + H+ values to be within 0.5 unit of the calculated mass as measured by Maldi-TOF (Thermobioanalysis). Peptide concentrations were calculated by absorbance at 280 nm using an extinction coefficient of 5690 cm−1 M−1.
9 equivalents of amino acid, HBTU and N,N-diisopropylethylamine (DIPEA) were used allowing 40 minutes for the reaction to complete. Double couplings were performed when necessary as judged by testing the resin with ninhydrin. Peptides 2 and 3 were myristoylated by capping the N-terminal amino with myristic anhydride (3 eq.) in DMF containing DIPEA (6 eq.) base. Resin assembled peptides were pretreated with 20% piperidine in DMF for 1 hour to remove the formyl group from the tryptophan and then cleaved from the resin with hydrogen fluoride (BOC, UK) in the presence of p-thiocresol and p-cresol as scavengers. Crude peptides were purified on a C-4 reverse-phase HPLC column (Vydac 21.2 × 250 mm) using a gradient from 30% acetonitrile–0.1%TFA to 80% acetonitrile–0.1%TFA over 50 minutes with a flow rate of 8 ml min−1. Final products were characterised to show HPLC purity in excess of 95% and M + H+ values to be within 0.5 unit of the calculated mass as measured by Maldi-TOF (Thermobioanalysis). Peptide concentrations were calculated by absorbance at 280 nm using an extinction coefficient of 5690 cm−1 M−1.
| Peptide | Sequence |
|---|---|
| (1) GALA | WEAALA EALAEALAEHLAEALAEALEALAA |
| (2) C-amidated | WEAALA EALAEALAEHLAEALAEALEALAA-NH2 |
| (3) N-myristoyl and C-amidated | Myr-WEAALA EALAEALAEHLAEALAEALEALAA-NH2 |
| (4) Glu 19 → Arg in peptide 3 | Myr-WEAALA EALAEALAEHLARALAEALEALAA-NH2 |
Liposomes were prepared21 by hydrating lipid films, comprising 40![[thin space (1/6-em)]](https://www.rsc.org/images/entities/char_2009.gif) :
:![[thin space (1/6-em)]](https://www.rsc.org/images/entities/char_2009.gif) 20
20![[thin space (1/6-em)]](https://www.rsc.org/images/entities/char_2009.gif) :
:![[thin space (1/6-em)]](https://www.rsc.org/images/entities/char_2009.gif) 1 molar ratio of phosphatidylcholine (Lipid Products, Nutfield, UK) from egg lecithin, cholesterol and 1,1′-dioctadecyl-5,5′-diphenyl-3,3,3′,3′-tetramethyl indocarbocyanine (DiI) lipophilic tracer (Invitrogen, Netherlands) with a solution of 120 mM calcein prepared in PBS buffer. Following 10 extrusion cycles (Avestin Liposofast 100) at room temperature through 0.1 nm polycarbonate filters (Nucleopore), non-encapsulated dye was separated by gel filtration using Sepharose CL6B (Sigma) column. Lipid concentration was assayed according to the method by Stewart22 and adjusted to 3 mg ml−1. The average hydrodynamic size of liposomes was typically approx. 126 nm (polydispersity index < 0.2) as determined by dynamic light scattering (DLS) using a Malvern 4700 system (Malvern Instruments Ltd, UK). For determining the interaction of peptide with liposomes, based on tryptophan fluorescence or for testing the haemolytic activity of PLNs, the liposome preparation method was essentially the same except both the calcein and DiI dyes were excluded to avoid any interference. Glucose oxidase (GOX) containing liposomes were prepared using the same method with the substitution of calcein and DiI with 2361 units per ml of GOX enzyme dissolved in 4 ml of hydration buffer.
1 molar ratio of phosphatidylcholine (Lipid Products, Nutfield, UK) from egg lecithin, cholesterol and 1,1′-dioctadecyl-5,5′-diphenyl-3,3,3′,3′-tetramethyl indocarbocyanine (DiI) lipophilic tracer (Invitrogen, Netherlands) with a solution of 120 mM calcein prepared in PBS buffer. Following 10 extrusion cycles (Avestin Liposofast 100) at room temperature through 0.1 nm polycarbonate filters (Nucleopore), non-encapsulated dye was separated by gel filtration using Sepharose CL6B (Sigma) column. Lipid concentration was assayed according to the method by Stewart22 and adjusted to 3 mg ml−1. The average hydrodynamic size of liposomes was typically approx. 126 nm (polydispersity index < 0.2) as determined by dynamic light scattering (DLS) using a Malvern 4700 system (Malvern Instruments Ltd, UK). For determining the interaction of peptide with liposomes, based on tryptophan fluorescence or for testing the haemolytic activity of PLNs, the liposome preparation method was essentially the same except both the calcein and DiI dyes were excluded to avoid any interference. Glucose oxidase (GOX) containing liposomes were prepared using the same method with the substitution of calcein and DiI with 2361 units per ml of GOX enzyme dissolved in 4 ml of hydration buffer.
pH dependent liposome leakage assays
Peptides (15 nM) were assayed for their ability to release payload by de-quenching of calcein fluorescence from liposomes (3 μM lipid) over the pH range 6.5 to 7.4 in 10 mM citrate–phosphate buffer supplemented with 140 mM NaCl. Perkin Elmer LS-50B fluorometer set at an excitation λ of 420 nm and an emission λ of 520 nm was used. ‘End point’ readings were taken after 10 min, when Triton X-100 (0.1% w/v) was added and fluorescence after a further min taken as 100% release (Ff) against baseline fluorescence of each incubate (Fi). Percentage calcein release was normalised as [(Ft − Fi) × 100]/(Ff − Fi), where Ft is fluorescence at time (t = 10 min) after addition of the peptide. The lysis of the GOX liposomes (10 μg lipid) was followed by the addition of 0.5 ml solution A (300 mg glucose and 200 I.U of horse radish peroxidase) and 0.5 ml of solution B (20 mg ml−1 5-amino salicylic acid), both in 50 mM phosphate buffer at pH 6.0. Absorbance was recorded continuously at 450 nm after the addition of peptide or Triton X-100.Peptide–liposome nanoparticles (PLNs)
The association of the peptide with liposomes was characterised by an increase in tryptophan fluorescence emission at 340 nm when excited at 280 nm using Perkin Elmer LS-50B fluorometer. Spectra were corrected for background by subtracting any signal from liposomes and buffer alone. PLNs were prepared by adding peptide (2.2 μM) to a constantly stirred solution of liposomes (1.9 mM lipid) in phosphate-buffered saline (PBS) containing 5 mM HEPES pH 7.4 and 1 mM EDTA over 5 minutes. Myristoyl residue on the N-terminal is important for anchoring the peptide to form a complex with liposomes. The size and the polydispersity index of PLNs was characterised by DLS using the Malvern 4700 (UK-Malvern, Nano series ZS) Zeta Sizer. Measurements were performed in a clean four sided quartz cuvette containing PLNs in filtered (0.22 μm filter, Millipore, SLGP R25 LS) buffer. Samples were allowed to equilibrate for 5 minutes before the intensity weighted mean diameter (z-average diameter) were determined by averaging five runs for each sample.To test the lytic activity PLNs, at different time intervals and over a range of pH values, the PLNs were immediately diluted 10 fold for loading into the dispenser unit. Labsystems Fluoroskan (Ascent FL) then dispensed 10 μl of the aliquots at 20 min time intervals into wells containing 180 μl of buffer (10 mM sodium citrate phosphate supplemented with 140 mM NaCl, 5 mM HEPES and 1 mM EDTA) adjusted to pH 7.4, 6.8, 6.5 and 6.0. Fluorescence intensity in each well was read (Ex 485 nm Em 535 nm) at a fixed time of 10 min after each dispensing. A series of wells containing either liposomes only or Triton were added to determine background and 100% lysis respectively. Four replicates were used for each determination. For testing, in presence of plasma, the method was essentially the same except testing time periods were longer and the PLNs were pre-treated with equal volume of freshly prepared mouse plasma before any dilution took place to load the dispenser.
Circular dichroism spectroscopy
CD spectra were taken on a Jasco J810 spectropolarimeter at 0.2 nm intervals over the wavelength range 200–250 nm and with 0.1 mm path length cells (Hellma) at 25 °C. Samples in the same 10 mM citrate phosphate-buffered saline at pH 5.0 and 7.4 were scanned three times at 40 nm per minute with a time constant of 1 s. The CD spectra in low salt buffers were carried out using 5 mM Tris piperazine buffer at various pH values adjusted with 0.3% perchloric acid.43 Following averaging and correction for background by subtracting the spectrum without peptide, data was expressed as mean residue molar ellipticity, from which the helix content was estimated.23Epifluorescence imaging
In vivo and in vitro imaging was performed with a Nikon E800 microscope equipped for epifluorescence with a 100 Watt mercury lamp attenuated by a ND-16 filter. A multiple-band dichroic mirror and barrier filter (Chroma Technology Corp, model 61002) allowed the observation of red (600–650 nm) DiI fluorescence and green (520–540 nm) calcein fluorescence. An appropriate single-band excitation filter (490 or 570 nm narrow band-pass) was moved into the illumination path by computer-controlled filter wheel. Images were projected onto a scientific-grade CCD camera (Micro-max, Princeton Instruments) and captured at intervals of 30 to 60 seconds with a typical exposure time of 100 ms per image over a typical period of 30 minutes. In the intervals between images, an electronic shutter blocked the illumination path to minimise photo-damage. Automated data acquisition routines were written using imaging control software (MetaMorph®, Universal Imaging) to program the operation of the lamp filter wheel and shutter for selecting of fluorescence excitation, operation of the CCD camera and analysis of images. The following calculations were performed in real time: subtraction of background intensity levels; calculation of mean, maximum, and variance of fluorescence intensity; relative change in intensity for each fluorescence channel; and ratio of intensities at different wavelengths.Clearance from blood circulation of PLNs
Female C3H mice (8 to 10 weeks, 20–25 g) were divided into groups each of 3 mice. Calcein–DiI liposomes were injected (200 μl) into the tail vein of each mouse at a dose of 0.8 μmole lipid. Blood samples (0.1 ml), collected under terminal anaesthesia by cardiac puncture at various time intervals, were diluted with PBS pH 7.4 buffer (1 ml) and centrifuged for 1 min at 13![[thin space (1/6-em)]](https://www.rsc.org/images/entities/char_2009.gif) 000g. Supernatant (0.5 ml) was taken and diluted into 2 ml of PBS pH 7.4, when calcein fluorescence was monitored before and after Triton X-100 (0.1% v/v) treatment using the Perkin Elmer LS-50B fluorometer.
000g. Supernatant (0.5 ml) was taken and diluted into 2 ml of PBS pH 7.4, when calcein fluorescence was monitored before and after Triton X-100 (0.1% v/v) treatment using the Perkin Elmer LS-50B fluorometer.
Haemolytic assays
A 100 μl aliquot of washed erythrocytes (3.45 × 10⁸ cells per ml) was placed into an Eppendorf containing 800 μl of buffer (10 mM citrate phosphate pH 7.4 supplemented with 140 mM NaCl, 5 mM Hepes and 1 mM EDTA). To this was added 100 μl of test samples containing 4 μM peptide, except for controls which were either 100 μl buffer or 100 μl of 10% Triton X-100. Each Eppendorf was incubated for 30 minutes before being centrifuged (5 minutes at 1500 rpm). Aliquots of 200 μl of supernatant were then transferred to a 96 microwell plate (costar) and the Absorbance recorded at 550 nm on a Tecan Safire microwell plate reader.pH sensitivity of PLNs accumulated in excised tumours
KHT and radiation-induced fibrosarcomas (RIF-1) cell lines were kindly donated by The Experimental Oncology Group, Manchester University, UK. The cells in T75 flasks were cultured at 37 °C in 5% carbon dioxide atmosphere in Dulbecco's modified Eagle's medium (DMEM Sigma) containing antibiotics and supplemented with 10% v/v heat-inactivated foetal calf serum (FCS Sigma) and 2 mM L-glutamine. Once cells were 90% confluent they were treated with 0.05% trypsin in EDTA for 15 min with gentle agitation. The cells were then gently centrifuged 1800 rpm for 10 minutes, and resuspended in 1 ml of DMEM. C3H syngenic mice (8–10 weeks old and weighing 20–25 g) were each subcutaneously injected with 5 × 10⁶ cells (0.1 ml) on their dorsal side to initiate tumour growth. After 13 days, when size of tumours reached between 200 and 400 mm3, PLNs or liposomes at a dose of 0.8 μmole lipid were administered into the tail vein. After 3 hours, tumours were aseptically excised and transferred into PBS pH 8 buffer and sliced into thin sections (60–100 μm). Each slice, mounted in a perfusion chamber on the microscope stage, was bathed with PBS buffer of pH 8. The microscope was fitted with epifluorescence optics, positioned to image and monitor epifluorescence. The perfusion buffer was replaced with 10 mM citrate–phosphate buffer at pH 5.8 and epifluorescence imaging continued.Intra-tumoral pH measurements
In order to lower tumour pH,16 mice were given intra-peritoneal doses of 40 mg kg−1meta-iodobenzylamine (MIBG) and 1.5 g kg−1D-glucose dissolved in PBS. Control mice received the same volume (0.2 ml) of saline solution. One hour later, the mice were anaesthetized with Hypnorm-midazolam, when intra-tumoral pH was estimated by inserting into each tumour a needle (20G) microelectrode (tip diameter 0.89 mm; model 818; Diamond General, Ann Arbor, MI).Window-chamber in vivo measurements
The dorsal skin flap window chamber model10,24–26 with RIF allografts, known to be more MIBG-sensitive than KHT tumours, was used to evaluate the PLNs in vivo performance with respect to calcein release. A small piece (∼1 mm cube) of tumour tissue (RIF-1) was implanted in a dorsal skin fold of each mouse. After 7–10 days, the tumour in the chamber typically grew to 2–3 mm in diameter and blood flow was visible in new tumour blood vessels. Mice were similarly treated with either MIBG/glucose or saline (control), 3 hours prior to IV treatment (0.4 μmole lipid) with PLNs or liposomes (control). Throughout mice were kept anaesthetized (Hypnorm/pentabarbitol/water) on a warmed microscope stage. Skin fold chambers were viewed through a 4× (NA 0.13) objective. Trans-illuminated brightfield images of small tumour vasculature networks with brisk blood flow were recorded using halogen lamp. Epifluorescence illumination was realised as described in the previous section. Tissue auto-fluorescence under the same exposure conditions were subtracted from the measured epifluorescence intensities. Release kinetics were recorded as intensity versus time for each of the two fluorescence channels. Normalised dual fluorescence ratiometric kinetic plots were computed as:where Icontents is calcein fluorescence intensity while Ilipo is the DiI intensity. The ratio immediately after injection (i.e., when the step increase in tissue fluorescence occurred) was taken as 1. Using the normalised fluorescence ratio, any changes in fluorescence associated with accumulation or clearance of liposomes are minimised or ruled out. Changes in the ratio can thus be taken to reflect release of liposome contents.
All experiments involving animals were approved by local ethics committees and carried out according to the Scientific Procedure Act 1986 under the Home Office License 40/2082 (Manchester).
Results & discussion
Design & lytic activity
Peptides which are able to lyse liposomes are generally regarded unsafe for use in drug delivery due to their cytolytic action and toxicity towards healthy cells. Recently reports have suggested that lipopeptides, when integrated with liposomes, may succeed in overcoming such limitations. Lin et al.27 succeeded in demonstrating that GALA peptide modified on the N-terminal with fatty acyl chains (palmitoyl or lauryl) became considerably more lytic towards liposomes and yet did not impair cell viability. As a further example Etzerodt et al.28 prepared a dimyristoyl GALA analogue and incorporated this into liposomes in stable form with relatively little fusion at pH 7.4 and above. Such studies offer assurance for safer design of efficient drug delivery systems in which peptide and liposomes are combined to constitute multifunctional nanoparticles with lower toxicity.The modification of the GALA sequence (Table 1) in this study included N-terminal myristoyl modification, substitution of glutamate-19 with arginine and C-terminal amidation. Peptides were >95% pure and characterised by mass spectrometry. An Arg residue was strategically placed towards the centre of the sequence with the expectation that this may aid salt bridge formation with the Glu residues located near by, on the same face of the amphipathic helix.
To predict and compare, peptide P4 with the GALA sequence, AGADIR algorithm29 was used to simulate the pH dependence profile of their helix contents (Fig. 1a). The software allows the option of the N terminal to be capped with an acetyl group and the C terminal to amidated. In line with the pKa values of glutamyl residues the GALA peptide exhibited transition to higher helical content at pH values below 5.5. In contrast a close analogue of P4, with the N-terminal acetylated rather than myristoylated was predicted to yield an even higher helix content (∼90%) that remained almost independent of pH.
The secondary structure of the P4 peptide studied by CD spectroscopy (Fig. 1b) gave minima at 208 nm and 222 nm, suggestive of a right-handed α-helical conformation. Using the method of Chen et al.23 the helix content is estimated to be 93% at pH 7.4 and this value, consistent with the above predicted N-terminally capped structure, did not increase significantly on lowering the pH to 5.
This remarkably high degree of helix content independent of acidity is distinct from GALA30 which is well documented to rely on pH dependent coil to helix transitions for lytic activity. The central location of Arg residue substitutes the i → i + 4 destabilising electrostatic repulsion between Glu residues with a stabilising salt bridge involving Glu15 and Arg19 side chains.
Overall this may assist in stabilising helical conformation on both the N- and C-terminal segments. The use of a high salt concentration in co-ordinating buffers can often hinder detection of small changes in conformation. For this reason the CD spectra for P4 were also recorded in 5 mM Tris piperazine buffer and compared to the GALA peptide under identical conditions. While the GALA peptide exhibits the expected acid induced helix formation, the P4 peptide did not show appreciable (Fig. 7) dependence of ellipticity on pH. It is thus unlikely that changes in helical structure due to lowered acidity contribute to induced lysis of liposomes closer to the physiological pH.
The lytic activity of the peptide P4, at a lipid to peptide ratio of (200![[thin space (1/6-em)]](https://www.rsc.org/images/entities/char_2009.gif) :
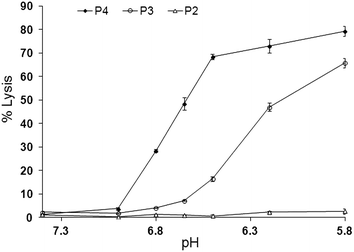
:![[thin space (1/6-em)]](https://www.rsc.org/images/entities/char_2009.gif) 1), was evaluated by following release of entrapped calcein from liposomes over a 10 minute period at different pH values as shown in Fig. 2. All peptides were inactive at pH 7.4. As expected, simply C-terminal amidated GALA (P2), was poorly lytic over the entire range pH 6.5 to 7.4 whereas the myristoyl analogue P3 displayed significant activity (∼15% release) at pH 6.5.
1), was evaluated by following release of entrapped calcein from liposomes over a 10 minute period at different pH values as shown in Fig. 2. All peptides were inactive at pH 7.4. As expected, simply C-terminal amidated GALA (P2), was poorly lytic over the entire range pH 6.5 to 7.4 whereas the myristoyl analogue P3 displayed significant activity (∼15% release) at pH 6.5.
This observation is consistent with reports showing that the triggering range for GALA is below pH 6.5 and that modification of lytic peptide with myristoyl residue can increase its lytic activity.20,21,27
The greatest lytic activity was shown by the newly designed myristoyl and arginine modified peptide (P4) with a substantial (>70%) release at pH 6.5 and appreciable (∼32%) release at pH 6.8. The exact mechanism of calcein release by the peptide is not clear. In comparison to GALA a combination of helix stabilisation, lower negative charge and the ability of the myristoyl modification to encourage association with liposomes may all account for the observed increased lytic activity as well as the shift of the onset of lytic activity towards the physiological pH. The increase in helix content has been noted before27,28 for other fatty acid modified GALA type sequences including dimyristoyl-GALA, palmitoyl-GALA, lauryl-GALA.
The ability to promote substantial release of calcein in mildly acidic buffer is a key characteristic for the functioning of PLNs close to physiological range. Consequently P4 was considered as a suitable candidate for assimilating PLNs and demonstrating release of payload in response to tumour microenvironment.
Association of P4 with liposomes
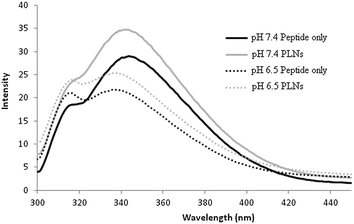
The association of the GALA peptide with phosphatidylcholine liposomes composed from egg yolk lecithin and cholesterol can be inferred from changes in tryptophan fluorescence emission intensity.17,30 Incubation of peptide P4 with liposomes for five minutes resulted in an increase in fluorescence emission at pH 7.4 indicating its insertion into a non-polar environment (Fig. 3).Hence at pH 7.4 the peptide P4 appears to have the ability to integrate with liposomes. This is in sharp contrast to GALA that is reported not to exhibit such an increase at the same pH as a reflection of its inability to form a complex with liposomes.30 Extended incubation time with liposomes did not appreciably change the fluorescence emission suggesting that the insertion into the lipid bilayer is rapid and largely takes place within the first five minutes.
At a pH value of 6.5 where the peptide is lytic against liposomes (Fig. 2) a slight increase in fluorescence intensity is again observed but this is also accompanied by a ∼4 nm blue shift in λmax indicative of an enhanced hydrophobic environment at low pH. To form a non-lytic complex between liposomes and peptide at pH 7.4 their respective ratios were altered to reach an optimum at which PLNs show little or no leakage at pH 7.4, over a longer period of time, while exhibiting a relatively higher degree of lysis at acidic pH. For peptide P4 the optimum lipid to peptide ratio was found to be 864![[thin space (1/6-em)]](https://www.rsc.org/images/entities/char_2009.gif) :
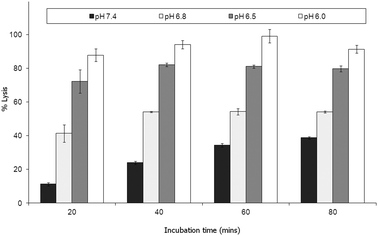
:![[thin space (1/6-em)]](https://www.rsc.org/images/entities/char_2009.gif) 1. Fig. 4 and 8 show the stability of this preparation. Dynamic light scattering was used to characterise these PLNs. The Z-average diameter was 127.5 nm and almost independent (Table 2) of pH. Liposomes without peptide also showed a comparable diameter around 126.2 nm. Liposomes associated with peptide are thus likely to be reasonably stable with regards to their particulate nature without evidence of fusogenic activity. PLNs incubated for 20 minutes at pH 7.4 did not show any significant change in size with an average diameter of 125.9 nm and retained their homogeneity with a polydispersity value of 0.168.
1. Fig. 4 and 8 show the stability of this preparation. Dynamic light scattering was used to characterise these PLNs. The Z-average diameter was 127.5 nm and almost independent (Table 2) of pH. Liposomes without peptide also showed a comparable diameter around 126.2 nm. Liposomes associated with peptide are thus likely to be reasonably stable with regards to their particulate nature without evidence of fusogenic activity. PLNs incubated for 20 minutes at pH 7.4 did not show any significant change in size with an average diameter of 125.9 nm and retained their homogeneity with a polydispersity value of 0.168.
| Sample | pH 7.4 Z-ave (nm) | pH 7.4 PdI (%) | pH 6.0 Z-ave (nm) | pH 6.0 PdI (%) |
|---|---|---|---|---|
| Liposomes | 126.2 | 0.146 | 126.9 | 0.168 |
| PLNs | 127.5 | 0.195 | 123.9 | 0.122 |
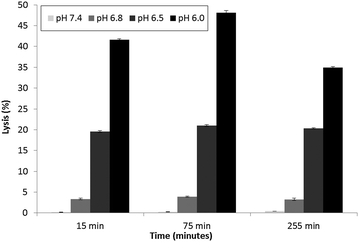
Parente et al.31 also reported no pH dependent increase in light scattering signal for liposomes where diameters exceed 50 nm when exposed to GALA. An identical observation has recently28 been made for dimyristoyl-GALA associated with 106 nm diameter POPC liposomes. Fig. 4 compares the stability of the resulting PLNs by following calcein release. The PLNs became unstable, releasing calcein, as the pH was lowered and time increased. At physiological pH a 22% background lysis is seen over 40 minutes.
As lytic activity is dependent on peptide concentration this level of leakage at pH 7.4 can in practice be reduced further by increasing the lipid to peptide ratio. However such an action would also significantly reduce the overall % lysis at acidic values yielding less pH responsive PLNs.
Nevertheless for animal studies it is paramount to reduce any undue lysis as much as possible without significantly compromising the response to pH. Lin et al.27 tested the cytotoxic action of a fatty acid modified GALA analogue in cell culture media and found that there was little or no effect on viability. The authors argued that one reason for this may be that the lipopeptide could be buffered by the serum proteins. On this basis we would also expect the small % of undue leakage at pH 7.4 to become negligible in the presence of serum proteins.
Indeed when the PLNs prepared above were incubated with mouse plasma for various lengths of time and then re-evaluated (Fig. 8), we noted very little lysis at physiological pH. More importantly the PLNs remained pH responsive, albeit less so at pH 6.8 than before.
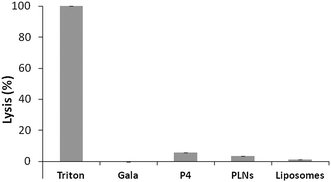
Cytolytic peptides can be haemolytic, causing cytotoxicity. To further test toxicity haemolytic assays were carried out. The overall % lysis was found to be low for P4 (<6%) (Fig. 5) and this was further reduced for PLNs indicating that the peptide was less accessible to erythrocytes. This would be expected if the peptide became associated with liposomes. The small % lysis seen for P4 implies the peptide is able to permeabilise cell membranes and release large molecules. The parent peptide GALA is known31 to form discrete pores that permit only small molecules, less than 800 molecular weight, to leak from liposomes.
On this basis, GALA peptide would not be expected to release haemoglobin from erythrocytes. Indeed the haemolytic activity of GALA peptide is negligible compared to P4 (Fig. 5). The lytic activity of GALA on liposomes is well known to be significantly impaired41 by presence of cholesterol at more than 30% molar excess over the lipid concentration. Hence the mechanism of action for these two peptides must be very distinct. In order to investigate this further, liposomes composed of egg PC and cholesterol at a 2![[thin space (1/6-em)]](https://www.rsc.org/images/entities/char_2009.gif) :
:![[thin space (1/6-em)]](https://www.rsc.org/images/entities/char_2009.gif) 1 molar ratio and encapsulating a large molecular weight protein marker, glucose oxidase (GOX), were tested against both the GALA peptide and P4. The release of GOX was continuously followed using a colorimetric assay of the enzyme activity. As expected the GALA peptide did not reveal any leakage of GOX when compared to liposomes alone (Fig. 6). In contrast when the peptide P4 is added an immediate increase in activity is noticed as lysis occurs to release the enzyme. To release such large molecules of the size of GOX (Mw 160 kDa) it is highly likely that the peptide P4 is acting as a surfactant-like membrane disrupter rather than a discrete pore former. Indeed myristoylation of the peptide will favour micelle formation at low pH.
1 molar ratio and encapsulating a large molecular weight protein marker, glucose oxidase (GOX), were tested against both the GALA peptide and P4. The release of GOX was continuously followed using a colorimetric assay of the enzyme activity. As expected the GALA peptide did not reveal any leakage of GOX when compared to liposomes alone (Fig. 6). In contrast when the peptide P4 is added an immediate increase in activity is noticed as lysis occurs to release the enzyme. To release such large molecules of the size of GOX (Mw 160 kDa) it is highly likely that the peptide P4 is acting as a surfactant-like membrane disrupter rather than a discrete pore former. Indeed myristoylation of the peptide will favour micelle formation at low pH.
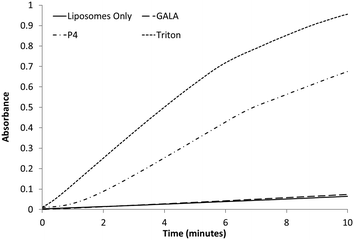 | ||
Fig. 6 Colorimetric assay following the release of GOx from egg PC![[thin space (1/6-em)]](https://www.rsc.org/images/entities/char_2009.gif) : :![[thin space (1/6-em)]](https://www.rsc.org/images/entities/char_2009.gif) Ch liposomes with the addition of 0.1 μM peptide or 1% Triton. A baseline of liposomes only was recorded for comparison. Ch liposomes with the addition of 0.1 μM peptide or 1% Triton. A baseline of liposomes only was recorded for comparison. | ||
In line with this Lin et al.27 found that GALA is unable to release dextran of molecular weight 4 kDa while lauryl-GALA can efficiently release this payload by self-assembling into micelles in the low μM range.
Since the secondary structure of the P4 is not appreciably affected by pH (Fig. 1b and 7b) the mechanism of membrane disruption may be predominately governed by the increased net hydrophobicity of the peptide as pH is lowered. This does not however explain why the peptide's pH of activation is shifted towards a value of pH 6.8. In the P4 sequence the Glu residues are strategically placed to adopt an almost ideal amphipathic helix which is stabilised by the Glu–Arg salt bridge. Such a structure, especially when in hydrophobic environment or when in association with membranes, assisted by the increased solubility in bilayer due to myristoyl residue, can be expected to have perturbed pKa values for Glu residues which are upshifted towards neutral pH. It is not uncommon for charged residues in amphipathic helices to have the pKa values of their side chains significantly different from free amino acids.4 For the GALA peptide it would be energetically unfavourable to transfer a net negative charge of −6.9 into the bilayer. The end capping of charged termini on P4 helps reduce the net negative charge to −4.9 and this together with myristoyl residue promoting interaction with lipid bilayer may provide sufficient driving force to tether the amphipathic helix with the membrane. In this state partially buried Glu residues will be expected to have higher a pKa than free Glu residues due to loss of hydration.42 This would allow Glu residues to function as hydrogen acceptors much closer to the physiological range. On the other hand the GALA peptide which is not able to embed within the membranes at pH 7.4 in its non-helical form will lack these effects. There is some evidence that the P4 peptide may have tendency to self-associate even in aqueous buffers when devoid of high salt concentration. This is apparent from the ratio of ellipticity values at 222 nm![[thin space (1/6-em)]](https://www.rsc.org/images/entities/char_2009.gif) :
:![[thin space (1/6-em)]](https://www.rsc.org/images/entities/char_2009.gif) 208 nm being greater than unity (Fig. 7).
208 nm being greater than unity (Fig. 7).
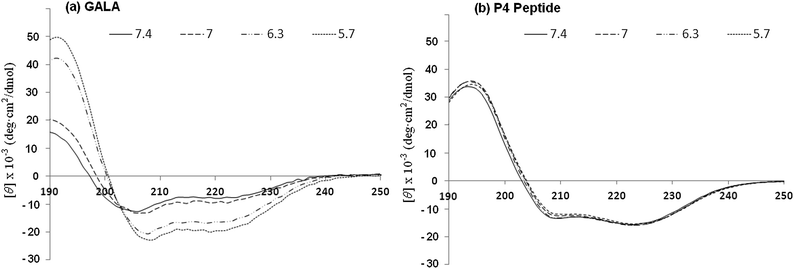 | ||
| Fig. 7 CD spectra for GALA (a) and P4 (b) peptides in 5 mM Tris piperazine buffer at different pH values. | ||
When the helix is stabilised in much lower dielectric constant media as within the membrane, the negative charge repulsion at pH 7.4 from glutamate residues will be sufficient to provide counter-balancing destabilising forces acting to prevent further intermolecular association of peptides needed for micelle formation. However on mild acidification, the loss of negative charges will render P4 significantly more hydrophobic in the helical form. The increased hydrophobicity alone may allow the helices bearing myristoyl residue to self-associate further and cause bilayer disruption through micellization. This may explain why the rate of release of GOX from liposomes by P4 and triton were both high (Fig. 6) as can be expected from the micellization process. Moreover the blue shift in fluorescence emission at pH 6.5 (Fig. 3) is an indication that the peptide may have a different state of aggregation when in the active state.
Retention of pH sensitivity when accumulated in excised tumour slices
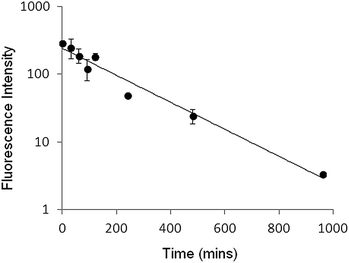
While recognising that a simple mixture of peptide and liposomes (PLNs) is only transiently stable and not robust enough to constitute a pharmaceutical drug delivery formulation, the over four hour stability period seen in plasma (Fig. 8) does provide an adequate time window to evaluate their response to pH, in vivo, as a proof of concept.Clearance rates of the liposome used for PLNs in mice, assayed by total calcein fluorescence, gave a characteristic profile with a half-life of 2.5 hours (Fig. 9). This circulation time for the given particle size (∼127 nm) should allow sufficient accumulation in the tumour to be able to follow calcein release in real time.32,33
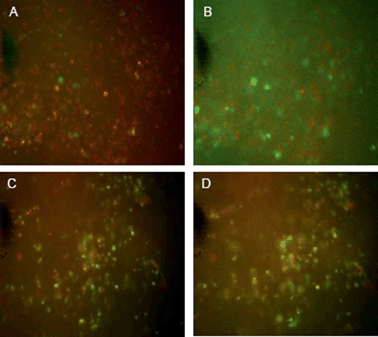
Studies were thus carried out to determine whether the PLNs remain “intact” in vivo, such that they would continue to exhibit a pH-triggered release of contents. KHT34 fibrosarcoma allograft was used for this experiment as its extracellular pH is reported to be slightly above neutral35 to allow accumulation of PLNs without provoking any significant calcein release. Three hours were allowed for accumulation of PLNs in the KHT allograft tumours before excising the tissue and placing in a perfusion chamber. Intensely-green, de-quenched calcein fluorescence became evident when the perfusion buffer was acidified to pH 5.8 (Fig. 10B), compared to images at physiological pH 7.4 (Fig. 10A) or when calcein–DiI liposomes alone were used without the peptide P4 (Fig. 10C and D).
These observations indicate that a significant portion of the PLNs that accumulated in the tumour mass remained intact within the tumour tissue and responsive to extracellular pH. The results also suggest that the extracellular pH of the KHT tumour allografts in situ was not sufficiently acidic to cause a substantial release of calcein during the three hour period between liposome administration and tissue excision. It is notable that although significant portion of the observed release may be rapid and extracellular, when the pH is made acidic, there may be an additional small level release contributed from any PLNs that may have been taken up into cells causing a slower release from within the intracellular compartments.
Validation of intra-tumoral pH
To demonstrate in vivo triggering of calcein release, under mildly acidic conditions, a suitable well-characterised tumour model was sought. Previous reports in the literature indicated that the combination of the mitochondrial respiratory inhibitor meta-iodobenzylguanidine (MIBG) with hyperglycemia significantly enhanced extracellular acidification in rodent radiation-induced fibrosarcoma (RIF-1) tumours, while only transient or modest effects were exerted upon normal tissues.2,16Such treatment was reported to decrease the pH of interstitial fluid by 0.55 units. To validate the use of this model tumour system and demonstrate micro-environment triggered calcein release, a series of experiments were performed to confirm the repeatability of pH in this model. In mice bearing RIF-1 tumours, needle-electrode pH measurements detected significant acidification at 4 hours after MIBG/glucose as summarised in Table 3. Sham-treated tumour pH was significantly more acidic than non-tumour (muscle) tissue, by 0.21 pH units. The MIBG/glucose treatment further reduced the tumour pH by 0.42 units below that of normal muscle tissue pH to reach a value of 6.57. These levels of tumour tissue acidification were statistically significant (p < 0.01).
| Treatment | RIF tumour pH | Muscle pH | Difference |
|---|---|---|---|
| Untreated | 6.80 ± 0.06 | 7.01 ± 0.08 | −0.21 |
| MIBG/glucose | 6.57 ± 0.09 | 7.00 ± 0.23 | −0.42 |
It is worth mentioning that experiments were also performed with KHT allograft but the difference between the muscle tissue and tumour pH was found to be significantly smaller (−0.28 unit, p < 0.01, paired one-tailed t-test). Given that the intra-tumoral acidity differences (Table 3) were of sufficient magnitude to nearly approach the pH value of 6.5 where calcein release in plasma was provoked (Fig. 8) and that PLNs can accumulate and remain responsive to pH in tumour microvasculature (Fig. 10), triggered release of calcein from PLNs in vivo was tested.
Release of calcein in response to RIF tumour pH
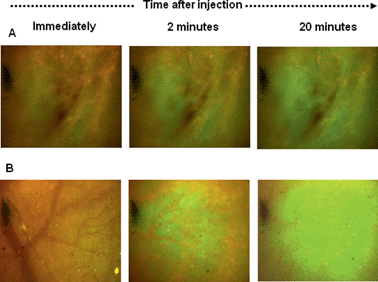
To quantitatively assess calcein release from the PLNs, fluorescence changes were monitored by intravital fluorescence microscopy via the dorsal skin-fold window chambers fitted on mice with RIF-1 xenograft implants.24,26 Alternating measurements of red and green fluorescence intensities were taken, every 30 seconds following intravenous (IV) injection to mice with implanted RIF-1 tumour allografts. Development of tumour fluorescence was immediately observed (Fig. 11) due to vascular filing of tissues which is known to occur, largely within 2 min36 Use of membrane-associated fluorophore, DiI as a red fluorescence marker of liposome accumulation is well documented.37 In the MIBG/glucose treated tumours, dual fluorescence images typically showed significant increases in bright green calcein fluorescence (Fig. 11 lower panel, B).In contrast, only modest release of calcein was observed when liposomes alone without peptide were administered (Fig. 11, upper panel, A). Pixel intensities in such images were averaged to monitor calcein and DiI fluorescence signals. The normalised ratio of calcein (contents release) to DiI (accumulation) would then quantitatively reflect the release of calcein payload. Promptly following IV administration filling of the vascular compartment of the tissue a rapid step change in both DiI and calcein fluorescence was observed (arrow in Fig. 12). Subsequently, a slow increase or decrease of DiI fluorescence occurred, reflecting the combined effects of plasma clearance, tending to reduce intensity, and extravasations into interstitial space or uptake into cells, tending to increase intensity.
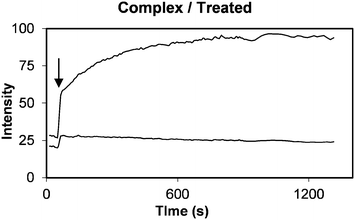 | ||
| Fig. 12 Kinetic plot showing calcein (top curve) and DiI (bottom curve) tissue fluorescence intensity as a function of time following delivery of PLNs to a RIF tumour allograft. MIBG (40 mg kg−1) plus glucose (1.5 g kg−1) treatment was administered in PBS pH 7.4 buffer three hours prior to injecting PLNs at a dose of 0.4 μmole lipid. The normalised ratio plot of this data is shown in Fig. 13 (+) taking the ratio of calcein to DiI fluorescence at the step change marked by arrow as one unit. | ||
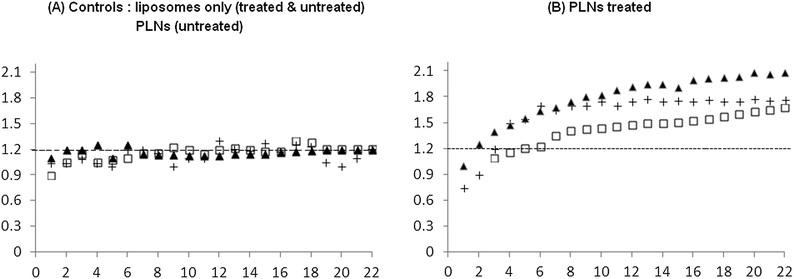
Normalising calcein fluorescence against DiI fluorescence provides a means of minimising variations associated with accumulation or clearance of the liposomes. Normalised dual fluorescence ratiometric kinetic plots were computed by taking the ratio immediately after the step increase in tissue fluorescence as exemplified in Fig. 12 (indicated by an arrow), to be equal to one. The data shown in Fig. 12 thus generates a normalised kinetic plot Fig. 13b represented by (+) indicating significant release of calcein.
Fig. 13 represents data using six different window chambers. Those tumours that received control liposomes (chart A) showed a small change in normalised fluorescence, typically less than 25% increase, irrespective of the MIBG/glucose treatment. Moreover, tumours, without the MIBG/glucose treatment, administered with PLNs also showed a similar (<25%) weak release of calcein (chart A, squares). In contrast, PLNs accumulating in MIBG/glucose-treated tumours (chart B) exhibited significantly (p< 0.001 by unpaired t-test) higher peak normalised calcein between 1.5 and 2. This represents an apparent maximum enhancement of up to 4-fold increased release of calcein in response to MIBG/glucose modulated tumour acidity. The results suggest that this release is likely to be due to the interaction of the P4 peptide and liposomes within the acidified tumour interstitial microenvironment. The consensus in the literature38 is that the pathophysiological changes in average tumour pH pertain to the interstitial fluid and not the regulated intracellular compartment. The pH needle electrode measurements (Table 3) reported here indicated that the average tumour extracellular pH was 6.57, a reduction of approximately 0.4 units compared to normal muscle. As the vascular compartment of the tumour must be maintained at physiological pH, it can be inferred that in some regions of the tumour interstitium, the pH is significantly below this recorded average. For example in a tumour xenograft model, Helmlinger et al.39 measured a steep microscopic pH gradient from physiological (pH 7.4) to acidic as a function of distance from the nearest tumour micro-vessel.
The most plausible explanation for the enhanced release of calcein is that the peptide incorporated into the liposomes responded to the lowered interstitial pH to trigger the contents release into the extracellular compartment of the tumour. Further, evidence that the bulk of the release is extracellular was provided by the ex vivo studies of excised tissue in perfusion chambers, which showed that the calcein released during exposure to pH 5.8 buffer was washed away as the chamber was flushed with additional buffer. As the cell membrane is impermeable to calcein, any contents released from liposomes after cellular uptake are expected to remain in the tissue, and hence are not subject to removal by perfusion. Indeed small levels of intracellular fluorescence can be noted in the sliced tissue (Fig. 10) while the major calcein release was initiated only with pH 5.8 buffer. Again in vivo the main proportion of peptide-triggered release occurred rapidly, in less than 30 minutes after injection, compared to the internalisation of regular liposomes, where release is reported to occur over several hours.9,13,14 Thus the rapidity of calcein release also corroborates the significant proportion of the calcein release to be within the tumour interstitial fluid.
Conclusions
In the quest for effective liposome-based drug-delivery vehicles, a major objective is to produce liposomes that are sensitive to physiologically-relevant changes in microenvironment. Taken together, the results presented here show that a peptide can be “tuned” to destabilise membranes at a pH slightly below that of normal tissue while having the ability to associate with liposomes to comprise peptide liposome nanoparticles (PLNs). The PLNs present in tumour vasculature remained functional after several hours of circulating in blood. Moreover a rapid pH-triggered release of liposome contents slightly below the lowered pH expected in the tumour interstitial space was evident. The in vivo measurements in this study are limited to the tumour implanted window chamber. However the need for MIBG/glucose treatment to trigger calcein release and the fact that extracellular pH is more tightly regulated in normal tissue together with the lack or reduced level of liposome accumulation in most normal tissues provides assurance that the tumour site is the prime target. It is not suggested that this system, designed to validate the PLNs function, constitutes a viable therapeutic delivery system in its present form. The main limiting factor for practical applications in drug delivery system will be the short shelf-life of the PLNs as a single reagent particularly as the interaction between peptide and liposomes is reversible. However, given that such nanoparticles appear to respond close to patho-physiological conditions, the study does provide incentive to develop better formulation strategies in the future.The recent work by Huang et al. (2013) assures some degree of success for using PLNs in vivo. These authors used a melittin analogue in combination with lipid nanoparticles to achieve efficacy against melanoma in tumour bearing mice.44 The interest in using peptides to render liposomes bio-responsive is rekindling. Recently Al-Ahmady et al.40 incorporated a leucine zipper type peptide into temperature sensitive liposomes as a means to fine tune the release of encapsulated doxorubicin in response to mild hyperthermia. The onset of such triggered release was linked to the unfolding of peptide's helix structure. New perspectives, such as the recent work of Lin et al.27 highlighting the possibility of multifunctional self-assembled nanoparticles in which the fate of liposomes and GALA peptide are coupled as one through double acyl chains and a study by Etzerodt et al.28 demonstrating that dimyristoyl GALA peptide can be incorporated into the lipid bilayer during liposome preparation, are providing additional design considerations for potentially more stable pH-sensitive PLNs in the future.
Acknowledgements
We thank Dr David Gough and Dr Robert Bonser for constructive discussions and Vectura Ltd for financial support. This work was also supported by BBSRC studentship (BBS/S/M/2004/11418) to Dr Shaun Offerman. We are also grateful to Professor Gillian Tozer and Professor Mark Dewhirst for assistance in establishing the mouse dorsal window chamber model, and to the Experimental Oncology Group at Manchester University for providing KHT and RIF-1 tumor cell lines.Notes and references
- M. Stubbs, P. M. J. McSheehy, J. R. Griffiths and C. L. Bashford, Mol. Med. Today, 2000, 6, 15–19 CrossRef CAS PubMed.
- I. F. Tannock and D. Rotin, Cancer Res., 1989, 49, 4373–4384 CAS.
- T. Henning, M. Kraus, M. Brischwein, A. M. Otto and B. Wolf, Anti-Cancer Drugs, 2004, 15(1), 7–14 CrossRef CAS PubMed.
- T. Kaasgaard and T. L. Andresen, Expert Opin. Drug Delivery, 2010, 7(2), 225–243 CrossRef CAS PubMed.
- E. S. Lee, Z. Gao and Y. H. Bae, J. Controlled Release, 2008, 132(3), 164–170 CrossRef CAS PubMed.
- T. Ta and T. M. Porter, J. Controlled Release, 2013, 169(1–2), 112–125 CrossRef CAS PubMed.
- D. C. Drummond, M. Zignani and J. Leroux, Prog. Lipid Res., 2000, 39, 409–460 CrossRef CAS PubMed.
- P. Meers, Adv. Drug Delivery Rev., 2001, 53, 265–272 CrossRef CAS PubMed.
- T. L. Andresen, S. S. Jensen and K. Jógensen, Prog. Lipid Res., 2005, 44, 68–97 CrossRef CAS PubMed.
- F. Yuan, M. Leunig, S. Huang, D. Berk, D. Papahadjopoulos and R. Jain, Cancer Res., 1994, 54, 3352–3356 CAS.
- S. K. Huang, K. D. Lee, K. Hong, D. S. Friend and D. Papahadjopoulos, Cancer Res., 1992, 52, 5135–5143 CAS.
- D. Lasic and D. Papahadjopoulos, Medical Applications of Liposomes, Elsevier Science, New York, NY, 1998 Search PubMed.
- M. J. Parr, D. Masin, P. R. Cullis and M. B. Bally, J. Pharmacol. Exp. Ther., 1997, 280, 1319–1327 CAS.
- W. C. Zamboni, A. C. Gervais, M. J. Egorin, J. H. Schellens, E. G. Zuhowski, D. Pluim, E. Joseph, D. R. Hamburger, P. K. Working, G. Colbern, M. E. Tonda, D. M. Potter and J. L. Eiseman, Cancer Chemother. Pharmacol., 2004, 53, 329–336 CrossRef CAS PubMed.
- W. Li, F. Nicol and F. C. Szoka, Jr, Adv. Drug Delivery Rev., 2004, 56, 967–985 CrossRef CAS PubMed.
- A. Kuin, L. Smets, T. Volk, A. Paans, G. Adams, A. Atema, E. Jahde, A. Maas, M. F. Rajewsky, G. Visser and B. Wood, Cancer Res., 1994, 54, 3785–3792 CAS.
- R. A. Parente, S. Nir and F. C. Szoka, Jr, Biochemistry, 1990, 29, 8720–8728 CrossRef CAS PubMed.
- M. J. Turk, J. A. Reddy, J. A. Chmielewski and P. S. Low, Biochim. Biophys. Acta, Biomembr., 2002, 1559, 56–68 CrossRef CAS.
- T. Kakudo, S. Chaki, S. Futaki, I. Nakase, K. Akaji, T. Kawakami, K. Maruyama, H. Kamiya and H. Harashima, Biochemistry, 2004, 43, 5618–5628 CrossRef CAS PubMed.
- C. Puyal, L. Maurin, G. Miquel, A. Bienvenue and J. Philippot, Biochim. Biophys. Acta, Biomembr., 1994, 1195, 259–266 CrossRef.
- H. S. Aojula, S. Offerman, R. R. Aojula, A. P. Hutchinson, S. Nicklin and D. J. Clarke, Biochim. Biophys. Acta, Biomembr., 2002, 1564, 73–81 CrossRef CAS.
- J. C. Stewart, Anal. Biochem., 1980, 104, 10–14 CrossRef CAS PubMed.
- Y. H. Chen, J. T. Yang and H. M. Martíez, Biochemistry, 1972, 11, 4120–4131 CrossRef CAS PubMed.
- D. A. Berk, F. Yuan, M. Leunig and R. K. Jain, Proc. Natl. Acad. Sci. U. S. A., 1997, 94(5), 1785–1790 CrossRef CAS.
- M. H. Gaber, N. Z. Wu, K. Hong, S. K. Huang, M. W. Dewhirst and D. Papahadjopoulos, Int. J. Radiat. Oncol., Biol., Phys., 1996, 36, 1177–1187 CrossRef CAS.
- K. Djanashvili, T. L. M. ten Hagen, R. Blangé, D. Schipper, J. A. Peters and G. A. Koning, Bioorg. Med. Chem., 2011, 19, 1123–1130 CrossRef CAS PubMed.
- B. F. Lin, D. Missirlis, D. V. Krogstad and M. Tirrell, Biochemistry, 2012, 51(23), 4658–4668 CrossRef CAS PubMed.
- T. P. Etzerodt, S. Trier, J. R. Henriksen and T. L. Andresen, Soft Matter, 2012, 8(21), 5933–5939 RSC.
- V. Munoz and L. Serrano, J. Mol. Biol., 1995, 245(3), 297–308 CrossRef CAS PubMed.
- N. K. Subbarao, R. A. Parente, F. C. Szoka, Jr, L. Nadasdi and K. Pongracz, Biochemistry, 1987, 26, 2964–2972 CrossRef CAS PubMed.
- R. A. Parente, S. Nir and F. C. Szoka, J. Biol. Chem., 1988, 263, 4724–4730 CAS.
- O. Ishida, K. Maruyama, K. Sasaki and M. Iwatsuru, Int. J. Pharm., 1999, 190, 49–56 CrossRef CAS PubMed.
- A. Nagayasu, K. Uchiyama and K. Kiwada, Adv. Drug Delivery Rev., 1999, 40, 75–87 CrossRef CAS PubMed.
- S. J. Lunt, C. Cawthorne, M. Ali, B. A. Telfer, M. Babur and A. Smigova, et al. , Br. J. Cancer, 2010, 103, 201–208 CrossRef CAS PubMed.
- T. Kalliomäki and R. P. Hill, Br. J. Cancer, 2004, 90, 1842–1849 Search PubMed.
- D. B. S. Pink, W. Schulte, M. H. Parseghian, A. Zijlstra and J. D. Lewis, PLoS One, 2012, 7, e33760, DOI:10.1371/journal.pone.0033760.
- S. Shan, C. Flowers, C. D. Peltz, H. Sweet, N. Maurer, E. J. Kwon, A. Krol, F. Yuan and M. W. Dewhirst, Cancer Chemother. Pharmacol., 2006, 58, 245–255 CrossRef CAS PubMed.
- L. E. Gerweck and K. Seetharaman, Cancer Res., 1996, 56, 1194–1197 CAS.
- G. Helmlinger, F. Yuan, M. Dellian and R. K. Jain, Nat. Med., 1997, 3, 177–182 CrossRef CAS PubMed.
- Z. S. Al-Ahmady, W. T. Al-Jamal, J. V. Bossche, T. T. Bui, A. F. Drake, A. J. Mason and K. Kostarelos, ACS Nano, 2012, 6, 9335–9346 CrossRef CAS PubMed.
- F. Nicol, S. Nir and F. C. Szoka, Biophys. J., 1996, 71, 3288–3301 CrossRef CAS PubMed.
- C. N. Pace, G. R. Grimsley and J. M. Scholtz, J. Biol. Chem., 2009, 284, 13285–13289 CrossRef CAS PubMed.
- V. Iacobucci, F. D. Giuseppe, T. T. Bui, L. S. Vermeer, J. Patel, D. Scherman, A. Kichler, A. F. Drake and A. J. Mason, Biochim. Biophys. Acta, Biomembr., 2012, 1818, 1332–1341 CrossRef CAS PubMed.
- C. Huang, H. Jin, Y. Qian, S. Qi, H. Luo, Q. Luo and Z. Zhang, ACS Nano, 2013, 7, 5791–5800 CrossRef CAS PubMed.
| This journal is © The Royal Society of Chemistry 2014 |


