Hydrotreatment of lignocellulosic biomass derived oil using a sulfided NiMo/γ-Al2O3 catalyst
Yun
Wang
,
Hongfei
Lin
and
Ying
Zheng
*
Department of Chemical Engineering, Faculty of Engineering, University of New Brunswick, Bailey Drive, Fredericton, New Brunswick E3B 9P8, Canada
First published on 17th September 2013
Abstract
Bio-oils derived from lignocellulosic materials have poor properties for use as fuels and cannot be blended with transportation fuels. Hydrotreating is an effective method for eliminating contaminants and saturating double bonds. This article is one of the few that report the hydrotreatment of a biomass-derived oil over a sulfided NiMo/γ-Al2O3 catalyst and the deactivation of the catalyst. The results confirm that hydrotreatment is an effective technology for improving the quality of bio-oil. The total acid number of the upgraded bio-oil decreased from 23 mg KOH g−1 (raw bio-oil) to 2 mg KOH g−1. Oxygenated functional groups are removed, light liquid products are generated and carbon double bonds are saturated. The catalyst can become deactivated at a high operating temperature due to severe coke deposition. The deactivated catalyst was studied by using multiple analytical methods such as TEM, XRD, BET and TPO to study the deactivation pathways.
1. Introduction
Bio-oils derived from lignocellulosic materials are promising second-generation biofuels. Unfortunately, these bio-oils do not have the properties needed to be good transportation fuels. In particular, liquefied bio-oils have a relatively high oxygen content and low energy density in addition to their high viscosity and corrosiveness. Consequently, the direct application of these bio-oils in internal combustion engines is limited. Upgrading of these bio-oils is normally required for their use in most applications. Widely applied upgrading technologies include hydrotreating1,2 catalytic cracking of pyrolysis vapors,3 emulsification,4,5 steam reforming,6,7 extracting chemicals, esterification,8etc. Among these, attention has been paid to the catalytic hydrotreating of bio-oils. Typically, severe conditions (200–400 °C, 1450–2900 psi H2 pressure) are required to obtain reasonable volumetric production rates9,10 in this process. Under such conditions, multiple reactions occur, including hydrogenolysis, hydrogenation, hydrodeoxygenation, decarboxylation, decarbonylation and hydrocracking. Condensation and polymerization are side reactions that can lead to the formation of coke.Efforts have been made towards the hydrotreatment of biomass-derived oil using model compounds and real bio-oils.11 Early studies were carried out in batch reactors.1,12,13 Conventional transition metal catalysts, such as sulfided CoMo, NiMo, and WNi have been used most extensively while noble metal catalysts received less attention.14 Wildschut et al.15 carried out the hydrotreatment of a fast pyrolysis oil with a heterogeneous noble-metal catalyst under both mild (250 °C, 1450 psi) and severe conditions (350 °C, 2900 psi). Under mild conditions, 45–79 wt% of oxygen reduction was obtained while, under severe conditions, a higher oxygen reduction rate was achieved. 90 wt% of oxygen in the raw bio-oil was removed and Ru/C was reported to be the most promising catalyst to use for further testing.
Experimental studies either in a batch reactor14,15 or in continuous fixed bed reactors have been reported.16–18 Studies on the hydrotreatment of bio-oils have focused on obtaining a high-yield of hydrocarbons and the oxygen reduction rate.19 Elliott and Baker20 developed a two-stage hydroprocessing configuration to avoid excessive coking. In this process, the first reactor was operated at a low temperature (280 °C) and low LHSV (liquid hourly space velocity) to stabilize the oil by hydrotreating the most reactive compounds. The following deep deoxygenation step was performed in the second reactor at a higher temperature (350 °C) and higher LHSV. The continuous operation resulted in oil yields between 30–55% and deoxygenation rates of up to 99%.19 However, the reaction pathways of deoxygenation and catalyst deactivation are not well understood. The majority of the few mechanistic studies of hydrodeoxygenation were carried out on model compounds. Almost no work has been carried out to understand the reaction mechanisms of real biomass-derived bio-oils. On the other hand, despite the quick deactivation of the catalysts, caused by coke formation, and a high water partial pressure being observed,21–23 almost no research work has been published on catalyst deactivation.
This work not only reports the production of high-value hydrocarbons from a liquefaction derived bio-oil, but it also aims to understand the conversion routes of the major oxygenated compounds in bio-oil through GC–MS analysis. The deactivation of the catalyst during the hydrotreating process was another focus of this work. The deactivated catalyst was studied using multiple analytical methods.
2. Experimental
2.1 Materials
Diluted liquefied bio-oil, at the bio-oil to 1-methylnaphthalene ratio of 1![[thin space (1/6-em)]](https://www.rsc.org/images/entities/char_2009.gif) :
:![[thin space (1/6-em)]](https://www.rsc.org/images/entities/char_2009.gif) 9, was used as the feed. The raw bio-oil was generated by liquefying pinewood sawdust using acetone as the solvent.24 A summary of the properties of the bio-oils obtained previously from the liquefaction of pinewood sawdust are listed in Table 1. It can be seen that these liquefied bio-oils have a high oxygen content and low energy density in addition to their high viscosity and corrosiveness.
9, was used as the feed. The raw bio-oil was generated by liquefying pinewood sawdust using acetone as the solvent.24 A summary of the properties of the bio-oils obtained previously from the liquefaction of pinewood sawdust are listed in Table 1. It can be seen that these liquefied bio-oils have a high oxygen content and low energy density in addition to their high viscosity and corrosiveness.
| Properties | Value | |
|---|---|---|
| Oxygen content (wt%) | 10–20 | |
| O/C molar ratio | 0.1–0.2 | |
| H/C molar ratio | 1.2–1.4 | |
| Sulfur content | Undetectable | |
| Total acid number, TAN (mg KOH g−1) | 20–80 | |
| Heating value (MJ kg−1) | 33–37 | |
| Moisture content (ppm) | <100 | |
| Boiling point, BP | <193 °C | 17 wt% |
| 193–343 °C | 28 wt% | |
| 343–538 °C | 15 wt% | |
| >538 °C | 40 wt% | |
NiMo/γ-Al2O3 synthesized following the method described previously25 was employed as the hydrotreating catalyst and was sulfided in situ before the hydrotreatment process. The chemicals used in this study are as follows: 1-methylnaphthalene (A. C. S. reagent, >95%), dimethyl disulfide (DMDS) (A. C. S. reagent, >99%), n-heptane (anhydrous, >99%), carbon disulfide (HPLC grade, ≥99.99%) and acetone (A. C. S. reagent, ≥99.5%). All of the chemicals were purchased from Sigma-Aldrich and were used as received.
2.2 Hydrotreating procedure
The hydrotreating process was performed in a fixed bed micro-reactor (Autoclave Engineers Inc.) and a simplified schematic is shown in Fig. 1. 3 mL NiMo/γ-Al2O3 catalyst with a particle size of 380–830 μm (in diameter) was diluted with 3 mL quartz sand 400 μm in diameter. The diluted catalyst was then loaded to a cylindrical reactor with an internal diameter of 36.5 mm. A thermocouple was placed in the middle of the reactor for measurement of the operating temperature. The two ends of the reactor were filled with glass wool.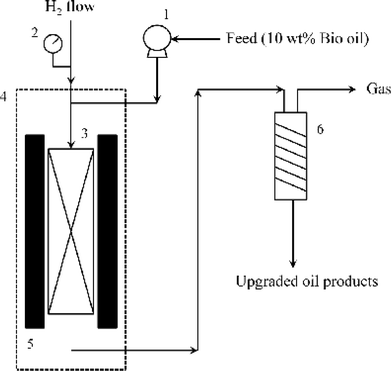 | ||
| Fig. 1 Schematic diagram of the hydrotreating process (1 – feed pump; 2 – pressure gauge; 3 – reactor; 4 – oven; 5 – heater; 6 – condenser). | ||
The catalyst was presulfided before hydrotreating was carried out. The presulfiding procedure is as follows. The catalyst was first dried in a continuous H2 flow (100 mL min−1) at 120 °C for 2 hours. 3.7 wt% DMDS in n-heptane was used as the sulfidation solvent and introduced at a 2.0 h−1 LHSV. The catalyst was presulfided at 320 °C and H2 at 220 psi, 100 mL min−1 for 2 hours and the presulfiding was continued for another 2 hours at 360 °C. After the sulfidation, the catalyst was stabilized using 1-methylnaphthalene with an LHSV of 1.0 h−1 at 300 °C and H2 at 1000 psi, 100 mL min−1 for 48 hours. Then the hydrotreating process was performed at various temperatures and with 100 mL min−1 H2 at various H2 pressures. Each set of experimental conditions were maintained for at least 24 hours.
In this study, the feed oil is a mixture of 90 wt% 1-methylnaphthalene and 10 wt% raw bio-oil (from liquefaction), and certainly the upgraded bio-oil products also contain certain amounts of hydrotreated 1-methylnaphthalene. Therefore, in the following text, the phrase “feed oil” refers to the mixture of 1-methylnaphthalene and raw bio-oil; the phrase “raw bio-oil” refers to the pure bio-oil derived from liquefaction (before mixing with 1-methylnaphthalene); the phrase “hydrotreated liquid products” refers to the liquid mixture of upgraded bio-oil and hydrotreated 1-methylnaphthalene derived from hydrotreating; and the phrase “upgraded bio-oil” refers to the pure upgraded bio-oil without hydrotreated 1-methylnaphthalene.
2.3 Analytical procedure
The total acid numbers (TANs) of the raw bio-oil and upgraded bio-oils were tested by using a Potentiometric Titrimeter (ZD-2A, Saegmoter Co. Ltd., Shanghai, China) following the ASTM standard test method D664-01. The oil sample was dissolved in a mixture of toluene and 2-propanol containing a small amount of water, and titrated with 0.1 mol L−1 alcoholic potassium hydroxide using a glass indicating electrode and a calomel reference electrode. The meter readings were plotted manually against the respective volumes of the titrating solution and the end points were recorded and the acidity was calculated from meter readings of a freshly prepared non-aqueous basic buffer solution. The acid conversion in the upgraded bio-oils presented in Table 2 was calculated through the following equation: | (1) |
The raw and upgraded bio-oil samples were analyzed using a Vario Microcube elemental analyzer (Elementar Americas, Mt. Laurel, N. J.), a gas chromatograph (Shimadzu GC-17A) and a mass spectrometer (Shimadzu MS-QP5000), equipped with an Agilent HP-5MS column (5% phenyl methyl siloxane, 30 m × 0.25 mm × 0.25 μm). The temperature program used was as follows: 80 °C (hold for 2 min) → 165 °C (10 °C min−1, hold for 3 min) → 300 °C (10 °C min−1, hold for 6 min), injection at 305 °C, detector working at 320 °C. After a 2 minute solvent delay, full scan mass spectra were acquired from 50 to 500 m/z. The identification of the peaks was based on the mass spectra from the NIST (National Institute of Standards and Technology) 1998 library.
| Experiment | ||||||||
|---|---|---|---|---|---|---|---|---|
| 1 | 2 | 3 | 4 | 5 | 6 | 7 | 8 | |
| a The TAN of raw bio-oil was 23.2 mg KOH g−1. b Calculated using eqn (1). | ||||||||
| Operation time (hours) | 48–72 | 72–96 | 96–120 | 120–144 | 144–168 | 168–192 | 192–216 | 216–240 |
| Temperature (°C) | 310 | 280 | 330 | 330 | 330 | 330 | 330 | 350 |
| H2 pressure (psi) | 1400 | 1400 | 1000 | 500 | 1400 | 1400 | 1400 | 1400 |
| LHSV (h−1) | 1 | 1 | 1 | 1 | 1 | 2 | 0.4 | 1 |
| Feed oil flow rate (mL min−1) | 0.05 | 0.05 | 0.05 | 0.05 | 0.05 | 0.1 | 0.02 | 0.05 |
| H2 flow rate (mL min−1) | 100 | 100 | 100 | 100 | 100 | 100 | 100 | 100 |
| S content | Undetectable | |||||||
| TANa (mg KOH g−1) | 4.8 | 8.6 | 4.6 | 3.3 | 3.9 | 7.4 | 2.2 | 3.3 |
| Acid conversionb (%) | 80 | 63 | 80 | 86 | 83 | 68 | 91 | 86 |
| O/C molar ratio (10−3) | 2.23 | 4.06 | 2.18 | 1.56 | 1.85 | 3.50 | 1.04 | 1.56 |
| H/C molar ratio | 1.22 | 1.17 | 1.23 | 1.24 | 1.24 | 1.18 | 1.26 | 1.24 |
A simulated distillation technique was applied to determine the boiling point distributions of the raw bio-oil and upgraded bio-oils. The analysis was performed by using a gas chromatograph (Shimadzu GC-2010), equipped with a MXT-2887 column (100% dimethyl polysiloxane, 10 m × 0.53 mm × 3.0 μm). The temperature program was as follows: 35 °C → 340 °C (20 °C min−1, hold for 5 min), injection at 325 °C, detector working at 360 °C. The oils were measured by the internal standard method following the ASTM standard method D2887. Boiling points are assigned to the time axis from a calibration curve obtained under the same chromatographic conditions by analyzing a standard mixture of hydrocarbons (C6–C44 alkanes) covering the boiling range for petroleum fractions (70–540 °C).
The X-ray diffraction (XRD) patterns of the catalyst were measured using a Bruker D8 Advance spectrometer. Fresh/spent catalyst fines were packed in a circular well covered by a plastic sample holder, which was then placed on the sample stage. The diffractometer was equipped with a two circle (θ and 2θ) goniometer housed in a radiation safety enclosure. The X-ray source was a sealed, 2.4 kW Cu X-ray tube, maintained at an operating current of 40 kV and 30 mA. Samples were scanned in the range of 5–90° 2θ with a step size of 0.02° and a step time of 1.0 s. A peltier-cooled solid-state [Si(Li)] detector (Sol-X) with a useful energy range of 1 to 60 keV was used as the detector. A set of 2° Soller slits was used in order to lower the horizontal beam divergence. For data collection a manually-controlled JOB program that employs a DQL parameter file was used.
The catalyst sample was imaged at 200 keV using a JEOL 2010 STEM. The catalyst powders were sprinkled on a 200 mesh carbon coated copper grid. Chemical analysis was carried out using an EDAX Genesis 4000 spectrometer. Inverse fast Fourier transforms (IFFTs) of the TEM images were analyzed using the software that comes with the TEM device. For the sulfided NiMo catalyst, the average length and number of layers of the slabs were calculated from the measurement of over 300 crystallites with the following equations:
 | (2) |
 | (3) |
The nitrogen adsorption–desorption isotherm (BET) was measured at −77 K on an Autosorb-1 (Quantachrome Instruments, Florida, US). Samples were degassed at 200 °C for 4 hours prior to measurement. The specific surface area of the catalyst powder was calculated using the Brunauer–Emmet–Teller (BET) method. The total pore volume of nitrogen adsorbed at the relative pressure p/p0 0.995. Pore size distribution was analyzed by the Barrett–Joyner–Halenda (BJH) method.
The temperature-programmed oxidation (TPO) analysis was performed on an Autosorb-1 (Quantachrome Instruments, Florida, US). The spent catalyst was washed with toluene and dried in an oven over night. 10 mg of the treated spent catalyst was loaded in a U-shaped quartz tube, which was then installed in a furnace. The catalyst was first exposed to flowing helium (30 mL min−1) and the temperature was raised at a rate of 10 °C min−1 up to 120 °C and kept at this temperature for 20 min. This step was to remove any physisorbed water from the catalyst sample. Subsequently, the catalyst was heated under a flowing gas mixture of 5% oxygen in helium at a rate of 8 °C min−1 up to 500 °C. An analysis of the gaseous burn off products was performed by thermal conductivity and mass spectrometry. The Autosorb instrument and the mass spectrometer were both interfaced to a personal computer for data acquisition.
Pyridine infrared: adsorbed pyridine infrared spectra were recorded on a BIO-RAD FTS-60 spectrometer. 10 mg of the samples were ground, pressed to form wafers (1 cm in diameter) and installed on supports. The sample cell was heated to 573 K under vacuum (10−5 Torr) overnight, cooled down to room temperature, then pyridine was introduced into the cell. Pyridine adsorption was performed and excess and physisorbed pyridine were removed under vacuum at room temperature overnight. Infrared spectra were recorded (1000 cm−1 and 4000 cm−1). The result shows that the acidity of NiMo/γ-Al2O3 is 0.3109 mmol pyridine g−1.
3 Results and discussion
3.1 Upgrading of bio-oils
The feed oil, 10 wt% raw bio-oil in 1-methylnaphthalene, was pumped into a fixed bed reactor and the hydrotreated liquid products were collected for analysis. Table 2 shows the experimental conditions and the TANs of the upgraded liquid bio-oils, where the solvent effect of 1-methylnaphthalene has been eliminated. The hydrotreating process reduced the TANs of the bio-oils from 23 mg KOH g−1 for the raw bio-oil to around 2–8 mg KOH g−1 for the upgraded bio-oils. Approximately 80% of the carboxylic acids of the raw bio-oil were converted. Three pathways including decarboxylation, decarbonylation and hydrodeoxygenation are commonly considered in converting carboxylic acids.Decarboxylation:
| CnH2n+1COOH → CO2 + CnH2n+2 | (4) |
| CnH2n+1COOH → CO + H2O + CnH2n | (5) |
| CnH2n+1COOH + 3H2 → 2H2O + Cn+1H2n+4 | (6) |
The decarboxylation or decarbonylation reactions require no hydrogen gas. With the presence of high pressure H2 gas, the three reactions take place simultaneously in a hydrotreating process. In this study, different temperatures and hydrogen pressures were examined. When the H2 pressure (1400 psi) is kept the same and the temperature is increased from 280 °C to 350 °C (experiment 2, 1, 5, 8), the TANs of the resultant bio-oils were seen to decrease consistently from 8.6 to 3.3 mg KOH g−1. When the temperature is maintained at 330 °C, the TAN of the upgraded bio-oil is observed to increase from 3.9 to 4.8 mg KOH g−1 as H2 pressure decreases from 1400 psi to 1000 psi H2. However, further decreases in H2 pressure result in a significant decrease in the TAN of the bio-oil, instead of the anticipated increase in the TAN. The TAN of the bio-oil reaches 3.3 mg KOH g−1 at 500 psi H2. This may be attributed to the fact that the deoxygenation moves from the dominant hydrodeoxygenation route at a high H2 pressure to decarboxylation and decarbonylation at low H2 pressures as the later reaction routes do not require hydrogen. In addition, the effect of the feed flow rate was also examined and the results are shown in Table 2 (experiment 5, 6, 7). The LHSV of the feed decreases from 2 h−1 to 0.4 h−1 at 330 °C and 1400 psi H2. The TAN of the upgraded bio-oil decreased from 7.4 to 2.2 mg KOH g−1. Demonstrating that a slower flow rate of the feed is better for deoxygenation performance.
Fig. 2 shows the GC–MS spectra of the hydrotreated liquid products and raw bio-oil. The components that correspond to the major peaks in the spectra are listed in Table 3. Ketones, esters, substituted phenols, naphthalene and phenanthrene derivatives dominate in the raw bio-oil. After hydrotreatment, the oxygenated functional groups have been eliminated and larger molecules have been cracked into smaller molecules. The major components in the upgraded bio-oil include alkyl cyclohexane, alkyl benzene and decahydronaphthalene, which are the deoxygenated and saturated products of the main oxygenates found in the raw bio-oil. Moreover, 1-methyldecahydronaphthalene, 1-methyldecalin and naphthalene were detected as shown in Table 3. The 1-methyldecahydronaphthalene and 1-methyldecalin in the upgraded bio-oil are likely to be due to the hydrogenation of 1-methylnaphthalene, and the existence of naphthalene can probably be attributed to the hydrodeoxygenation of naphthol, which could have been generated from the large oxygenates present in the raw bio-oil.26
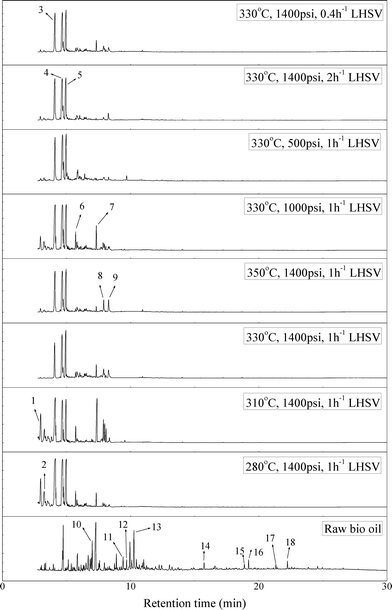 | ||
| Fig. 2 GC–MS spectra of the raw bio-oil and hydrotreated liquid products (with 1-methylnaphthalene eliminated). | ||
The possible hydrogenation pathway of a carbonyl group in bio-oil is a three-step process, which is illustrated in Fig. 3.27 The final products (alkyl benzenes) were detected by GC–MS in this study, while the intermediates (alcohols or alkenes) were not detected. This observation is in agreement with the results reported by Laurent and Delmon.27 They studied the reaction scheme of a carbonyl group catalyzed by sulfided CoMo and NiMo catalysts using 4-methylacetophenone as a model compound and concluded that 4-methylacetophenone was easily converted to ethyl methyl benzene with no intermediate products observed at a temperature higher than 200 °C. The absence of the intermediate alcohols is likely to be due to the poor stability of benzyl alcohol.28 In addition, under hydrotreating conditions, alcohols can be quickly converted to alkenes in the presence of γ-alumina through dehydration reactions.29 Alkene saturation can take place at relatively low temperatures over the sulfided NiMo catalyst. Durand et al.30 reported that a temperature as low as 175 °C is necessary to detect alkenes.
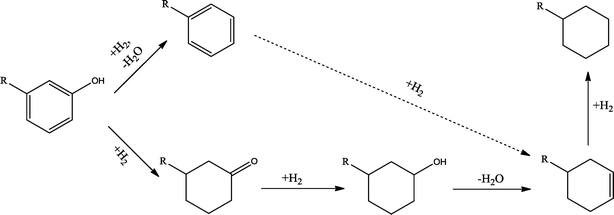
The conversion of hydroxyl groups and methoxyl groups leads to the production of alkyl cyclohexanes and alkyl benzenes as final products. Fig. 4 and Fig. 5 illustrate the reaction schemes for the catalytic hydrotreating of a methoxyl group and hydroxyl group in phenolic compounds, respectively.27,31 The conversion of a methoxyl group in phenol derivatives initially starts with the breaking of an O–methyl bond leading to the production of an alkyl benzenediol.27 The alkyl benzenediol is subsequently converted into an alkyl phenol by the elimination of a hydroxyl group. The alkyl benzene components are produced in a subsequent conversion. The large components in the raw bio-oil can be converted to small intermediates such as phenol derivatives, ketones or cyclohexane hydrocarbons through hydrodeoxygenation or hydrogenation reactions.
It can be seen in Fig. 2 that three alkyl benzene components (peak 3, peak 4, and peak 5) dominate in each of the upgraded bio-oils. And the intensities of these peaks were nearly the same under each set of hydrotreating conditions. From reviewing the hydrodeoxygenation mechanisms of the major components in raw bio-oil, it can be seen that alkyl benzenes can be generated from all of the reactions. Therefore, these compounds are the primary components in upgraded bio-oil. In addition, two alkyl cyclohexane compounds (peak 1 and peak 2) were very evident in the 310 °C and 280 °C samples, which are the least severe conditions. As the hydrotreating temperature further increased to 330 °C and 350 °C, the production of alkyl cyclohexanes was inhibited.
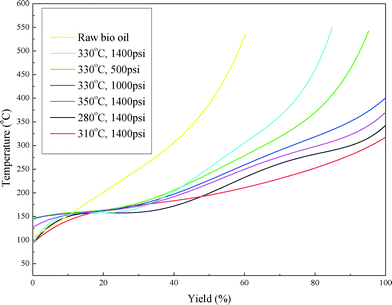
Fig. 6 shows the boiling point distribution of the raw bio-oil and upgraded bio-oils and the summarized results are shown in Table 4. Considering the development of catalyst deactivation, the results are presented in chronological order in Table 4. From Fig. 6, it can be seen that the boiling point distribution curves of all of the upgraded bio-oils shifted to a lower temperature compared with the curve of the raw bio-oil. Table 4 shows that approximately 40 wt% of the raw bio-oil falls in the boiling point range of a vacuum residue (>538 °C), which has been greatly reduced or eliminated in the upgraded bio-oils. The fractions of heavy naphtha (<193 °C), kerosene (193–271 °C), gas oil (271–343 °C) and vacuum gas oil (343–538 °C) are greatly enhanced in the upgraded bio-oils. These results indicate that the raw bio-oil was effectively upgraded to lighter oil products through the hydrotreating process.
| Experimental conditions | Upgraded bio-oils | Raw bio-oil | |||||
|---|---|---|---|---|---|---|---|
| 1 | 2 | 3 | 4 | 5 | 8 | ||
| Temperature (°C) | 310 | 280 | 330 | 330 | 330 | 350 | |
| H2 pressure (psi) | 1400 | 1400 | 1000 | 500 | 1400 | 1400 | |
| LHSV (h−1) | 1 | 1 | 1 | 1 | 1 | 1 | |
| Boiling point distribution | Yields (wt%) | ||||||
| Heavy naphtha (<193 °C) | 39.8 | 48.4 | 36.3 | 35.2 | 38.2 | 38.5 | 17.0 |
| Kerosene (193–271 °C) | 46.7 | 29.1 | 29.8 | 24.2 | 15.5 | 32.5 | 17.0 |
| Gas oil (271–343 °C) | 13.5 | 22.5 | 21.3 | 15.6 | 13.6 | 23.5 | 10.8 |
| Vacuum gas oil (343–538 °C) | 0 | 0 | 12.6 | 20.3 | 17.6 | 5.5 | 15.5 |
| Vacuum residue (>538 °C) | 0 | 0 | 0 | 4.7 | 15.1 | 0 | 39.7 |
It can also be seen from Table 4 that with the first five conditions the boiling point distribution of the upgraded bio-oils shifts from a lower range (<343 °C) to a higher range (343–538 °C) as the hydrotreating process was carried out, regardless of the reaction conditions (temperature and H2 pressure). The catalyst was gradually deactivated by coking with operation time. An increase in temperature can effectively improve the reaction rate and result in a higher conversion rate of the acids. Increasing the temperature is also a common practice in refineries to maintain the quality of upgraded liquid products. When the temperature increased to 350 °C, the yield of kerosene doubled and the vacuum residue (>538 °C) was eliminated.
3.2 Deactivation of NiMo/γ-Al2O3 catalyst—coke deposit
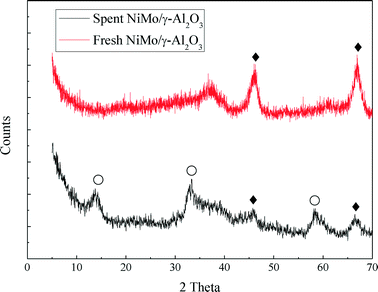
In this work, the hydrotreating process of raw bio-oil was performed continuously for 240 hours in a fixed bed reactor. The spent NiMo/γ-Al2O3 catalyst was collected and characterized by BET, XRD, TEM and TPO analysis in order to study the deactivation of the catalyst.The XRD profiles of the fresh and spent catalyst are shown in Fig. 7. For the fresh catalyst, no detectable XRD diffraction peaks of any MoO3 and NiO species were observed, indicating that they are smaller than 4 nm. MoO3 and NiO are considered to be evenly distributed on the surface of the support. The characteristic diffraction peaks of MoS2 occur for the spent catalyst. The characteristic diffraction peaks of γ-Al2O3 can be seen in both catalysts. But the γ-Al2O3 peaks of the fresh catalyst show a higher intensity than those of the spent catalyst.
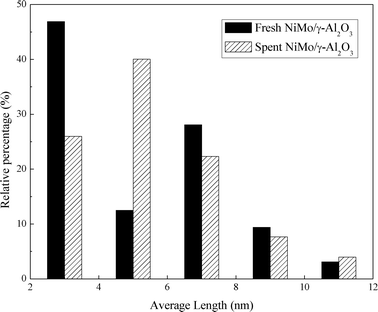
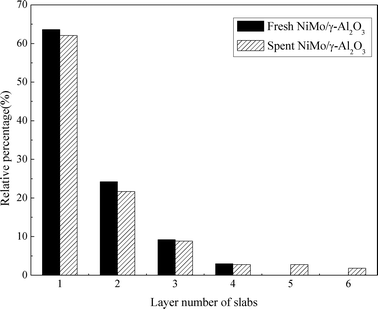
Fig. 8 presents the TEM images of the fresh sulfided and spent catalysts. The sulfided NiMo phases are compared before and after the reaction. There are no obvious changes in the layered structure of the MoS2. The slab length (Fig. 9) and layer number (Fig. 10) distributions are illustrated and the average data are shown in Table 5. A slight increase in the length and layer thickness of the crystalline MoS2 can be observed. Fig. 9 shows a significant evolution of the slabs with sizes between 2–6 nm. The fresh catalyst contains 47% slabs between 2 and 4 nm in length and 28% slabs between 6 and 8 nm; after the hydrotreating process, 26% slabs in the spent catalyst are in the range of 2–4 nm and 40% slabs are between 4 and 6 nm. In addition, a small fraction of very thick slabs (5 or 6 layers), which is not observed in the fresh catalyst, appears in the spent catalyst. This indicates that the active metal phases are slightly sintered after the 240 hours of hydrotreatment. This is expected since hydrodeoxygenation is an extremely exothermic reaction. Overshooting in the local area of the catalysts may occur. However, the slight variation in the sulfide metal phase would not result in complete deactivation of the catalyst.
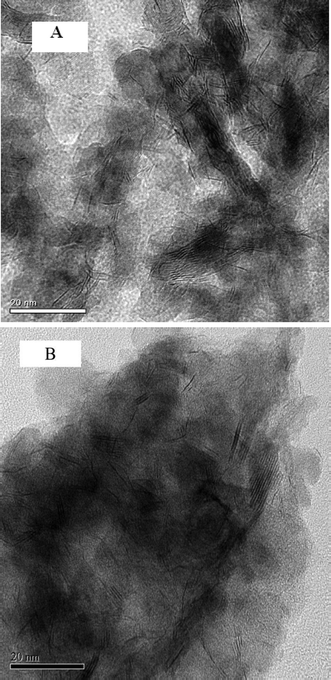 | ||
| Fig. 8 TEM images of (A) the sulfided NiMo/γ-Al2O3 catalyst and (B) the spent NiMo/γ-Al2O3 catalyst (the scale bar in each figure is 20 nm). | ||
| Fresh NiMo/γ-Al2O3 | Spent NiMo/γ-Al2O3 | |
|---|---|---|
| a Calculated from a statistical analysis of the TEM images. b Calculated from the TPO–MS spectra. n. a.: not available | ||
| Pore volume (mL g−1) | 0.69 | 0.17 |
| Surface area (m2 g−1) | 264 | 79 |
| Average pore size (nm) | 10.5 | 8.7 |
| Average length of slabsa (nm) | 5.1 | 5.7 |
| Average number of layersa | 1.5 | 1.7 |
| Carbon contentb (wt%) | n. a. | 21.4 |
Table 5 compares the textural properties of the sulfided and spent NiMo/γ-Al2O3 catalysts. It is noted that the surface area of the NiMo/γ-Al2O3 catalyst has decreased from 264 m2 g−1 to 79 m2 g−1 and the pore volume from 0.69 mL g−1 to 0.17 mL g−1. The average pore size of the catalyst has reduced from 10.5 nm to 8.7 nm. An IFFT pattern of the TEM image (Fig. 11) visually provides evidence for the pore structure of the spent NiMo/γ-Al2O3 catalyst. Most of the pores are severely blocked by coke in the spent catalyst. The accumulated coke deposition can be as high as 21.4 wt%, which results in significant decreases in the surface area and pore volume of the catalyst. This finding suggests that coke deposition is the main cause of catalyst deactivation in the hydrotreating process of bio-oils.
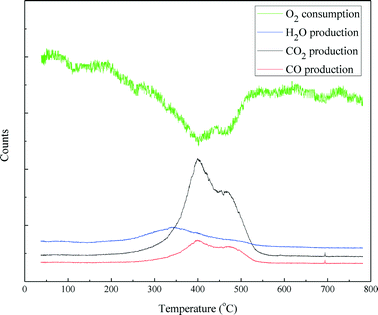
Temperature programmed oxidization (TPO) incorporated with mass spectrometry was carried out to examine the coke disposition of the spent catalyst and the results are shown in Fig. 12. Oxygen consumption was almost mirrored by the formation of CO2 and CO. The CO2 and CO production profiles are similar. Both comprised of three distinct features: a sharp peak around 400 °C, a broad peak around 470 °C and a small peak between 690 and 700 °C, respectively. This indicates that the carbonaceous deposit on the catalyst has a complex structure with different components, which could be burnt at different temperatures. The H2O production profile exhibited a broad peak starting at 220 °C and ending at 550 °C. The H2O peak occurs before the CO2 and CO peaks. This indicates that the carbonaceous species on the catalyst that were burnt at high temperatures were poorly hydrogenated. Furthermore, in terms of peak area, the carbon content burnt off of the spent NiMo/γ-Al2O3 catalyst was 21.4% (w/w).
4. Conclusions
In this work, the hydrotreating of biomass derived bio-oils was performed in a continuous fixed bed. The raw bio-oil was effectively upgraded over a sulfided NiMo/γ-Al2O3 catalyst. The total acid number of the upgraded bio-oil decreased from 23 mg KOH g−1 (raw bio-oil) to 2–8 mg KOH g−1, indicating the removal of carboxylic acids. A high temperature and low LHSV favor the production of high quality bio-oils with a low acid number. From the GC–MS analysis, it is noted that the hydrodeoxygenation and hydrogenation reactions are observed in the upgrading process. Oxygenated functional groups are removed, light products are generated and C![[double bond, length as m-dash]](https://www.rsc.org/images/entities/char_e001.gif) C are saturated. The boiling point distributions of raw bio-oil and upgraded liquid products confirmed the aforementioned reactions.
C are saturated. The boiling point distributions of raw bio-oil and upgraded liquid products confirmed the aforementioned reactions.
The deactivation of the hydrotreating catalyst NiMo/γ-Al2O3 was also studied. The catalyst was deactivated after 240 hours of operation. The surface area and pore volume were greatly reduced due to coke deposition, which is evidenced by an IFFT TEM image. The TEM analysis of the fresh and spent catalysts revealed that the length and layer number of the MoS2 slabs were only slightly altered. Coke deposition might be one of the root causes of the catalyst deactivation at the studied operating conditions. The TPO–MS technique has been used to characterize the coke deposition. The results showed that the carbonaceous deposit burnt off at different temperatures ranging from 300 to 700 °C, showing its complex nature. The burning of coke species at higher temperatures indicates that the coke is poorly hydrogenated.
Abbreviations
| ASTM | American Society for Testing and Materials |
| BET | Brunauer–Emmett–Teller theory |
| DMDS | Dimethyl Disulfide |
| GC–MS | Gas Chromatography–Mass Spectrometry |
| IFFT | Inverse Fast Fourier Transform |
| LHSV | Liquid Hourly Space Velocity |
| TAN | Total Acid Number |
| TEM | Transmission Electron Microscopy |
| TPO | Temperature Programmed Oxidation |
| XRD | X-Ray Diffraction |
Acknowledgements
The authors are thankful to the National Science and Engineering Research Council of Canada (NSERC), Canada Foundation for Innovation (CFI) and Atlantic Innovation Fund (AIF) for financial support to carry out this work.References
- S. P. Zhang, Y. J. Yan and Z. W. Ren, Study of Hydrodeoxygenation of Bio-Oil from the Fast Pyrolysis of Biomass, Energy Sources, 2003, 25(1), 57–65 CrossRef.
- O. İ. Şenol, T. R. Viljava and A. O. I. Krause, Hydrodeoxygenation of Methyl Esters on Sulphided NiMo/γ-Al2O3 and CoMo/γ-Al2O3 Catalysts, Catal. Today, 2005, 100(3–4), 331–335 CrossRef PubMed.
- M. I. Nokkosmäki, E. T. Kuoppala and E. A. Leppämäki, Catalytic Conversion of Biomass Pyrolysis Vapours with Zinc Oxide, J. Anal. Appl. Pyrolysis, 2000, 55(1), 119–131 CrossRef.
- D. Chiaramonti, M. Bonini and E. Fratini, Development of Emulsions from Biomass Pyrolysis Liquid and Diesel and their use in engines—Part 1 : Emulsion Production, Biomass Bioenergy, 2003, 25(1), 85–99 CrossRef CAS.
- D. Chiaramonti, M. Bonini and E. Fratini, Development of Emulsions from Biomass Pyrolysis Liquid and Diesel and their use in engines—Part 2: Tests in Diesel Engines, Biomass Bioenergy, 2003, 25(1), 101–111 CrossRef CAS.
- D. Wang, S. Czernik and D. Montané, Biomass to Hydrogen Via Fast Pyrolysis and Catalytic Steam Reforming of the Pyrolysis Oil Or its Fractions, Ind. Eng. Chem. Res., 1997, 36(5), 1507–1518 CrossRef CAS.
- D. Wang, S. Czernik and E. Chornet, Production of Hydrogen from Biomass by Catalytic Steam Reforming of Fast Pyrolysis Oils, Energy Fuels, 1998, 12(1), 19–24 CrossRef CAS.
- Q. Zhang, J. Chang and T. J. Wang, Upgrading Bio-Oil Over Different Solid Catalysts, Energy Fuels, 2006, 20(6), 2717–2720 CrossRef CAS.
- D. C. Elliott and G. F. Schiefelbein, Liquid Hydrocarbon Fuels From Biomass, Prepr. Pap. – Am. Chem. Soc., Div. Fuel Chem., 1989, 34, 1160–1166 CAS.
- P. Grange, E. Laurent and R. Maggi, Hydrotreatment of Pyrolysis Oils from Biomass: Reactivity of the various Categories of Oxygenated Compounds and Preliminary Techno-Economical Study, Catal. Today, 1996, 29(1–4), 297–301 CrossRef CAS.
- D. C. Elliott, Historical Developments in Hydroprocessing Bio-Oils, Energy Fuels, 2007, 21(3), 1792–1815 CrossRef CAS.
- J. Gagnon and S. Kaliaguine, Catalytic Hydrotreatment of Vacuum Pyrolysis Oils from Wood, Ind. Eng. Chem. Res., 1988, 27(10), 1783–1788 CrossRef CAS.
- İ. S. Osman, Hydrodeoxygenation of aliphatic and aromatic oxygenates on sulphided catalyst for production of second generation biofuels, Helsinki University of Technology, Helsinki, Finland, 2003 Search PubMed.
- J. A. Melero, Jose Iglesias and A. Garcia, Biomass as renewable feedstock in standard refinery units. Feasibility, opportunities and challenges, Energy Environ. Sci., 2012, 5, 7393–7420 CAS.
- J. Wildschut, F. H. Mahfud and R. H. Venderbosch, Hydrotreatment of Fast Pyrolysis Oil using Heterogeneous Noble-Metal Catalysts, Ind. Eng. Chem. Res., 2009, 48(23), 10324–10334 CrossRef CAS.
- R. J. French, J. Stunkel and R. M. Baldwin, Mild Hydrotreating of Bio-Oil: Effect of Reaction Severity and Fate of Oxygenated Species, Energy Fuels, 2011, 25(7), 3266–3274 CrossRef CAS.
- B. Donnis, R. G. Egeberg and P. Blom, Hydroprocessing of Bio-Oils and Oxygenates to Hydrocarbons. Understanding the Reaction Routes, Top. Catal., 2009, 52(3), 229–240 CrossRef CAS.
- D. C. Elliott, T. R. Hart and G. G. Neuenschwander, Catalytic Hydroprocessing of Biomass Fast Pyrolysis Bio-Oil to Produce Hydrocarbon Products, Environ. Prog. Sustainable Energy, 2009, 28(3), 441–449 CrossRef CAS.
- W. Baldauf, U. Balfanz and M. Rupp, Upgrading of Flash Pyrolysis Oil and Utilization in Refineries, Biomass Bioenergy, 1994, 7(1–6), 237–244 CrossRef CAS.
- D. C. Elliott and E. G. Baker, Upgrading Biomass Liquefaction Products through Hydrodeoxygenation, Biotechnol. Bioeng. Symp., 1984, 159–174 CAS.
- M. C. Samolada, W. Baldauf and I. A. Vasalos, Production of a Bio-Gasoline by Upgrading Biomass Flash Pyrolysis Liquids Via Hydrogen Processing and Catalytic Cracking, Fuel, 1998, 77(14), 1667–1675 CrossRef CAS.
- O. I. Senol, T. R. Viljava and A. O. I. Krause, Hydrodeoxygenation of aliphatic esters on sulphided NiMo/g-Al2O3 and CoMo/g-Al2O3 catalyst: The effect of water, Catal. Today, 2005, 106(1–4), 186–189 CrossRef CAS PubMed.
- E. Laurent and B. Delmon, Influence of water in the deactivation of a sulfided NiMo Gamma-Al2O3 Catalyst during deoxygenation, J. Catal., 1994, 146(1), 281–291 CrossRef CAS.
- Y. Wang, H. Wang, H. Lin, A. Pelletier, Y. Zheng and K. Li, Liquefaction of Pinewood in Supercritical Carbon Dioxide (SCCO2), Curr. Org. Chem., 2013, 17(15), 1596–1603 CrossRef CAS.
- S. D. Yao, Y. Zheng, L. Ding, S. Ng and H. Yang, Co-Promotion of Fluorine and Boron on NiMo/Al2O3 for Hydrotreating Light Cycle Oil, Catal. Sci. Technol., 2012, 2, 1925–1932 CAS.
- C. L. Li, Z. R. Xu and Z. A. Cao, Hydrodeoxygenation of 1-Naphthol Catalyzed by Sulfided Ni-Mo/gamma-Al2O3: Reaction Network, AIChE J., 1985, 31(1), 170–174 CrossRef CAS.
- E. Laurent and B. Delmon, Study of the Hydrodeoxygenation of Carbonyl, Carboxylic and Guaiacyl Groups over Sulfided CoMo/γ-Al2O3 and NiMo/γ-Al2O3 Catalysts. I. Catalytic Reaction Schemes, Appl. Catal., A, 1994, 109(1), 77–96 CrossRef CAS.
- O. Weisser and S. Landa, Sulphide catalysts, their properties and applications, Pergamon, Oxford, 1973 Search PubMed.
- B. S. Gevert, J. E. Otterstedt and F. E. Massoth, Kinetics of the HDO of Methyl-Substituted Phenols, Appl. Catal., 1987, 31(1), 119–131 CrossRef CAS.
- R. Durand, P. Geneste and C. Moreau, Heterogeneous Hydrodeoxygenation of Ketones and Alcohols on Sulfided NiOMoO3/γ-Al2O3 Catalyst, J. Catal., 1984, 90(1), 147–149 CrossRef CAS.
- O. İ. Şenol, Hydrodeoxygenation of aliphatic and aromatic oxygenates on sulphided cataysts for production of 2nd generation biofuels, Helsinki University of Technology, Finland, 2007 Search PubMed.
| This journal is © The Royal Society of Chemistry 2014 |


