Combining magnetic field/temperature dual stimuli to significantly enhance gene transfection of nonviral vectors†
Hongbo
Wang‡
,
Jianhai
Yang‡
,
Yongmao
Li
,
Liang
Sun
and
Wenguang
Liu
*
School of Materials Science and Engineering, Tianjin Key Laboratory of Composite and Functional Materials, Tianjin University, Tianjin 300072, PR China. E-mail: wgliu@tju.edu.cn
First published on 24th October 2012
Abstract
Monodisperse magnetic nanoparticles (MNPs) were prepared through an organic phase process, and the obtained MNPs were capped with poly[2-(2-methoxyethoxy)ethyl methacrylate]-b-poly[2-(dimethylamino)ethyl methacrylate] synthesized by surface-initiated atom transfer radical polymerization (ATRP). The MNPs-polymer brushes exhibited both superparamagnetic and thermoresponsive behaviors, and could condense plasmid DNA into nanocomplexes with a size of 100–120 nm at appropriate complexing ratios. Enhanced gene expression in COS-7 cells and HepG-2 cells was achieved under a magnetic field and variable temperature conditions due to magnetic force-facilitated internalization of nanocomplexes, and temporary cooling-triggered intracellular gene unpacking. Amazingly, combining magnetic field and temperature dual stimuli contributed to a 50–100- and 25–45-fold increase of the transfection efficiency in HepG-2 cells compared to conventional protocol and PEI25k, respectively.
1. Introduction
Nonviral vector-mediated delivery of genetic information into target cells to manipulate their protein expression offers much potential in regenerative medicine and in the treatment of genetic diseases from the point of view of biosafety and large-scale manufacture, which normally afflict viral counterparts. However, in conventional bolus transfection experiments, cells are firstly immobilized at the bottom of a culture plate, and then vector/gene complexes are fed in culture media, where the ferrying of floating nanoparticles toward the target cells is to a large extent a diffusion limited process.1–3 Only a small fraction of nanocomplexes could contact with the cell membrane via this passive diffusion, and the majority of nanoparticles float in the bulk of culture, exclusive of heavy element-containing vectors.4 As a consequence, the transfection efficiency is seriously affected.5,6 To overcome this deficiency, magnetofection, using magnetic forces acting on magnetic vectors, was established.7–14 Under an external magnetic field, the floating magnetic nanoparticles are pulled toward the target cells, and are rapidly sedimented on the cell membranes, contributing to cellular internalization of genes.15 However, we need to note that the currently reported polycation-modified magnetic nanoparticles form overly tight complexes with DNA, which on the one hand are favorable for facilitating cell internalization, endolysosomal escape and protecting DNA from DNase attacking. However, on the other hand, excessive compacting of DNA inhibits gene release from its carrier, conversely affecting the ultimate gene transcription.16,17In order to tune DNA unpacking, our group and other researchers have designed stimuli-responsive polymer vectors which were capable of responding to microenvironmental changes such as temperature, pH, light and redox by varying the macromolecular conformation.18–22 This self-adaptation attribute of smart polymers offers a promising way to address the dilemma of tight packing and dissociation of DNA in one single vector. Among the stimuli-sensitive nonviral vectors, thermoresponsive systems have been shown to improve gene transfection in a variable temperature mode due to temporary cooling-induced unpacking of genes from the carriers.23 However, all the thermoresponsive vectors developed thus far have only exhibited a modest level of transfection enhancement.23–28 Although several important parameters, including variable culture temperature timing, cationic character, hydrophobicity and lower critical solution temperature (LCST) range, have been optimized, the improvement of gene transfection is still marginal. A possible reason is that the low cellular uptake of nanocomplexes is the limitation to further improvement in the transfection efficiency of thermoresponsive vectors. In light of the advantages of magnetic field-induced increased internalization and temperature-tunable gene unpacking, we hypothesize that a nonviral vector integrated with temperature and magnetic responsive functions will demonstrate much higher transfection efficiency.
In this work, we prepared monodisperse magnetic nanoparticles (MNPs) through an organic phase process, and modified the MNPs with poly[2-(2-methoxyethoxy)ethyl methacrylate]-b-poly[2-(dimethylamino)ethyl methacrylate] diblock copolymer brushes which were formed via surface-initiated atomic transfer radical polymerization. The physicochemical properties of the MNPs-polymer brushes/DNA nanocomplexes were investigated and in vitro gene transfection of the MNPs-polymer brushes in COS-7 and HepG-2 cells under a magnetic field and variable temperature conditions were focused on.
2. Materials and methods
2.1. Materials
Phenyl ether (99%), 1,2-hexadecanediol (97%), oleic acid (OA, 90%), oleylamine (>70%), 2-(2-methoxyethoxy)ethyl methacrylate (MEO2MA, 95%), 2-bromo-2-methylpropionyl bromide (98%) and N,N,N′,N′′,N′′-pentamethyldiethylenetriamine (PMDETA, 99%) were obtained from Aldrich Chemical Co. Iron(III) acetylacetonate (Fe(acac)3) was from Strem Chemicals, Inc. Aminopropyltriethoxysilane (APTES, analytical reagent), 2-(dimethylamino)ethyl methacrylate (DMAEMA, 97%), 3-(4,5-dimethyl-2-thiazoyl)-2,5-diphenyl tetrazolium bromide (MTT, 98%) and CuCl (99.999%) were supplied by Alfa Aesar. Plasmid pGL3-control with SV40 promoter and enhancer sequences encoding luciferase was obtained from Promega. pEGFP-C1 encoding a red-shifted variant of wild-type green fluorescent protein (GFP) was purchased from Clontech. The plasmids were amplified in Escherichia coli and purified by the differential precipitation method. All other chemicals were analytical grade. Sintered Nd–Fe–B magnets were purchased from Shanghai Genchang Magnetic Materials Co. Ltd. (Shanghai, China). The dimensions of the cylinder shaped permanent magnet for magnetofection are 18 mm × 10 mm (diameter × height).2.2. Instrumentation and characterization
The FTIR spectra of the samples were measured on a Perkin-Elmer spectrum 100 spectrometer (Perkin-Elmer, America) by the ATR method. Thermal gravimetric analysis (TGA) of the samples was obtained by a Perkin-Elmer Pyris TG/DTA Thermal Analyzer (Perkin-Elmer, America), in N2 atmosphere. The magnetic properties of the samples were measured by a vibrating sample magnetometer (VSM) from LakeShore Ltd.2.3. Synthesis of magnetic iron oxide nanoparticles (MNPs)
Magnetic iron oxide nanoparticles with a specific size were prepared according to the previously reported method.29 Fe(acac)3 (2 mmol), 1,2-hexadecanediol (10 mmol), oleic acid (6 mmol), oleylamine (6 mmol), and phenyl ether (20 mL) were added into a three-mouth flask and magnetically stirred under a N2 atmosphere. The mixture was heated to 200 °C for 30 min, and then heated to reflux at 265 °C for another 30 min under a gentle flow of N2. The black–brown mixture was cooled to room temperature, and was precipitated with ethanol (40 mL) and separated by centrifuging under ambient conditions. The black product was dissolved in n-hexane in the presence of oleic acid (∼0.05 mL) and oleylamine (∼0.05 mL). Then the undispersed residues were removed by centrifugation (6000 rpm, 10 min). The final Fe3O4 nanoparticles were collected by precipitation with ethanol and vacuum drying.2.4. Synthesis of MNPs initiator (MNPs-Br)
APTES-modified MNPs were prepared following the procedures reported previously.30 Briefly, 200 mg of MNPs were dispersed in 50 mL n-hexane by ultrasonic mixing. Then 6 mL APTES was added into the solution with continuous N2 purging for 30 min. The mixture was stirred for 8 h at room temperature. The obtained APTES-modified MNPs were thoroughly washed in turn with ethanol (2 × 30 mL) and dichloromethane (2 × 30 mL) to remove the unreacted APTES. After magnetic separation, the amino-functionalized MNPs (MNPs@NH2) were used to couple the ATRP initiator in terms of the following protocol: 150 mg of MNPs@NH2, 3.0 mL (0.021 mmol) of triethylamine, and 30.0 mL of dried dichloromethane were added into a flask in an ice-water bath and flushed with N2 for 30 min. Then, 2.3 mL (0.018 mmol) of 2-bromoisobutyryl bromide was added dropwise to the mixture. After stirring for 12 h under N2, the MNPs@Br were separated via centrifugation and washed with a water–alcohol solution at pH 4.0 (1![[thin space (1/6-em)]](https://www.rsc.org/images/entities/char_2009.gif) :
:![[thin space (1/6-em)]](https://www.rsc.org/images/entities/char_2009.gif) 1 v/v, pH adjusted with acetic acid), then with a water–alcohol mixture (1
1 v/v, pH adjusted with acetic acid), then with a water–alcohol mixture (1![[thin space (1/6-em)]](https://www.rsc.org/images/entities/char_2009.gif) :
:![[thin space (1/6-em)]](https://www.rsc.org/images/entities/char_2009.gif) 1 v/v), with ethyl ether and finally dried under vacuum at room temperature overnight.
1 v/v), with ethyl ether and finally dried under vacuum at room temperature overnight.
2.5. Preparation of MNPs-polymer brushes
MNPs-polymer brushes were prepared by ATRP. The protocol is as follows: a 6 mL DMSO suspension of MNPs@Br (10 mg) and CuCl (0.1 mmol, 9.9 mg) was added to a clean, dry Schlenk tube. Then the suspension was degassed by three freeze–thaw cycles. MEO2MA (500 mg, 492 μL) and PMDETA (0.1 mmol, 21 μL) dissolved in 2 mL DMSO were injected into the suspension using a syringe. The mixture was further degassed for three freeze–pump–thaw cycles and reacted for 3 h at 65 °C. After that the reaction was frozen and DMAEMA (1500 mg, 1608 μL) dissolved in 1 mL DMSO was injected into the reaction. Then the mixture was degassed for three freeze–thaw cycles again and reacted for 24 h at room temperature. Finally, the reaction mixture was dialyzed (MWCO of 3500) against deionized water for 3 days followed by lyophilization to collect the product (termed as MNPs@PMEO2MA50-PDMAEMA150). Using the same method, MNPs@PDMAEMA150 and MNPs@PMEO2MA50-PDMAEMA50 were synthesized at a weight ratio of 150![[thin space (1/6-em)]](https://www.rsc.org/images/entities/char_2009.gif) :
:![[thin space (1/6-em)]](https://www.rsc.org/images/entities/char_2009.gif) 1 (DMAEMA/MNPs@Br) and at a weight ratio of 50
1 (DMAEMA/MNPs@Br) and at a weight ratio of 50![[thin space (1/6-em)]](https://www.rsc.org/images/entities/char_2009.gif) :
:![[thin space (1/6-em)]](https://www.rsc.org/images/entities/char_2009.gif) 50
50![[thin space (1/6-em)]](https://www.rsc.org/images/entities/char_2009.gif) :
:![[thin space (1/6-em)]](https://www.rsc.org/images/entities/char_2009.gif) 1(DMAEMA/MEO2MA/MNPs@Br), respectively.
1(DMAEMA/MEO2MA/MNPs@Br), respectively.
2.6. Measurement of LCST
MNPs@PMEO2MA-PDMAEMA and MNPs@PDMAEMA were separately dissolved in PBS (pH = 7.4), and the final concentration of the solution was fixed at 0.5 wt%. The optical transmittance of the solution at different temperatures was measured at 500 nm by TU-1810 UV-Vis spectrophotometer (Purkinje) equipped with a circulating water bath. The temperature at which the transmittance changed fastest was set as the LCST of the polymer solution.2.7. Preparation of vector/pDNA complexes
MNPs@PMEO2MA50-PDMAEMA was dissolved in PBS (pH = 7.4). The complexes were formulated at various weight ratios of vector/pDNA by adding the vector of desired concentration to an equal volume of a defined solution. The complexes were vortexed for 10 s and incubated for 30 min at room temperature. It is noted that the complexing ratio was expressed as the weight ratio of polymer/pDNA in the following section.2.8. Gel retardation assay
The MNPs@PMEO2MA50-PDMAEMA complexes with varied weight ratios were prepared as mentioned above. 10 μL of complex solutions were loaded in a well on a 1% agarose gel with EB staining and Tris–acetate (TAE) running buffer at 100 V for 40 min and then the images were captured.2.9. Transmission electron microscopy
The morphology and size of the MNPs were examined by high-resolution transmission electron microscopy (HRTEM) on a Philips Tecnai G2 F20 microscope (Philips, Netherlands) with an accelerating voltage of 200 kV. The samples for HRTEM were made by dropping an aqueous solution onto a 300-mesh copper grid coated with a lacy carbon film.The morphology and size of the MNPs@PMEO2MA50-PDMAEMA/pDNA complexes at the selected weight ratios corresponding to the maximum transfection efficiency were observed by JEOL JEM-100CXII TEM. Briefly, a drop of the complex solution was transferred onto a carbon-coated grid for 5 min and stained with 1.5 wt% phosphotungstic acid. Then the complexes were recorded on films with TEM. The particle size was estimated from the measurement of tens of particles found in a few randomly chosen areas in the TEM images.
2.10. Measurement of particle size and zeta potential
The zeta potential and particle size of the MNPs@PMEO2MA50-PDMAEMA/pDNA complexes at varied weight ratios were measured at room temperature using a Beckman Coulter Zeta analyzer (Delsa™Nano Zeta Potential). The complexes were formulated as mentioned above. The final concentration of pDNA was diluted to 5 μg mL−1 using PBS (pH = 7.4).2.11. Determination of cellular internalization
HepG-2 cells were seeded into two 6-well plates at a density of 4 × 10⁵ cells per well and incubated for 24 h. pGL3-control was labeled with fluorescent dye YOYO-1 according to the following protocol: 1 mmol L−1 YOYO-1 was diluted 100 times with PBS. Then, 1 μg of pDNA was marked using 1 μL YOYO-1 dilution (1 molecule of YOYO-1 per 152 base pairs of pDNA) and incubated for 2 h in a dark place at room temperature. Polymer/marked pDNA complexes were prepared as described above. The medium was refreshed with DMEM containing 10% FBS without antibiotics, and then the complexes containing 4 μg of marked pDNA were added to each well. One group of the plates was immediately placed on the magnets, which were further incubated for 2 h. The other group was incubated for 2 h without application of a magnetic field. After that, the cells were washed three times using PBS to remove the non-internalized complexes and culture medium, and then trypsinized and collected in PBS. The fluorescence intensity of the cells was measured by flow cytometry (FACS Calibur, BD, USA).2.12. In vitro transfection and luciferase assay
COS-7 cells and HepG-2 cells were seeded at a density of 5 × 10⁴ cells per well in 24-well plates and incubated for 24 h at 37 °C, in 5% CO2 humidified atmosphere. Before transfection, the medium in each well was replaced with 450 μL of DMEM containing 10% FBS. MNPs@PMEO2MA50-PDMAEMA/pDNA complexes (50 μL, 1 μg pDNA) at various weight ratios were then added to each well (n = 3 for each complexing ratio). The culture plates were divided into four groups. Group I was incubated at constant temperature without applying the magnet. Group II was incubated at constant temperature with application of the magnet. Group III was incubated with variable temperature but without the magnet. Group IV was incubated with both the magnet and variable temperature.After supplying complexes, the four groups of plates were first incubated for 2 h at 37 °C in 5% CO2. Subsequently, the magnets were removed, and the complexes that were not internalized were pipetted out and replaced with fresh medium. Group I and Group II were further incubated at a constant 37 °C for 46 h. For Group III and Group IV, after incubating at 37 °C for another 19 h, the plates were placed in a biochemical incubator for 3 h at 20 °C without changing any other conditions. Then the transfected cells were reincubated at 37 °C for an additional 24 h. After incubation, the culture medium was removed and the cells were washed with PBS twice. The cells in each well were treated for 15 min with 150 μL of reporter lysis buffer (RLB, Promega), followed by freeze–thaw cycles to ensure complete lysis. The lysate was centrifuged for 3 min at 13![[thin space (1/6-em)]](https://www.rsc.org/images/entities/char_2009.gif) 000 rpm and the supernatant was collected for luminescence measurements. The luminescence of each sample was measured by a 1420 Multilabel counter (Wallac, USA) using the Bright-GloTM luciferase assay system (Promega, USA) according to the manufacturer's protocol. The results were expressed as relative light units (RLU) per milligram of cell protein, and the protein concentration of each well was measured by a BCA protein assay (Pierce, Rockford, IL, USA). 25 kDa branched polyethylenimine (PEI25k) served as a positive control. A PEI25k/pDNA complex with weight ratio of 2
000 rpm and the supernatant was collected for luminescence measurements. The luminescence of each sample was measured by a 1420 Multilabel counter (Wallac, USA) using the Bright-GloTM luciferase assay system (Promega, USA) according to the manufacturer's protocol. The results were expressed as relative light units (RLU) per milligram of cell protein, and the protein concentration of each well was measured by a BCA protein assay (Pierce, Rockford, IL, USA). 25 kDa branched polyethylenimine (PEI25k) served as a positive control. A PEI25k/pDNA complex with weight ratio of 2![[thin space (1/6-em)]](https://www.rsc.org/images/entities/char_2009.gif) :
:![[thin space (1/6-em)]](https://www.rsc.org/images/entities/char_2009.gif) 1 was prepared as the reported protocol.19
1 was prepared as the reported protocol.19
2.13. GFP transfection
To further evaluate the transfection efficiency of MNPs@PMEO2MA-PDMAEMA, pEGFP-C1 plasmid transfection in HepG-2 cells was performed. HepG-2 cells were seeded in 12-well plates at a density of 2 × 10⁵ cells per well. Before transfection, the medium was refreshed with 1.8 mL DMEM containing 10% FBS. 200 μL of complex solution containing 2 μg DNA at various weight ratios were added to each well. The transfection was performed as described in Section 2.12. The fluorescence intensity of the cells was measured by flow cytometry (FACS Calibur, BD, USA). A PEI25k/DNA complex with the weight ratio of 2![[thin space (1/6-em)]](https://www.rsc.org/images/entities/char_2009.gif) :
:![[thin space (1/6-em)]](https://www.rsc.org/images/entities/char_2009.gif) 1 served as a control.
1 served as a control.
2.14. Cytotoxicity assay
HepG-2 cells were seeded in a 96-well plate at 2 × 10⁴ cells per well and incubated for 24 h at 37 °C in 5% CO2 humidified atmosphere. MNPs@PMEO2MA50-PDMAEMA/pDNA complexes at an increasing weight ratio from 6![[thin space (1/6-em)]](https://www.rsc.org/images/entities/char_2009.gif) :
:![[thin space (1/6-em)]](https://www.rsc.org/images/entities/char_2009.gif) 1 to 40
1 to 40![[thin space (1/6-em)]](https://www.rsc.org/images/entities/char_2009.gif) :
:![[thin space (1/6-em)]](https://www.rsc.org/images/entities/char_2009.gif) 1 were added into each well and incubated for 24 h before refreshing the medium with fresh complete medium (200 μL per well). After incubation for another 24 h, 20 μL per well MTT (5 mg mL−1 in PBS) was added to each well, and the plate was further incubated for 4 h. Then, all media were removed and 150 μL per well DMSO was added, followed by shaking for 30 min. The absorbance of each well was measured at 570 nm on a ∑960 plate-reader (Metertech) with pure DMSO as a blank. Non-treated cells (in DMEM) were used as a control and the relative cell viability (mean% ± SD, n = 3) was expressed as ODsample/ODcontrol × 100%.
1 were added into each well and incubated for 24 h before refreshing the medium with fresh complete medium (200 μL per well). After incubation for another 24 h, 20 μL per well MTT (5 mg mL−1 in PBS) was added to each well, and the plate was further incubated for 4 h. Then, all media were removed and 150 μL per well DMSO was added, followed by shaking for 30 min. The absorbance of each well was measured at 570 nm on a ∑960 plate-reader (Metertech) with pure DMSO as a blank. Non-treated cells (in DMEM) were used as a control and the relative cell viability (mean% ± SD, n = 3) was expressed as ODsample/ODcontrol × 100%.
2.15. Statistical analysis
Group data are reported as mean ± SD. For transfection results, a one-way ANOVA with Duncan's post hoc test was used to determine whether data groups differed significantly from each other. Statistical significance was defined as having P < 0.05.3. Results and discussion
3.1. Characterization of MNPs and MNPs@PMEO2MA-PDMAEMA
In this work, monodisperse Fe3O4 magnetic nanoparticles (MNPs) were prepared through the reported organic phase process where Fe(acac)3 reacted with a long-chain alcohol.29 Then APTES-modified MNPs, which were used to immobilize the initiator, were synthesized via the ligand exchange method. After the initiator MNPs@Br was prepared, one step surface-initiated atom-transfer radical polymerization (ATRP) was applied to prepare the MNPs@PMEO2MA-PDMAEMA. PDMAEMA has been widely used as a nonviral vector for gene delivery and its star architecture proves to be efficient in mediating gene delivery.31 Thermoresponsive PMEO2MA is considered to be a promising alternative to poly(N-isopropylacrylamide) due to its in vivo low cytotoxicity.32 The synthetic procedure is illustrated in Scheme 1.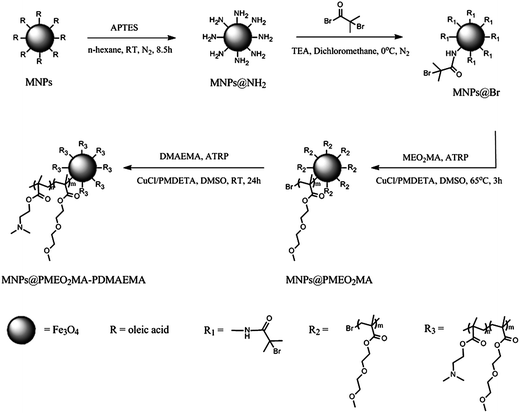 | ||
| Scheme 1 Synthetic procedure for MNPs@PMEO2MA-PDMAEMA. | ||
High resolution transmission electron microscopy (HRTEM) images of MNPs are exhibited in Fig. 1. The crystal structure of the MNP phase can be clearly seen in the photograph (A). The diameter of the MNPs is mainly around 4 nm. In Fig. 1B, one can easily distinguish the polymer brush layer from the MNP cores, because of the different contrast between the amorphous polymer phase and the crystals.
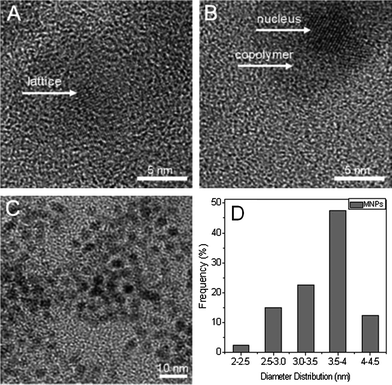 | ||
| Fig. 1 HRTEM photos of MNPs (A) and MNPs@PMEO2MA50-PDMAEMA150 (B). (C and D): TEM image of MNPs taken with a 10 nm scale bar and size distribution. | ||
The magnetization curves of the as-synthesized nanoparticles and polymer-grafted MNPs were tested at 300 K (Fig 1S†). As shown in the figure, the saturation magnetization values of the OA-modified MNPs and MNPs-polymer brushes are about 20.1 emu g−1 and 16.8 emu g−1, respectively. It is evident that capping the MNPs with polymer lowers the magnetization to a certain degree. Importantly, neither coercivity nor remanence is observed in the magnetization curves, indicating the superparamagnetic behavior of the MNPs.
Fig. 2S† shows the FTIR spectra of the samples. The featured absorption bands of DMAEMA are located at 1730 cm−1 (C![[double bond, length as m-dash]](https://www.rsc.org/images/entities/char_e001.gif) O), 1148 cm−1 (C–O) and 1456 cm−1 (C–N).33 It is noted that the main characteristic peaks of MEO2MA overlap with those of DMAEMA. Nevertheless, the increased peak intensity of C–O (1148 cm−1) in the MNPs@PMEO2MA50-PDMAEMA150 compared to that in MNPs@PDMAEMA150 is evidence of the successful copolymerization of MEO2MA.34 To further verify if PMEO2MA was grafted onto the MNPs, the LCSTs of MNPs-polymer brushes solutions which reflect the thermoresponsive behavior were determined. Fig. 2 demonstrates that both MNPs@PMEO2MA50-PDMAEMA50 and MNPs@PMEO2MA50-PDMAEMA150 aqueous solutions exhibit their LCSTs at around 31 °C and 33 °C, respectively, suggesting the existence of PMEO2MA segments. The higher LCST of MNPs@PMEO2MA50-PDMAEMA150 is due to the enhanced hydrophilicity of the copolymer with longer chains of PDMAMEA.
O), 1148 cm−1 (C–O) and 1456 cm−1 (C–N).33 It is noted that the main characteristic peaks of MEO2MA overlap with those of DMAEMA. Nevertheless, the increased peak intensity of C–O (1148 cm−1) in the MNPs@PMEO2MA50-PDMAEMA150 compared to that in MNPs@PDMAEMA150 is evidence of the successful copolymerization of MEO2MA.34 To further verify if PMEO2MA was grafted onto the MNPs, the LCSTs of MNPs-polymer brushes solutions which reflect the thermoresponsive behavior were determined. Fig. 2 demonstrates that both MNPs@PMEO2MA50-PDMAEMA50 and MNPs@PMEO2MA50-PDMAEMA150 aqueous solutions exhibit their LCSTs at around 31 °C and 33 °C, respectively, suggesting the existence of PMEO2MA segments. The higher LCST of MNPs@PMEO2MA50-PDMAEMA150 is due to the enhanced hydrophilicity of the copolymer with longer chains of PDMAMEA.
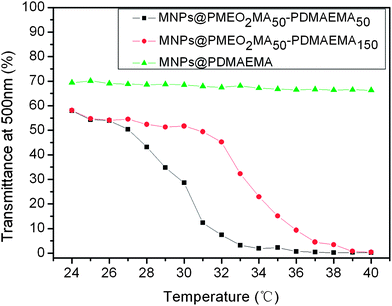 | ||
| Fig. 2 Light transmission versus temperature curves of MNPs@PDMAEMA, MNPs@PMEO2MA50-PDMAEMA50 and MNPs@PMEO2MA50-PDMAEMA150 in PBS solution (pH = 7.4, 0.5 wt%). | ||
Fig. 3S† displays the TGA curves of the MNPs modified with PDMAEMA and PMEO2MA-PDMAEMA. We note that the MNPs@Br has only a little mass loss from room temperature to 600 °C (not shown), which is ascribed to the thermal decomposition of initiator molecules. In contrast, the remaining masses (%) of MNPs@PDMAEMA150 and MNPs@PMEO2MA50-PDMAEMA150 are between 0 and that of MNPs@Br, due to grafting different polymer contents. Based on the data from TGA, the polymer contents in MNPs@PDMAEMA150 and MNPs@PMEO2MA50-PDMAEMA150 are calculated to be 94.14% and 85.99%, respectively. The lower content of copolymer in the hybrid nanoparticles may be attributed to the steric hindrance of the first segment of PMEO2MA, which affects the polymerization of DMAEMA.
3.2. Physicochemical properties of MNPs-polymer brushes/pDNA complexes
The ability of MNPs-polymer brushes to condense DNA is critical for achieving efficient transfection. Agarose gel retardation assay demonstrates that the migrating free DNA is gradually retarded with increasing complex ratio (Fig. 3). In comparison, MNPs@PMEO2MA50-PDMAEMA50 and MNPs@PMEO2MA50-PDMAEMA150 result in the complete retardation of DNA at ratios of 5![[thin space (1/6-em)]](https://www.rsc.org/images/entities/char_2009.gif) :
:![[thin space (1/6-em)]](https://www.rsc.org/images/entities/char_2009.gif) 1 and 1
1 and 1![[thin space (1/6-em)]](https://www.rsc.org/images/entities/char_2009.gif) :
:![[thin space (1/6-em)]](https://www.rsc.org/images/entities/char_2009.gif) 1, respectively. The condensation ability of MNPs@PMEO2MA50-PDMAEMA50 is apparently inferior to that of MNPs@PMEO2MA50-PDMAEMA150 due to shorter polycationic segments. The poorer DNA condensation ability may affect the transfection efficiency. Therefore, in the following tests, we only characterized the physicochemical properties of MNPs@PMEO2MA50-PDMAEMA150, and focused on its gene transfection driven by magnetic field and temperature.
1, respectively. The condensation ability of MNPs@PMEO2MA50-PDMAEMA50 is apparently inferior to that of MNPs@PMEO2MA50-PDMAEMA150 due to shorter polycationic segments. The poorer DNA condensation ability may affect the transfection efficiency. Therefore, in the following tests, we only characterized the physicochemical properties of MNPs@PMEO2MA50-PDMAEMA150, and focused on its gene transfection driven by magnetic field and temperature.
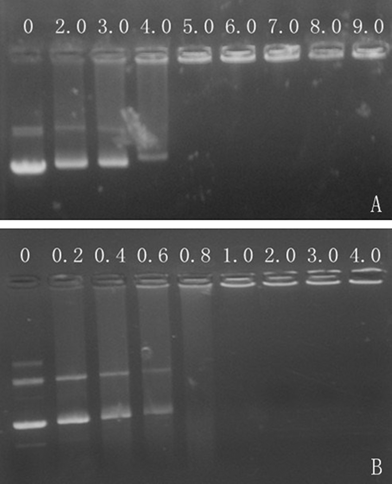 | ||
| Fig. 3 Agarose gel electrophoresis patterns of MNPs@PMEO2MA50-PDMAEMA50/pDNA complexes (A) and MNPs@PMEO2MA50-PDMAEMA150/pDNA complexes (B) at varied weight ratios. | ||
The hydrodynamic sizes of the MNPs@PMEO2MA50-PDMAEMA150/DNA complexes at varied ratios were measured and the results are shown in Fig. 4A. The average diameters exhibit a declining trend with increments in complexing ratio. While the ratio is above 10![[thin space (1/6-em)]](https://www.rsc.org/images/entities/char_2009.gif) :
:![[thin space (1/6-em)]](https://www.rsc.org/images/entities/char_2009.gif) 1, the sizes drop to less than 120 nm, which is roughly consistent with the results obtained from the TEM images shown in Fig. 5. The particle size in this range can readily undergo endocytosis.31Fig. 4B displays the zeta potentials of the MNPs@PMEO2MA50-PDMAEM150/pDNA complexes determined at various ratios. Clearly, the zeta potentials show a rising trend with increasing ratio up to 14, and then level off at higher ratios. The appropriate positive surface charge density of the MNPs@polymer brushes enables tighter packing of DNA, resulting in much smaller complexes at a higher complex ratio, which will increase the affinity of complexes to negatively charged cell membrane surfaces, thereby facilitating the cellular uptake of nanoplexes.35
1, the sizes drop to less than 120 nm, which is roughly consistent with the results obtained from the TEM images shown in Fig. 5. The particle size in this range can readily undergo endocytosis.31Fig. 4B displays the zeta potentials of the MNPs@PMEO2MA50-PDMAEM150/pDNA complexes determined at various ratios. Clearly, the zeta potentials show a rising trend with increasing ratio up to 14, and then level off at higher ratios. The appropriate positive surface charge density of the MNPs@polymer brushes enables tighter packing of DNA, resulting in much smaller complexes at a higher complex ratio, which will increase the affinity of complexes to negatively charged cell membrane surfaces, thereby facilitating the cellular uptake of nanoplexes.35
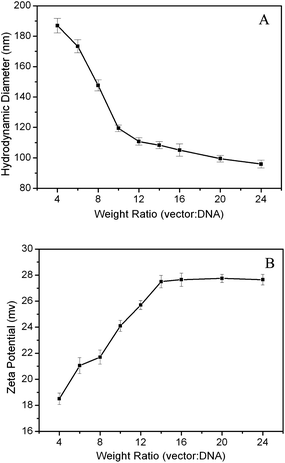 | ||
| Fig. 4 Hydrodynamic diameters (A) and zeta potentials (B) of MNPs@PMEO2MA50-PDMAEMA150/pDNA complexes at different weight ratios. | ||
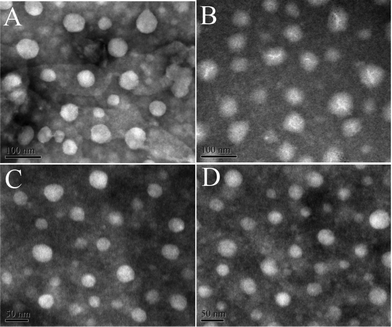 | ||
Fig. 5 TEM images of negatively stained vector/pDNA complexes: MNPs@PMEO2MA50-PDMAEMA150/pDNA at 10![[thin space (1/6-em)]](https://www.rsc.org/images/entities/char_2009.gif) : :![[thin space (1/6-em)]](https://www.rsc.org/images/entities/char_2009.gif) 1 (A), MNPs@PMEO2MA50-PDMAEMA150/pDNA at 12 1 (A), MNPs@PMEO2MA50-PDMAEMA150/pDNA at 12![[thin space (1/6-em)]](https://www.rsc.org/images/entities/char_2009.gif) : :![[thin space (1/6-em)]](https://www.rsc.org/images/entities/char_2009.gif) 1 (B), MNPs@PMEO2MA50-PDMAEMA150/pDNA at 20 1 (B), MNPs@PMEO2MA50-PDMAEMA150/pDNA at 20![[thin space (1/6-em)]](https://www.rsc.org/images/entities/char_2009.gif) : :![[thin space (1/6-em)]](https://www.rsc.org/images/entities/char_2009.gif) 1 (C) and MNPs@PMEO2MA50-PDMAEMA150/pDNA at 24 1 (C) and MNPs@PMEO2MA50-PDMAEMA150/pDNA at 24![[thin space (1/6-em)]](https://www.rsc.org/images/entities/char_2009.gif) : :![[thin space (1/6-em)]](https://www.rsc.org/images/entities/char_2009.gif) 1 (D). 1 (D). | ||
3.3. In vitro gene transfection
In this study, pGL-3 plasmid as a luciferase reporter gene was used to evaluate the in vitro transfection efficiency of the MNPs-polymer brushes/pDNA complexes in COS-7 cells and HepG-2 cells. As stated in Section 2.12, four protocols were used to assess the synergistic effects of magnetic and thermoresponsive stimuli on the transfection efficiency of MNPs-polymer brushes at various complexing ratios from 4![[thin space (1/6-em)]](https://www.rsc.org/images/entities/char_2009.gif) :
:![[thin space (1/6-em)]](https://www.rsc.org/images/entities/char_2009.gif) 1 to 16
1 to 16![[thin space (1/6-em)]](https://www.rsc.org/images/entities/char_2009.gif) :
:![[thin space (1/6-em)]](https://www.rsc.org/images/entities/char_2009.gif) 1(Fig. 6 and 7). The thermal gravimetric analysis (Fig. S3†) indicates that the content of magnetic nanoparticles (MNPs) in the hybrids is lower than those obtained by traditional methods, and the MNPs-polymer brushes are well dispersed in aqueous solution. So, while magnetic field was applied, it took a longer time for the MNPs to settle down. In our experiment, we found that a treatment duration shorter than 2 h could not lead to satisfactory cellular internalization. In addition, it is necessary to point out that we observed no aggregation of the MNPs-polymer/DNA complexes in serum during transfection.
1(Fig. 6 and 7). The thermal gravimetric analysis (Fig. S3†) indicates that the content of magnetic nanoparticles (MNPs) in the hybrids is lower than those obtained by traditional methods, and the MNPs-polymer brushes are well dispersed in aqueous solution. So, while magnetic field was applied, it took a longer time for the MNPs to settle down. In our experiment, we found that a treatment duration shorter than 2 h could not lead to satisfactory cellular internalization. In addition, it is necessary to point out that we observed no aggregation of the MNPs-polymer/DNA complexes in serum during transfection.
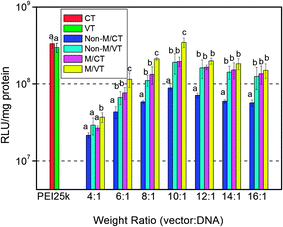 | ||
| Fig. 6 In vitro gene transfection efficiency of the MNPs@PMEO2MA50-PDMAEMA150/pDNA complexes in comparison with that of PEI25k at various weight complexing ratios in COS-7 cells cultured in the DMEM containing 10% FBS. Non-M: without a magnetic field; M: magnetic field; VT: variable temperature; CT: constant temperature. Results are presented as the mean ± SD in triplicate. The same letters labeled in the figure indicate there is no significant difference; different letters indicate significant difference among the experimental groups. P < 0.05. | ||
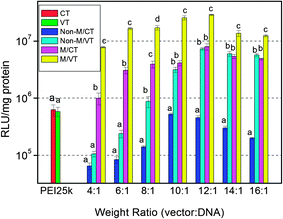 | ||
| Fig. 7 In vitro gene transfection efficiency of the MNPs@PMEO2MA50-PDMAEMA150/pDNA complexes in comparison with that of PEI25k at various weight complexing ratios in HepG-2 cells cultured in the DMEM containing 10% FBS. Non-M: without a magnetic field; M: magnetic field; VT: variable temperature; CT: constant temperature. Results are presented as the mean ± SD in triplicate. The same letters labeled in the figure indicate there is no significant difference; different letters indicate significant difference among the experimental groups. P < 0.05. | ||
Fig. 6 clearly shows that combined application of a magnetic field and temporary cooling achieves a higher transfection level than the other three routes of constant temperature without applying a magnet, constant temperature with applying the magnet and variable temperature without the magnet in COS-7 cells. At a 10![[thin space (1/6-em)]](https://www.rsc.org/images/entities/char_2009.gif) :
:![[thin space (1/6-em)]](https://www.rsc.org/images/entities/char_2009.gif) 1 ratio, under magnetic and temperature dual stimuli, the MNPs-polymer brushes achieve the highest efficiency, 3.46 × 10⁸ RLU per mg protein, which is 4-fold higher than that of normal culture conditions and comparable to that of PEI25k. The decrease of transfection efficiency at higher complexing ratios may result from the cytotoxicity of the vector.
1 ratio, under magnetic and temperature dual stimuli, the MNPs-polymer brushes achieve the highest efficiency, 3.46 × 10⁸ RLU per mg protein, which is 4-fold higher than that of normal culture conditions and comparable to that of PEI25k. The decrease of transfection efficiency at higher complexing ratios may result from the cytotoxicity of the vector.
Amazingly, the transfection efficiencies of the MNPs-polymer brushes in HepG-2 cells are significantly increased under magnetic field and temperature stimuli compared to the other three protocols (Fig. 7). The transfection level of the complexes with either application of a magnet or cooling treatment is about 15-fold higher than that of constant temperature without the magnet at the optimum ratio. The transfection efficiency with both magnetic field and temperature stimuli is about 10–20 and 50–100 times more than that of either applying a magnetic field or cooling treatment and constant temperature without a magnetic field, respectively, at the selected ratios. Dual stimuli also result in 25–45 times better efficiency than PEI25k. We note that for temperature insensitive PEI25k, there is no significant difference in the transfection efficiencies in Non-M/VT and Non-M/CT modes. Thus, it is rational to think that the increased transfection level under variable temperature conditions is mainly from the thermoresponsive behavior of the MNPs-polymer brushes.
To further evaluate the gene transfection of the MNPs-polymer brushes by the four protocols, we assessed the expression of pEGFP in HepG-2 cells at an optimum weight ratio. GFP expression was analyzed by flow cytometry (Fig. 8). It can be seen that both MNPs@polymer brushes and PEI25k achieve efficient GFP expression. Comparatively, the MNPs-polymer brushes are more potent than PEI25k in mediating GFP expression in the four methods. The transfection efficiency obtained under a magnetic field or at variable temperature conditions is around 19%, more than twice that of PEI25k. Similarly, combining magnetic field and temperature stimuli leads to more prominent gene expression than any single stimulus. 29.35% of cells express GFP, 3 times higher than that of PEI25k.
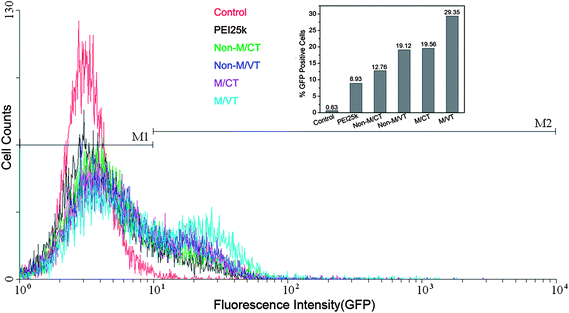 | ||
Fig. 8 Analysis results of GFP expression mediated by MNPs@PMEO2MA50-PDMAEMA150/pDNA in HepG-2 cells using a flow cytometer. Control: naked DNA; PEI25k/pDNA(2![[thin space (1/6-em)]](https://www.rsc.org/images/entities/char_2009.gif) : :![[thin space (1/6-em)]](https://www.rsc.org/images/entities/char_2009.gif) 1, wt/wt); MNPs@PMEO2MA50-PDMAEMA150/pDNA(12 1, wt/wt); MNPs@PMEO2MA50-PDMAEMA150/pDNA(12![[thin space (1/6-em)]](https://www.rsc.org/images/entities/char_2009.gif) : :![[thin space (1/6-em)]](https://www.rsc.org/images/entities/char_2009.gif) 1, wt/wt) at different conditions. 1, wt/wt) at different conditions. | ||
The considerable improvement in transfection efficiency under magnetic field and temperature stimuli is due to the increased internalization of nanocomplexes, as well as efficient gene unpacking in cytoplasm. The magnetic field-generated attractive force can facilitate the rapid sedimentation of complexes on the surface of cell membranes and pull the magnetic vector/DNA nanoparticle across the barrier of the plasma membrane. As a result, more nucleic acids are ferried into the cells. This can be confirmed by the results of flow cytometry (Fig. 9). As shown in the figure, both the internalization rates of PEI25k and the MNPs@polymer brushes are more than 96%. But the average fluorescence intensity is significantly different, in that the intensity of the MNPs@polymer brushes/DNA complexes in the presence of a magnetic field is 1.9-fold that in the absence of a magnet, and 6-fold that of PEI25k. After magnetic field-driven increased entry of nanocomplexes into the cells, temporary cooling leads to the hydration of poly[2-(2-methoxyethoxy)ethyl methacrylate] chains from dehydrated collapse, which contributes to more exposure of genes for transcription.36 Thus, the synergistic effects of magnetic field and temperature stimuli achieve much higher gene transfection levels. The mechanism of the magnetic field/temperature stimuli-induced enhancement in gene transfection is depicted in Scheme 2. In previous work,36,37 a variable temperature approach was reported to lead to several times improvement in gene expression compared to conventional transfection. In this study, a 50–100-fold increase in transfection was accomplished with combined application of a magnetic field and temperature.
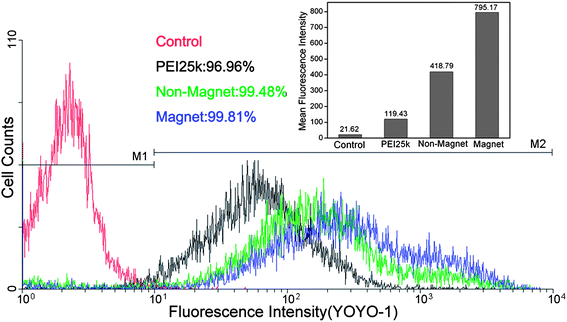 | ||
Fig. 9 Cellular internalization of complexes at a weight ratio of 12![[thin space (1/6-em)]](https://www.rsc.org/images/entities/char_2009.gif) : :![[thin space (1/6-em)]](https://www.rsc.org/images/entities/char_2009.gif) 1 by HepG-2 cells in the presence and absence of a magnetic field. 1 by HepG-2 cells in the presence and absence of a magnetic field. | ||
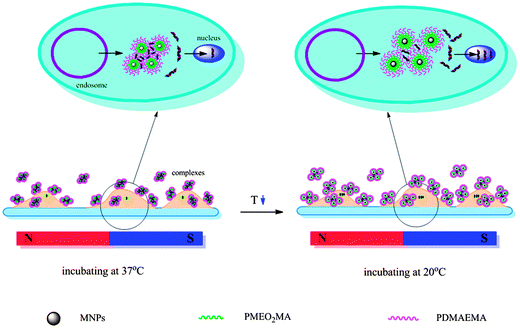 | ||
| Scheme 2 The mechanism of the magnetic field/temperature stimuli-induced enhancement in gene transfection. | ||
3.4. Cytotoxicity evaluation
The cytotoxicity of the MNPs-polymer brushes/DNA nanocomplexes was examined on HepG-2 cells by MTT assay. PEI25k was used as a control. Fig. S4† shows an increase in toxicity of the magnetic/thermoresponsive vector in a dose-dependent manner. After treating complexes with ratios from 6![[thin space (1/6-em)]](https://www.rsc.org/images/entities/char_2009.gif) :
:![[thin space (1/6-em)]](https://www.rsc.org/images/entities/char_2009.gif) 1 to 16
1 to 16![[thin space (1/6-em)]](https://www.rsc.org/images/entities/char_2009.gif) :
:![[thin space (1/6-em)]](https://www.rsc.org/images/entities/char_2009.gif) 1, more than 80% of cells remain viable. At 40
1, more than 80% of cells remain viable. At 40![[thin space (1/6-em)]](https://www.rsc.org/images/entities/char_2009.gif) :
:![[thin space (1/6-em)]](https://www.rsc.org/images/entities/char_2009.gif) 1, the cell viability decreases to 66%. Taken together, we have shown that the MNPs-polymer brushes/pDNA complexes are less cytotoxic than PEI25k over the best transfection complex ratios.
1, the cell viability decreases to 66%. Taken together, we have shown that the MNPs-polymer brushes/pDNA complexes are less cytotoxic than PEI25k over the best transfection complex ratios.
4. Conclusions
In conclusion, we introduced a convenient approach for the construction of magnetic/thermoresponsive nonviral vectors by growing poly[2-(2-methoxyethoxy)ethyl methacrylate]-b-poly[2-(dimethylamino)ethyl methacrylate] diblock copolymer brushes in a sequential process directly on the surface of Fe3O4 through ATRP. The copolymer brushes-modified superparamagnetic nanoparticles exhibited a lower critical transition temperature of around 31–32 °C, and were able to condense plasmid DNA into nanocomplexes. Co-application of magnetic field and temperature stimuli was shown to enhance gene transfection efficiencies in COS-7 cells and HepG-2 cells in the presence of 10% FBS. In particular, its efficiency was 50–100- and 25–45-fold higher than that of conventional protocol and PEI25k, respectively, under magnetic field and variable temperature conditions, due to the attractive force-driven enhanced cellular uptake and cooling-induced hydration of polymer chains. It is anticipated that magnetofection combined with a temperature stimulus will offer a facile strategy to enhance the transfection efficiency of a nonviral vector.Acknowledgements
The authors gratefully acknowledge the support for this work from the National Natural Science Foundation of China (Grant 50973082) and the National Science and Technology Major Project of China (Grant 2012AA022603).References
- H. Erfle, B. Neumann, U. Liebel, P. Rogers, M. Held, T. Walter, J. Ellenberg and R. Pepperkok, Nat. Protoc., 2007, 2, 392 CrossRef CAS.
- H. Shen, J. Tan and W. M. Saltzman, Nat. Mater., 2004, 3, 569 CrossRef CAS.
- H. W. Child, P. A. Del Pino, J. M. De La Fuente, A. S. Hursthouse, D. Stirling, M. Mullen, G. M. McPhee, C. Nixon, V. Jayawarna and C. C. Berry, ACS Nano, 2011, 5, 7910 CrossRef CAS.
- E. C. Cho, Q. Zhang and Y. N. Xia, Nat. Nanotechnol., 2011, 6, 385 CrossRef CAS.
- S. J. Park and K. Na, Biomaterials, 2012, 33, 6485 CrossRef CAS.
- M. A. Mintzer and E. E. Simanek, Chem. Rev., 2009, 109, 259 CrossRef CAS.
- M. Chomy, B. Polyak, I. S. Alferiev, K. Walsh, G. Frienman and R. J. Levy, FASEB J., 2007, 21, 2510 CrossRef.
- S. C. McBain, H. H. P. Yiu, A. E. Haj and J. Dobson, J. Mater. Chem., 2007, 17, 2561 RSC.
- C. Plank, U. Schillinger, F. Scherer, C. Bergemann, J. S. Rémy, F. Krötz, M. Anton, J. Lausier and J. Rosenecker, Biol. Chem., 2003, 384, 737 CrossRef CAS.
- F. Scherer, M. Anton, U. Schillinger, J. Henke, C. Bergemann, A. Krüger, B. Gänsbacher and C. Plank, Gene Ther., 2002, 9, 102 CrossRef CAS.
- U. Schillinger, T. Brill, C. Rudolph, S. Huth, S. Gersting, F. Krötz, J. Hirschberger, C. Bergemann and C. Plank, J. Magn. Magn. Mater., 2005, 293, 501 CrossRef CAS.
- L. Xiang, W. Bin, J. Huali, J. Wei, T. Jiesheng, G. Feng and L. Ying, J. Gene Med., 2007, 9, 679 CrossRef.
- S. Prijic, L. Prosen, M. Cemazar, J. Scancar, R. Romih, J. Lavrencak, V. Bregar, A. Coer, M. Krzan, A. Znidarsic and G. Sersa, Biomaterials, 2012, 33, 4379 CrossRef CAS.
- C. Wang, S. Ravi, G. Martinez, V. Chinnasamy, P. Raulji, M. Howell, Y. Davis, J. Mallela, M. Seehra and S. Mohapatra, J. Controlled Release, 2012, 163, 82 CrossRef CAS.
- H. H. P. Yiu, S. C. McBain, A. J. E. Haj and J. Dobson, Nanotechnology, 2007, 18, 435601 CrossRef.
- J. I. Schwerdt, G. F. Goya, M. P. Calatayud, C. B. Herenu, P. C. Reggiani and R. G. Goya, Curr. Gene Ther., 2012, 12, 116 CrossRef CAS.
- C. Plank, O. Zelphati and O. Mykhaylyk, Adv. Drug Delivery Rev., 2011, 63, 1300 CrossRef CAS.
- N. Cheng, W. Liu, Z. Cao, W. Ji, D. Liang, G. Guo and J. Zhang, Biomaterials, 2006, 27, 4984 CrossRef CAS.
- F. Dai, P. Sun, Y. Liu and W. Liu, Biomaterials, 2010, 31, 559 CrossRef CAS.
- S. Ganta, H. Devalapally, A. Shahiwala and M. Amiji, J. Controlled Release, 2008, 126, 187 CrossRef CAS.
- N. Nishiyama, A. Iriyama, W. D. Jang, K. Miyata, K. Itaka, Y. Inoue, H. Takahashi, Y. Yanagi, Y. Tamaki, H. Koyama and K. Kataoka, Nat. Mater., 2004, 4, 934 CrossRef.
- V. Dehousse, N. Garbacki, A. Colige and B. Evrard, Biomaterials, 2010, 31, 1839 CrossRef CAS.
- S. J. Sun, W. G. Liu, N. Cheng, B. Q. Zhang, Z. Q. Cao, K. D. Yao, D. C. Liang, A. J. Zuo, G. Guo and J. Y. Zhang, Bioconjugate Chem., 2005, 16, 972 CrossRef CAS.
- R. Zhang, Y. Wang, F. S. Du, Y. L. Wang, Y. X. Tan, S. P. Ji and Z. C. Li, Macromol. Biosci., 2011, 11, 1939 CrossRef.
- M. Kurisawa, M. Yokoyama and T. Okano, J. Controlled Release, 2000, 69, 127 CrossRef CAS.
- M. Türk, S. Dinçer, I. G. Yuluğ and E. Pişkin, J. Controlled Release, 2004, 96, 325 CrossRef.
- Z. W. Mao, L. Ma, J. Yan, C. Y. Gao and J. C. Shen, Biomaterials, 2007, 28, 4488 CrossRef CAS.
- S. Y. Wong, J. M. Pelet and D. Putnam, Prog. Polym. Sci., 2007, 32, 799 CrossRef CAS.
- S. Sun, H. Zeng, D. B.Robinson, S. Raoux, P. M. Rice, S. X. Wang and G. Li, J. Am. Chem. Soc., 2004, 126, 273 CrossRef CAS.
- J. Liu, W. He, L. Zhang, Z. Zhang, J. Zhu, L. Yuan, H. Chen, Z. Cheng and X. Zhu, Langmuir, 2011, 27, 12684 CrossRef CAS.
- P. van de Wetering, E. E. Moret, N. M. E. Schuurmans-Nieuwenbroek, M. J. van Steenbergen and W. E. Hennink, Bioconjugate Chem., 1999, 10, 589 CrossRef CAS.
- L. Tang, Y. Yang, T. Bai and W. Liu, Biomaterials, 2011, 32, 1943 CrossRef CAS.
- P. Zhang and W. G. Liu, Biomaterials, 2010, 31, 3087 CrossRef CAS.
- Y. Li, J. H. Yang, J. Q. Li, Y. Liu and W. G. Liu, RSC Adv., 2012, 2, 2422 RSC.
- Z. H. Wang, W. B. Li, J. Ma, G. P. Tang, W. T. Yang and F. J. Xu, Macromolecules, 2011, 44, 230 CrossRef CAS.
- J. Yang, P. Zhang, L. Tang, P. Sun, W. Liu, P. Sun, A. Zuo and D. Liang, Biomaterials, 2010, 31, 144 CrossRef CAS.
- H. Cheng, J. L. Zhu, Y. X. Sun, S. X. Cheng, X. Z. Zhang and R. X. Zhuo, Bioconjugate Chem., 2008, 19, 1368 CrossRef CAS.
Footnotes |
| † Electronic supplementary information (ESI) available. See DOI: 10.1039/c2tb00203e |
| ‡ Equal contribution. |
| This journal is © The Royal Society of Chemistry 2013 |
