A single-residue substitution inhibits fibrillization of Ala-based pentapeptides. A spectroscopic and molecular dynamics investigation†
Mario
Caruso
a,
Emanuela
Gatto
a,
Ernesto
Placidi
b,
Gema
Ballano
c,
Fernando
Formaggio
c,
Claudio
Toniolo
c,
David
Zanuy
d,
Carlos
Alemán
de and
Mariano
Venanzi
*a
aDepartment of Chemical Sciences and Technologies, University of Rome “Tor Vergata”, 00133 Rome, Italy. E-mail: venanzi@uniroma2.it
bInstitute of Structure of Matter, CNR, Department of Physics, University of Rome “Tor Vergata”, 00133 Rome, Italy
cInstitute of Biomolecular Chemistry, Padova Unit, CNR, Department of Chemistry, University of Padova, 35131 Padova, Italy
dDepartment of Chemical Engineering, Polytechnic University of Catalunya, Barcelona 08028, Spain
eCenter for Research in Nano-Engineering, Polytechnic University of Catalunya, Barcelona 08028, Spain
First published on 12th December 2013
Abstract
The aggregation properties of two Ala-based pentapeptides were investigated by spectroscopic techniques and molecular dynamics (MD) simulations. The two peptides, both functionalized at the N-terminus with a pyrenyl group, differ in the insertion of an α-aminoisobutyric acid residue at position 4. We showed that this single modification of the homo-peptide sequence inhibits the aggregation of the pentapeptide in aqueous solutions. Atomic force microscopy imaging revealed that the two peptides form mesoscopic aggregates of very different morphologies when deposited on mica. MD experiments showed that the two peptides have a very different propensity to form β-pleated sheet structures, as confirmed by our spectroscopic measurements. The implications of these findings for our understanding of the mechanism leading to the formation of amyloid structures, primary responsible for numerous neurodegenerative diseases, are also discussed.
Introduction
Peptide aggregation is determined by a complex interplay of dynamical and structural factors, including the secondary structure attained by the peptide chain and its dynamical properties, the interactions (electrostatic, H-bond and van der Waals) that can be established between different peptide chains, the comparative solvation of single peptide molecules and peptide aggregates of different morphologies (globules, fibrils, and nanotubes).1–3In physiological environments, the course of the process is largely dictated by interfacial phenomena, most notably hydrophobic effects. This ensemble of factors governs the overall stability of the supramolecular aggregates and their final morphology, as a result of enthalpic, i.e. the sum of interactions, and entropic, i.e. the organization of nano- and mesoscopic structures in a given environment, contributions.
In this connection, a specific role may be played by aromatic residues: (i) aromatic⋯aromatic interactions normally are stronger than van der Waals interactions between alkyl chains. (ii) They have relatively compact volumes. (iii) The overlap between aromatic rings may occur in a plane-to-plane (H-type) or an edge-to-edge (J-type) orientation, driving the self-assembly process toward a specific geometry.4 Aromatic⋯aromatic interactions have been shown to induce the self-assembly of pentapeptide derivatives in water to form nanofibers and supramolecular hydrogels.5 More strikingly, also the Phe–Phe dipeptide, an important structural motif of the Aβ peptide, i.e. the 40–42 residue peptide responsible for the Alzheimer's disease, spontaneously gives rise to a rich morphology of nanostructures (from vesicles to long and stiff nanotubes) depending on the environment and preparation conditions.6,7
Peptides that form amyloids undergo a structural transition from native, soluble monomeric conformations into aggregative fibrillar assemblies that exhibit predominantly a β-sheet structure.8 Basically, amyloid fibers are formed by a bundle of highly ordered filaments, with a diameter of about 7–10 nm and lengths of up to a few micrometers. They are composed of ladders of β-strands that run perpendicularly to the fiber axis and are arranged in H-bonded β-sheets (cross β-sheets).9 In Alzheimer's disease, Aβ fibers deposit in the extracellular space of the brain and on walls of cerebral blood vessels as amyloid plaques.10
In the last decade, it was recognized that prefibrillar assemblies actually represent the toxic elements responsible for cell death in the infected tissues.11 The species isolated at the early stages of aggregation were characterized as protofibrillar aggregates, comprised of stacks usually formed by two to four β-sheet tapes, 20–70 nm in length and 3 nm in diameter.12
Therefore, inhibiting the ability of amyloidogenic proteins to adopt a β-sheet conformation would be useful as a way to interfere with the amyloid self-assembly process. Soto13 demonstrated that incorporation of β-breaker elements into short peptides composed of the recognition sequence of the amyloidogenic protein results in inhibition of amyloid formation.
α-Aminoisobutyric acid (Aib) is a unique β-sheet breaker residue,14 differing from Ala with regard to the incorporation on the Cα atom of an additional methyl group (Cα-methylated alanine). As a consequence, Aib populates an extremely limited conformational domain. Comparison of the Ramachandran plots of Aib, Ala and Pro clearly indicates that the former amino acid has the potential to be a stronger β-breaker agent.15 It has already been shown that the incorporation of an Aib residue into a fully protected Alzheimer's β-amyloid fragment (Aβ17–21) induces a helical structure of the fragment in organic solvents.14b–d Gilead and Gazit15 found that the combination of an Aib modification and a native aromatic residue in a short recognition motif conferred to the peptide significant inhibition properties. It was also experimentally demonstrated that Pro is a good β-sheet breaker, but clearly less efficient than Aib.14a–c,16
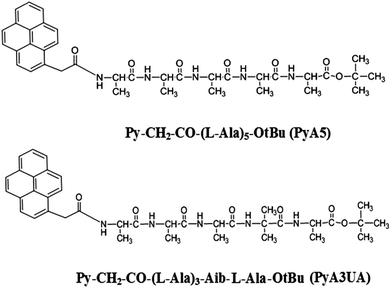
As oligopeptide fragments as short as pentapeptides were shown to form typical amyloid assemblies in vitro that have structural, biophysical, and cytotoxic properties similar to those formed by much longer polypeptides, we decided to investigate the aggregation properties of two Ala-based pentapeptides, both functionalized at the N-terminus with a 1-pyrenyl (Py) group, but differing with regard to the insertion of an Aib residue at position 4 (Scheme 1). In our view, these two peptides represent appropriate models of fibrillization (the former) and inhibition (the latter) of peptide β-sheet aggregation. The two peptides will be denoted in the following as PyA5 and PyA3UA (U = Aib), respectively.
Aggregation of oligo- and poly(Ala)n peptides was already investigated.16a,17,18 It was reported that, while A6K (A = Ala and K = Lys) forms nanofibers, A9K self-assembles into smaller nanorods, showing that an increase of the hydrophobic tail length has a strong effect on the nanostructure and dynamic process.17a Self-assembly of A6K nanofibers was characterized by a sequential process involving a hierarchy of highly stable intermediate aggregates, such as globular peptide stacks of different size and shape which coexist with short fibers. More recently, it has been shown that A6K can also form single-walled nanotubes by helical wrapping of β-sheet ribbons formed by antiparallel peptide dimers.19
An Ala-based octapeptide comprising a Tyr (Y) residue (Ac–A4KA2Y–NH2, where Ac is acetyl) was shown to exhibit a statistical coil structure in aqueous solution with a predominant sampling of poly(Pro)n II conformation.17b The Tyr residue was pivotal for the self-aggregation of the octapeptide that shows a lag time preceding the fibril growth typical of fibrillogenesis.3
Poly(Ala)n-based peptides were also investigated as models of β-sheet complexes to understand the interconversion processes that occur from cellular-allowed random coil or α-helical conformations into insoluble cell-deleterious β-sheet motifs. Ala was selected as the primary constituent amino acid of the peptide sequence in order to obtain monomeric α-helices under mild buffer and temperature conditions.18
As the development of a number of neurodegenerative disorders has been linked to conformational interconversion from random coil or partially helical peptides to highly stable, insoluble β-sheet aggregates, we decided to investigate the conformational aspects of the aggregation process at a very early stage, focusing on the perturbation of the aggregation properties of Ala-based pentapeptides by a single Ala-to-Aib substitution. To this end, we studied the aggregation of PyA5 and PyA3UA in methanol (MeOH) and MeOH–water solutions, modulating the relevance of the hydrophobic effects by varying the fractional content of water in the solvent mixture. The functionalization of the two peptides with a Py group has the double aim to investigate the role of an aromatic moiety in the aggregation process and to provide the two compounds with a chromophore featuring strong absorption in the UV region and intense fluorescence emission in the blue region of the visible spectrum.20
These properties allowed us to apply several spectroscopic techniques (UV-Vis absorption, steady-state and time resolved fluorescence, electronic CD) and IR absorption as well, triggering the aggregation process by adding increasing fractions of water to MeOH solutions. The morphology of the peptide aggregates when deposited on a hydrophilic mica surface was characterized by atomic force microscopy (AFM) imaging. Molecular dynamics (MD) simulations were also carried out to investigate the early stages of the aggregation process at a molecular level, focusing on the stability and dynamical evolution of the β-sheet aggregates.
Materials and methods
Materials
The synthesis of the two Py and OtBu (tert-butoxy) terminally protected pentapeptides PyA5 and PyA3UA was performed by solution methods using either the O-(7-azabenzotriazolyl)-1,1,3,3-tetramethyluronium hexafluorophosphate (HATU)/1-hydroxy-7-azabenzotriazole (HOAt) or the N-ethyl-N′-[3-(dimethylamino)propyl] carbodiimide (EDC)/HOAt carboxy-activation procedure.21 Details of their characterization are reported in the ESI.† Spectroscopy grade solvents (Carlo Erba, Milan, Italy) were used for all experiments. Low conductivity bidistilled water was employed for the preparation of all of the MeOH–water solutions.UV-Vis absorption
Absorption measurements were carried out on a Cary 100 SCAN (Varian, Palo Alto, CA) spectrophotometer. Molar concentrations were determined in MeOH by absorption measurements at λ = 340 nm [pyrene absorption, ε(340) = 41![[thin space (1/6-em)]](https://www.rsc.org/images/entities/char_2009.gif) 000 M−1 cm−1]. All experiments were carried out in quartz cells of variable optical lengths (0.1, 0.5, and 1.0 cm) at micromolar concentrations.
000 M−1 cm−1]. All experiments were carried out in quartz cells of variable optical lengths (0.1, 0.5, and 1.0 cm) at micromolar concentrations.
Steady-state and time-resolved fluorescence
Emission spectra at micromolar concentrations were obtained on a Spex-Fluorolog III (Horiba Jobin-Yvon Instruments, Longjumeau, France) spectrofluorimeter, equipped with a 450 W xenon lamp operating in single photon counting (SPC) mode. Samples were excited at 340 nm and the fluorescence spectra were recorded from 360 to 500 nm using a bandwidth of 2 nm for both excitation and emission slits. Thioflavin (ThT) (Fluka, Büchs, Switzerland) assays22 were carried out in 70/30 (v/v) MeOH–water solutions at 2 μM peptide concentration and at a 2![[thin space (1/6-em)]](https://www.rsc.org/images/entities/char_2009.gif) :
:![[thin space (1/6-em)]](https://www.rsc.org/images/entities/char_2009.gif) 1 ThT/peptide ratio. Samples loaded in a 1.0 cm quartz cuvette were excited at λ = 440 nm and the ThT fluorescence was recorded from 450 to 600 nm.
1 ThT/peptide ratio. Samples loaded in a 1.0 cm quartz cuvette were excited at λ = 440 nm and the ThT fluorescence was recorded from 450 to 600 nm.
Fluorescence time decays were obtained by an EAI Life-Spec-ps (Edinburgh Analytical Instruments, Edinburgh, UK), operating in the SPC mode (λexc = 298 nm; λem = 394 nm and 460 nm; time interval = 500 ns; channels = 1024; excitation/emission bandwidths = 8 nm). Excitation at λ = 298 nm was obtained by an IBH NanoLED light emitting diode (Horiba Jobin-Yvon Instruments, Longjumeau, France) with 1 nanosecond pulse duration. Experimental time decays were deconvoluted by the pulsed excitation profile by standard software provided by EAI and based on discrete multiexponential analysis.
Fourier-transform infrared absorption spectroscopy
FTIR absorption spectra were recorded on a Nicolet FTIR spectrometer (Thermo Electron Co., Madison, WI) in the attenuated total reflection (ATR) mode on peptide films dried into a vacuum pump for 18 h on a ZnSe crystal. Spectra were recorded from 4000 to 700 cm−1, mediating over 256 scans with a resolution of 2 cm−1.Atomic force microscopy
AFM measurements on peptide films dried on a mica surface were performed in air using a Veeco Multiprobe IIIa (Santa Barbara, CA) instrument. Experiments were carried out at room temperature (20 °C) in the tapping mode by using NanoSensors SiO2 tips with a force constant of about 40 N m−1 and a typical curvature radius on the tip of 7 nm.Molecular dynamics
Two different molecular assemblies, each constituted by five strands forming parallel β-sheets, were constructed to represent the peptides investigated. Every β-sheet was introduced in the center of a box filled with water and/or MeOH solvent molecules. Each of these two solvent boxes had previously been equilibrated at a temperature of 298 K and 1 atm pressure. After placing each peptide assembly, the overlapping solvent molecules were removed and the total number of solvent molecules was equalized in both solvent environments. Thus, the systems in water (w) presented 7720 molecules of the solvent and the MeOH (m) simulations presented 3115 molecules. In summary, two different systems were prepared for each peptide assembly, being denoted as (PyA5)5m, (PyA5)5w, (PyA3UA)5m, and (PyA3UA)5w. Force field parameters were obtained from AMBER 03 libraries23 with the exception of the partial charges of the non-conventional segments: the Py–CH2–CO– group, the Aib residue and the C-terminal OtBu ester were either obtained from the literature or readjusted for this investigation. Water molecules were represented by the TIP3 model24 while the MeOH molecules by the standard AMBER03 model.23 The Py–CH2–CO– and the C-terminal OtBu ester were parametrized by studying model molecules (ESI†). A complete energy optimization at the UMP2/6-31G(d) level of such molecules was the first step to compute the atomic centered charges: those charges were obtained by fitting the HF/6-31G(d) quantum mechanical and the coulombic molecular electrostatic potentials (MEPs) to a large set of points placed outside the nuclear region. All electrostatic parameters derived at this level of theory are fully compatible with the current Amber force field. All quantum mechanics calculations were performed using the Gaussian 09 program.25 For the particular case of Py–CH2–CO–NH2, the final charge adjustment was made compatible with previously reported cases in which a Py group was involved.26 Finally, the complete set of the Aib electrostatic parameters was obtained from a previous work.27 The atom pair cut-off distance was set at 14.0 Å to compute the van der Waals and short-range electrostatic interactions. In order to avoid discontinuities in the potential energy function, non-bonding energy terms were forced to slowly converge to zero, by applying a smoothing factor from a distance of 12.0 Å. Beyond the cut-off distance, electrostatic interactions were calculated by using the particle mesh Ewald method, with a point grid density at the reciprocal space of 1 Å3.28All simulations were performed using the NAMD 2.9 program.29 Each system was submitted to 5000 steps of energy minimization (Newton–Raphson method) which were the starting point of several mini-cycles of optimization and equilibration. The numerical integration step for all performed runs was set at 2 fs. The first equilibration target was the liquid phase. This stage was integrated by 200![[thin space (1/6-em)]](https://www.rsc.org/images/entities/char_2009.gif) 000 steps of heating and equilibration under NVT conditions to thermally stabilize each model at 298 K, followed by 200
000 steps of heating and equilibration under NVT conditions to thermally stabilize each model at 298 K, followed by 200![[thin space (1/6-em)]](https://www.rsc.org/images/entities/char_2009.gif) 000 steps with NPT conditions to reach the proper solvent density. The Berendsen thermo-barostat was employed with a relaxation time of 1 ps.30 The fast convergence of the external bath was used to improve the efficiency of the thermal equilibration. During these simulation runs, all peptide assemblies were kept frozen. After the initial equilibration of the solvent bulk, the peptide assemblies were unfrozen and two consecutive runs of 200
000 steps with NPT conditions to reach the proper solvent density. The Berendsen thermo-barostat was employed with a relaxation time of 1 ps.30 The fast convergence of the external bath was used to improve the efficiency of the thermal equilibration. During these simulation runs, all peptide assemblies were kept frozen. After the initial equilibration of the solvent bulk, the peptide assemblies were unfrozen and two consecutive runs of 200![[thin space (1/6-em)]](https://www.rsc.org/images/entities/char_2009.gif) 000 steps were performed under NVT and NPT conditions, respectively. The NVT cycle was carried out using the Langevin method31 to maintain the system temperature constant with a damping coefficient of 2 ps. The last NPT equilibration cycle was run using the Nose–Hoover32 piston for pressure control, combined with the piston fluctuation control of temperature implemented for the Langevin dynamics.33 The pressure was kept at 1.01325 bar, the oscillation period was set at 1 ps, while the piston decay time was 0.001 ps. The piston temperature was set at the same value as the thermostat control (298 K). The last snapshot of the last NPT run was the starting point for 15 ns of production time. The productive runs were performed under the same conditions previously mentioned for the NPT equilibration. During the latter equilibration runs, the H-bond distances of the central residues in each β-sheet assembly were restrained to their initial equilibrium values by imposing a harmonic potential with a force constant of 20.0 kcal mol−1 between donors and acceptors of consecutive strands. By such means, the preservation of the β-sheet organization was ensured until the beginning of the production runs, thus facilitating the stability comparison depending on the amino acid constitution of the strands.
000 steps were performed under NVT and NPT conditions, respectively. The NVT cycle was carried out using the Langevin method31 to maintain the system temperature constant with a damping coefficient of 2 ps. The last NPT equilibration cycle was run using the Nose–Hoover32 piston for pressure control, combined with the piston fluctuation control of temperature implemented for the Langevin dynamics.33 The pressure was kept at 1.01325 bar, the oscillation period was set at 1 ps, while the piston decay time was 0.001 ps. The piston temperature was set at the same value as the thermostat control (298 K). The last snapshot of the last NPT run was the starting point for 15 ns of production time. The productive runs were performed under the same conditions previously mentioned for the NPT equilibration. During the latter equilibration runs, the H-bond distances of the central residues in each β-sheet assembly were restrained to their initial equilibrium values by imposing a harmonic potential with a force constant of 20.0 kcal mol−1 between donors and acceptors of consecutive strands. By such means, the preservation of the β-sheet organization was ensured until the beginning of the production runs, thus facilitating the stability comparison depending on the amino acid constitution of the strands.
Results
UV-Vis absorption spectroscopy
The absorption spectrum of the Py chromophore is characterized by vibronically structured absorption bands peaked at ∼360 (Lb), ∼340 (La), 270 (Bb) and 240 (Ba) nm. In Fig. 1 the normalized UV-Vis absorption spectra of 2 μM PyA5 and PyA3UA solutions in MeOH and MeOH–water are reported. Remarkable bathochromic and hypochromic effects on the position and intensity of the UV-Vis absorption bands of PyA5 are observed by increasing the water content.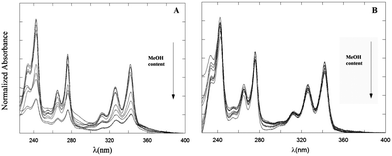 | ||
| Fig. 1 Absorption spectra of PyA5 (A) and PyA3UA (B) at 2 μM concentration in MeOH and MeOH–water (from 90/10 (v/v) to 10/90 (v/v)) solutions. | ||
In comparison, the absorption spectra of PyA3UA are much less perturbed by water addition, maintaining almost the same spectral features in all m/w solutions investigated.
A quantitative assessment of the spectral perturbation induced by water addition to methanol solutions can be established by analyzing the modification of the peak-to-valley ratio (PA) and the shift of the wavelength maxima (Δλp) of the pyrene La transition with respect to the values measured in a 100% methanol solution (Table 1).
| Sample | Parameter | 100/0 (v/v) | 70/30 (v/v) | 10/90 (v/v) |
|---|---|---|---|---|
| PyA5 | P A | 2.2 ± 0.2 | 1.3 ± 0.3 | 1.1 ± 0.1 |
| Δλp (nm) | 1 ± 1 | 3 ± 1 | ||
| PyA3UA | P A | 3.0 ± 0.1 | 2.9 ± 0.2 | 2.6 ± 0.3 |
| Δλp (nm) | 0 | 0 |
Low PA values and red-shifted λp's are characteristic of aggregated species.20 It can be seen that both the PA and Δλp parameters are strongly affected by water addition in the case of PyA5, but not for the Aib-substituted pentapeptide (PyA3UA).
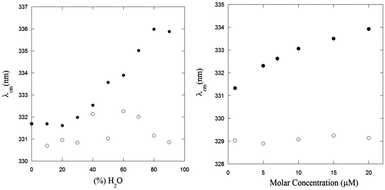
The effect of the aggregation process on the UV-Vis absorption spectra can be also analyzed by taking into account the dependence of the spectral center of mass (λcm) of the La absorption band on the fraction of water in MeOH–water solutions (Fig. 2, left panel) and the peptide concentration in the μM range (Fig. 2, right panel):
In both experiments, the λcm values of PyA3UA are almost the same, while those of PyA5 markedly increase upon enhancing the fraction of water or the peptide concentration in a MeOH–water solution. Interestingly, the increment of the PyA5 λcm with the water fraction in MeOH–water solutions shows a sigmoidal trend that highlights the cooperative character of the aggregation process driven by a hydrophobic effect. In contrast, the dependence of the aggregation process on the peptide concentration follows a parabolic asymptotic trend, typical of a seed-dependent fibril growth.34
Steady-state and time-resolved fluorescence
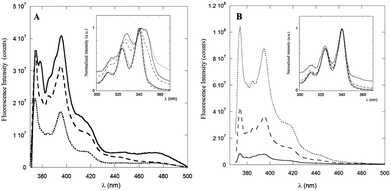
The steady-state fluorescence spectra of PyA5 and PyA3UA at μM concentration in 100/0 (v/v), 70/30 (v/v) and 10/90 (v/v) MeOH–water solutions are reported in Fig. 3. Interestingly, the fluorescence intensity of PyA5 (Fig. 3A) shows a remarkable quenching with increase in the water fraction, suggesting the onset of Py⋯Py interactions in the peptide aggregates. It should be noted that the fluorescence intensity of PyA3UA (Fig. 3B) in the same concentration range markedly increases with the rise of the water content, because of the less efficient oxygen quenching in aqueous solutions.The excitation spectra of PyA5 (inset of Fig. 3A) also give important insights into the aggregation process. When the excitation spectrum of PyA5 was measured at λem = 390 nm (monomer emission), strictly overlapping excitation and absorption spectra were found for all MeOH–water solutions. In contrast, measurement of the excitation spectrum at λem = 460 nm (excimer emission) showed that excitation bands markedly shifted to the red region of the absorption spectrum were obtained. This finding is typically observed in the case of the presence of J-aggregates.4,20
When two chromophores interact at a close distance, two new excitonic bands of different symmetry and energy may be generated, which are usually associated with aggregated species of different structures, denoted as H- (sandwiched dimers) and J-aggregates (parallely slipped-out dimers). In H-aggregates, the relaxation to the ground state is symmetry-forbidden and most of the excitation energy is lost via non-radiative thermal processes, leading to non-fluorescent aggregates.
The strong quenching of the fluorescence emission of PyA5 suggests that most of the Py⋯Py aggregates adopt a face-to-face sandwiched (H-like) geometry. In contrast, J-aggregates give rise to a characteristic red-shifted fluorescence emission that we observed in all of the solutions investigated as a broad band of low intensity peaked approximately at 460 nm. It was claimed that these structures are typical of the fibrillization of aromatic oligopeptides.35 Emission peaks at 453 nm were indicated as a proof of dimerization of Py groups and efficient aromatic⋯aromatic interactions between Py groups in hydrogels formed by Py-functionalized oligopeptides.5
A distinction between excited-state dimers (excimers) and H- or J-type aggregates is that in the latter case the Py groups are sufficiently close that they exhibit perturbed absorption and excitation spectra.20 PyA3UA features a completely different behavior with respect to PyA5, as clearly shown in the inset of Fig. 3B. In this case, no relevant changes were observed in the excitation spectra of the MeOH–water solutions investigated at both emission wavelengths.
The dependence of the emission properties of PyA5 and PyA3UA on peptide concentration was also characterized by steady-state fluorescence measurements in 70/30 (v/v) MeOH–water solutions. As shown in Fig. 4A, the emission of PyA5 markedly decreases with increasing peptide concentration, while in the same concentration range PyA3UA features emission spectra of equal intensity and shape in the full range of the peptide concentrations investigated. This finding further highlights the different aggregation properties of the two peptides under the same experimental conditions.
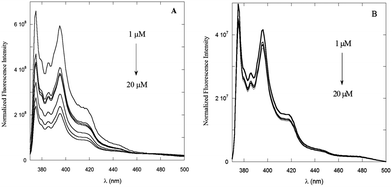 | ||
| Fig. 4 Fluorescence spectra of PyA5 (A) and PyA3UA (B) in 70/30 (v/v) MeOH–water solutions varying the peptide concentration from 1 to 20 μM. | ||
Time-resolved fluorescence measurements also revealed important differences between the aggregation propensities of the two peptides investigated. The time decay parameters, obtained by a multiexponential analysis of the experimental fluorescence decays, i.e.
 | (1) |
| τ 1 | α 1 | τ 2 | α 2 | τ 3 | α 3 | <τ> | ||
|---|---|---|---|---|---|---|---|---|
| PyA5 | MeOH | 4.5 | 0.29 | 18.8 | 0.71 | 17.5 | ||
| 70/30 (v/v) | 2.9 | 0.21 | 16.2 | 0.11 | 75.7 | 0.68 | 72.9 | |
| 10/90 (v/v) | 2.3 | 0.51 | 19.5 | 0.10 | 122.6 | 0.38 | 115.3 | |
| PyA3UA | MeOH | 6.0 | 0.14 | 18.9 | 0.86 | 18.3 | ||
| 70/30 (v/v) | 6.4 | 0.13 | 76.8 | 0.87 | 75.9 | |||
| 10/90 (v/v) | 6.7 | 0.08 | 140.7 | 0.92 | 140.1 |
On the other hand, PyA5 shows a complex, three-component time decay. Besides the long lifetime, typical of the unperturbed Py fluorophore, two short time decays were detected, suggesting heterogeneous aggregation. If one compares the populations of the aggregated species, proportional to the pre-exponential αi factors weighting the short time components in eqn (1), it appears that for PyA3UA the fraction of aggregates never exceeds 14% and is almost the same in the different environments. In contrast, in the case of PyA5, the fraction of aggregates increases from 29% in pure MeOH to 32% in 70/30 (v/v) and to 61% in 10/90 (v/v) MeOH–water solutions.
It should be noted that the average lifetime <τ>, proportional to the fluorescence quantum yield, steadily increases with increase in the water content in MeOH–water solutions for both peptides, as a result of the lower efficiency of oxygen quenching in aqueous solutions. A comparison of time-resolved and steady-state fluorescence experiments for PyA5 indicates that most of the aggregated species are non-fluorescent, suggesting a predominant face-to-face arrangement (H-type aggregates) of the interacting Py groups.
Further information from fluorescence experiments can be obtained by the ThT binding assay. The fluorescence intensity of ThT is known to strongly increase when this dye binds to β-sheet peptide structures. It is for this reason that the ThT assay has been widely applied to the detection of amyloid fibril formation.22 On adding ThT to μM solutions of PyA5 and PyA3UA in 70/30 (v/v) MeOH–water, no significant change in the ThT fluorescence was observed in the case of PyA3UA, while its intensity almost doubled when it was added to PyA5 solutions (Fig. 5). This result strongly suggests that PyA5, but not PyA3UA, forms β-sheet ladders in a 70/30 (v/v) MeOH–water solution at μM concentrations.
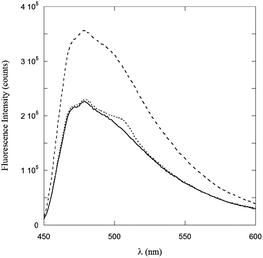 | ||
Fig. 5 ThT fluorescence spectra in a 70/30 (v/v) MeOH–water solution (full line), and in 2![[thin space (1/6-em)]](https://www.rsc.org/images/entities/char_2009.gif) : :![[thin space (1/6-em)]](https://www.rsc.org/images/entities/char_2009.gif) 1 solutions of PyA5–ThT (dashed line) and PyA3UA–ThT (dotted line). 1 solutions of PyA5–ThT (dashed line) and PyA3UA–ThT (dotted line). | ||
Circular dichroism
Dramatic differences were observed in the CD spectra of PyA5 and PyA3UA in MeOH and MeOH–water solutions in the UV region (Fig. 6). While the former peptide gives rise to well structured CD bands, dominated by the Py electronic transitions, PyA3UA shows the typical dichroic signal of a peptide in a random coil conformation. The strong induced Cotton effect on the Py chromophore in PyA5 suggests that the Ala-based pentapeptide attains a stable secondary structure promoting Py⋯Py interactions at such a close distance to cause intense exciton coupling between the chromophores. In contrast, the CD spectrum of PyA3UA, typical of a random coil conformation, exhibits very weak induced chirality effects on the Py chromophore and no evidence of exciton splitting in the absorption region of the aromatic moieties. A comparison of Fig. 1A and 6A shows that the complex CD spectrum of PyA5 faithfully follows the Py absorption features in the UV region. In particular, PyA5 exhibits an intense exciton splitting of the vibronic absorption bands at 330 and 343 nm, which indicates short-range Py⋯Py interactions. Unfortunately, the far-UV region of the PyA5 CD spectrum cannot give any useful information on the peptide secondary structure, because the amide transitions are overlapped by the intense CD signals originating from the Py exciton splitting.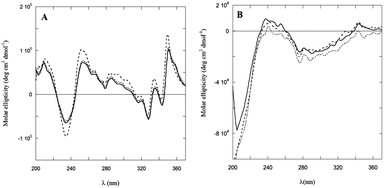 | ||
| Fig. 6 CD spectra of PyA5 (A) and PyA3UA (B) in MeOH (full line) and in 70/30 (v/v) (dashed line) and 10/90 (v/v) (dotted line) MeOH–water solutions. | ||
Infrared absorption spectroscopy
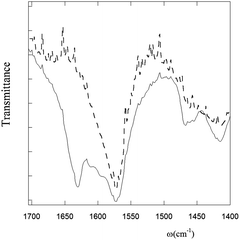
IR-ATR measurements on PyA5 and PyA3UA were carried out by depositing 70/30 (v/v) MeOH–water peptide solutions (2 μM) on a zinc selenide crystal. The most important differences between the two compounds can be observed in the amide region of the IR absorption spectrum, where both peptides show a band at 1570 cm−1 (amide II), but only PyA5 features a distinct band at 1631 cm−1, characteristic of the amide I of peptide groups involved in the β-sheet conformation (Fig. 7).1,14,16–18,36In summary, all spectroscopic results (UV-Vis absorption, fluorescence, CD, and IR absorption) consistently indicate that a single Aib vs. Ala substitution strongly affects the aggregation properties of the peptide investigated, inhibiting the formation of the β-sheet structure.
Atomic force microscopy
AFM measurements of peptide aggregates revealed a wide variety of shapes, ranging from linear assemblies to forms characterized by a different extent of branching. Using AFM, fibrinogen molecules were visualized in a compact form as globules or in an extended form with a visible domain structure.37 Mica was selected as the best substrate because fibrinogen molecules retained their domain structure. The shape and size of globular aggregates forming on mica resembled those of individual domains in protofibrillar species, supporting the hypothesis that protofibrils were formed through the association of globular species.38 AFM studies on the evolution of amyloid fibers over multiple length scales revealed a hierarchical self-assembly process from protofibrils (2–4 nm high and 15–30 nm wide) to fibrils (6–10 nm high and 60–120 nm wide) to micrometric fibers.39 Hierarchical self-assembly of peptides from β-sheet tapes to fibers was theoretically modeled by Aggeli et al.40In our study, 2 μM solutions of PyA5 and PyA3UA in 70/30 (v/v) MeOH–water were incubated on mica for AFM imaging. In the case of PyA5, morphological analysis revealed the formation of fibrils of length up to 2 μm, while PyA3UA was shown to form predominantly nanometric globular structures. As for the latter, short fibrils were also rarely spotted in restricted regions of the mica surface (ESI).†
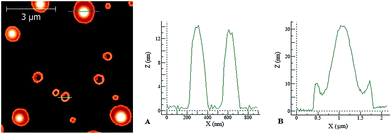
When the concentration of the deposition solution was increased to 10 μM, more evident and interesting differences between the two peptides were observed. Under these conditions, in the case of PyA5 very long spaghetti-like fibrils were seen (Fig. 8), while PyA3UA formed micrometric globular structures with a diameter up to 2 μm (Fig. 9).
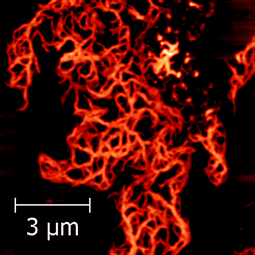 | ||
| Fig. 8 AFM image of a dried PyA5 film on mica. Deposition solution: 10 μM in a 70/30 MeOH–water solution. | ||
In the latter case, the height profiles reported on the right side of Fig. 9 reveal the occurrence of two types of aggregates: empty circular (doughnut-like) structures enclosed by a nanometric peptide layer and micrometric pancake-like structures with a protruding central bump and slightly raising borders.
Interestingly, aromatic dipeptides containing a conformationally constrained α,β-di-dehydrophenylalanine residue were found to self-assemble into hollow nanovesicles with a mean diameter of 370 nm and a relatively narrow size range (250–450 nm).41
Molecular dynamics
The aim of this MD investigation was to assess the ability of each peptide model studied to retain a coherent β-sheet organization as indirect evidence of its ability to form stable assemblies based on this 3D-structural motif. From a conformational stand point, several parameters can be investigated in order to evaluate the stability of multi-strand β-sheets, mainly related to the geometry of this particular secondary structure. It should be noted that none of those parameters alone are sufficient to actually ascertain the inner stability of such assemblies.Among these parameters, the most straightforward approach is computing the interchain distances, since it has been reported that multi-strand β-sheets show an averaged interstrand distance that ranges from 4.5 Å to 5.5 Å.1,40 Thus, for each case and independent of the specific arrangement of each system, such a separation must be evaluated when calculating the interstrand distances throughout the simulated time. For this purpose, we computed the accumulated radial distribution (g(r)) of the distances between strands using the Cα-atoms as reference points.
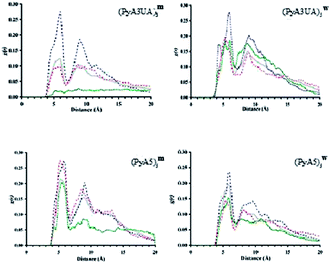
Fig. 10 illustrates the g(r) values for the two peptide systems in the MeOH and water environments at different slice times and for the 15 ns simulation. The first remarkable feature that emerges at the beginning of each simulation, independent of the simulated environment, is the presence of two discrete peaks around 4.5 and 9 Å, respectively. The former distance corresponds to the interstrand distance in a standard β-sheet motif, while the latter peak is also part of this same organization, since it corresponds to the distance between the first and third strands within a well ordered β-sheet structure.
It can be seen that, after a few nanoseconds of simulation, this peak either critically diminishes or just vanishes. Visual inspection of snapshots of the organization of each peptide system with time shows that none of them is able to preserve more than two strands associated in a coherent fashion. The evolution of the Cα⋯Cα distance profile clearly indicates that (PyA3UA)5 is partially (in water) and totally (in MeOH) unable to form coherent assemblies, as can be deduced by the loss of the signal around 4.5 Å, in fair agreement with the experimental results.
However, this peptide presents a different aggregation behavior depending on the solvent properties: while the initial assembly completely disappears after 15 ns in MeOH, the hydrophobic effect that the Py groups experience in water seems to induce the formation of amorphous aggregates. This behavior explains how the signals around 5 Å and 9 Å are still present at the end of the simulation, even though they are now manifested as a mixture of peaks centered around the previously mentioned distances.
The PyA5 peptide, in contrast, is able to maintain the strands properly associated throughout the entire simulations, at least in terms of strand pairs. Although, in both solvents there is a clear tendency for the global organization of the sheets to vanish, the profile obtained with (PyA5)5w denotes an inherent tendency to laterally associate, which is an additional degree of organization already shown to occur in fibrillar aggregates of polypeptides. Despite the disappearance of the 9 Å signal, in water a new peak appears around 10–10.5 Å that is characteristic of lateral association of two or more sheets. Indeed, visual inspection of the simulation after 15 ns shows the incipient formation of this type of organization.
To confirm our initial hypothesis, a complete scan of the interstrand H-bonds was performed on all of the simulated peptide systems. If one or more segments of a sheet are stable, they would be identified by the presence of characteristic interchain interactions throughout the simulated time. Therefore, the averaged distance of each initially present H-bond and the total time in which each interaction occurred were computed for the total time examined (ESI†). The initial hypothesis concerning the PyA3UA assemblies was confirmed when studying the H-bond behavior. In MeOH, the longest residence time for most H-bonds does not exceed 7 ns, with the exception of those interactions taking place at the N-terminal position of the strands, preferably between the first and second strands. This behavior is also observed during the (PyA3UA)5w simulation, in which the N-terminal interactions are preserved for almost the entire simulation. On the other hand, all interstrand H-bonds that were initially formed between residues placed at the C-terminal site of each strand were systematically lost, independent of the nature of the solvent. This feature clearly indicates that the Aib residue disfavors the onset of β-sheet organization, as expected for the extra steric hindrance introduced by substituting a H-atom on Cα for a bulky methyl group.
The simulation outcome, when PyA5 was studied, showed a much higher tendency towards the stabilization of the assemblies based on the β-sheet motif, as the increase in the number of preserved H-bonds suggests. In MeOH, 20% of the initial H-bonds were maintained for at least 10 ns. This proportion rose up to 45% when the simulation was performed in water.
These results are in excellent agreement with the experimental observations that showed an increase in the presence of PyA5 aggregates from 29% to 61% when the environment shifted from 30% to 90% of water content in MeOH–water solutions.
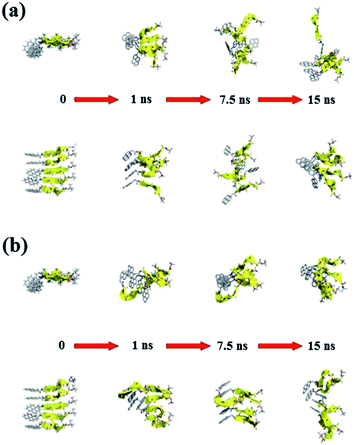
Fig. 11 and 12 report the time-dependent structural evolution of (PyA3UA)5 and (PyA5)5, respectively. Independent of the environment, it should be noted that PyA3UA is unable to maintain a coherent organization of the strands. In MeOH, the disaggregation of the molecular system is favored, driven by the solubilization of independent peptide strands.
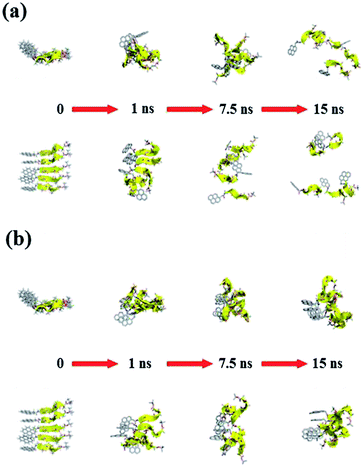 | ||
| Fig. 12 Consecutive snapshots with equal time intervals for both (a) (PyA5)5m and (b) (PyA5)5w. Equatorial and axial projections are included (top and bottom, respectively). Colors and representations follow the specifications detailed in Fig. 11. | ||
The remaining part of the aggregate is based on stacking motifs of the aromatic heads.
This sort of interaction becomes the driving force of the aggregation when the polarity of the environment increases: (PyA3UA)5w reaches an organization that is incompatible with β-sheets, forming an amorphous aggregate that structurally evolves over π–π interactions between aromatic groups.
Fig. 12 shows that the preferential tendency to form aromatic-driven aggregates is maintained in the systems formed by the (PyA5)5 peptide assembly. Even though this peptide is able to preserve part of the original H-bonding pattern in both MeOH and water, the coherent organization of the initial sheet is always lost by the movement of one or more strands pivoting around the clustered aromatic heads. The events presented in Fig. 12b are exemplary: an edge strand pivots around the axis parallel to the sheet and splits it into two double-stranded mini-sheets, when the detached chain makes attempts to improve the interaction geometry of its aromatic group. The final organization keeps the H-bonding pattern for the two mini-sheets but at the cost of disrupting the sheet frame.
At this point, all simulated systems have shown a common and converging feature: the formation of very strong aromatic interactions at the N-termini of the strands, as a consequence of the structural and electronic properties of the Py group.
Table 3 confirms this particular observation: in both peptide assemblies investigated, stacking interactions are seen between at least two Py groups, independent of the solvent. In MeOH, for at least one-third of the simulated time, this interaction is present between the originally aligned strands. Moreover, when rearrangements were studied (data not shown), we detected this kind of interaction between Py groups belonging to strands that were not consecutive at the beginning of the simulation (Fig. 11).
| Methanol | Water | ||||
|---|---|---|---|---|---|
| τ (ns) | <D> (Å) | τ (ns) | <D> (Å) | ||
| a The presence of a stacking interaction was assessed by a geometric cutoff. An interaction was computed when the distance between the mass centers of two neighboring Py groups was equal to or smaller than 5.5 Å. | |||||
| (PyA3UA)5 | st2–st1 | 6.02 | 4.72 ± 0.52 | 14.86 | 4.63 ± 0.47 |
| st3–st2 | 4.90 | 4.79 ± 0.50 | 0.18 | 5.84 ± 0.16 | |
| st4–st3 | 3.65 | 4.84 ± 0.64 | 14.55 | 4.52 ± 0.49 | |
| st5–st4 | 0.95 | 4.72 ± 0.54 | 8.05 | 4.15 ± 0.51 | |
| (PyA5)5 | st2–st1 | 5.39 | 4.74 ± 0.52 | 14.27 | 4.33 ± 0.51 |
| st3–st2 | 1.94 | 4.54 ± 0.48 | 12.60 | 4.67 ± 0.46 | |
| st4–st3 | 8.02 | 4.78 ± 0.55 | 13.91 | 4.52 ± 0.53 | |
| st5–st4 | 6.10 | 4.68 ± 0.53 | 14.92 | 4.44 ± 0.40 | |
It is worth noting that the average distances obtained in these molecular simulations are significantly higher than the observed pyrene–pyrene distances in ordered solids. However, this apparent discrepancy does not reduce the incidence of this kind of interaction in the studied cases: our models are at least two or three orders of magnitude smaller than real solid assemblies. This fact allows the peptide chains to present a high degree of structural flexibility that makes the pyrene groups adopt interaction orientations that differ from the standard π-stacking in the solid state. Nonetheless, quantum mechanics calculations performed on aromatic moieties have demonstrated that asymmetrical orientations have a low impact on the interaction strength.42,43
In water, hydrophobic effects hinder the loss of the original assembly, with a special impact on the organization of the Py groups. They not only remained associated for most of the simulated time in both the (PyA3UA)5 and (PyA5)5 systems, but are also capable of maintaining the original interacting pairs. (PyA5)5w shows that the original stacking is preserved for almost all the simulation and only the delocalization of the first strand during the last part of the simulation challenged the integrity of the initial β-sheet.
Despite our small aggregate systems, which are a few orders of magnitude away from the actual conditions of fibril formation, the results presented here well reproduce the basic inner tendencies of the two peptides examined. As expected from the experimental data, the Aib residue disfavors the formation of β-sheet multi-layers, due to the increased steric hindrance that the two side chains impose over the proximal strands within the sheet. In contrast, peptides that are only formed by Ala residues permit the formation of sufficiently stable β-sheets. Also, their small length is compensated for by the great tendency of the Py groups to interact with themselves, forming a stacking network that facilitates the preservation of β-sheet motifs for a time long enough to finally promote the growth of amyloid-like fibrils.
Discussion
The spectroscopic and computational results reported in this work highlight three different features of the peptide aggregation process: (i) relevance of the interfacial phenomena, namely solvation (hydrophobic) effects; (ii) role of the conformational landscape of the peptide main and side chains; and (iii) role of aromatic⋯aromatic interactions. These issues are particularly relevant in the formation of amyloid structures that attain their stability through non-covalent interactions, notably H-bonds, hydrophobic effects, and π–π stacking.44,45The importance of the hydrophobic effect in amyloid fibril formation is obvious, because it is principally a process leading to polypeptide aggregation and precipitation. In our study, peptide aggregation is triggered by increasing of the water content in MeOH–water solutions.
UV-Vis absorption and fluorescence experiments suggest that the aggregation of PyA5 at μM concentrations takes place with a characteristic sigmoid trend that shows an inflection point for ∼50/50 (v/v) MeOH–water solutions. However, although necessary to induce peptide aggregation, hydrophobic effects do not tell the full story, as testified by PyA3UA, the behavior of which is almost independent of the water content of the solvent mixtures investigated. A comparison of the aggregation properties of PyA5 and PyA3UA clearly indicates the dramatic effect of a single Ala-to-Aib replacement. This result is of interest because the search for β-breaker compounds is currently a promising approach for the development of new therapies for Alzheimer's and other neurodegenerative diseases.
The insertion of a single Pro residue in the middle of long (Ala)n stretches has already been found to result in a peptide lacking β-sheet population.16a,b,46 This β-sheet disruptive effect of Pro was explained by the presence of the constrained pyrrolidine ring, which prevents an efficient packing of the multi-layered β-sheets. Aib, for its peculiar conformational properties, has been predicted to be an even stronger β-sheet breaking agent.14,15 The results reported above strongly support this conclusion.
The frequent occurrence of aromatic residues in amyloid-related peptides suggests that π-stacking may play a role in accelerating the self-assembly process and amyloid fibril formation, inter alia by providing geometrical restrictions that determine preferential orientation of the growing fibril. High-resolution X-ray diffraction and solid-state NMR analyses of amyloid fibers substantiated the contribution of aromatic amino acids to fibril assembly, highlighting the stacking of aromatic rings between layers of adjacent β-sheets.47 The order and directionality of π–π stacking were suggested to be the driving force for the efficient formation of ordered amyloid assemblies.42,48
Our UV-Vis absorption, fluorescence, and CD experiments emphasized the importance of Py⋯Py interactions. These results indicate that the aromatic moieties in PyA5 predominantly attain a face-to-face geometry. The MD results confirmed that aggregation, initially driven by aromatic interactions, evolves towards the formation of coherent assemblies of the peptide chains, when the steric requirements of the side chains allow the onset of such structures.
In the first stage of amyloid formation, two building blocks that contain aromatic residues form a dimeric structure, which is restricted by the allowed geometry of π–π stacking. This phenomenon is followed by a stepwise addition of further monomers containing the same recognition elements. This mechanism implies that the morphology of the mesoscopic aggregate is directed by the restricted geometries of the stacking interactions at a molecular level, which lead to the formation of elongated amyloid fibrils.
A peptide inhibitor that would contain an aromatic recognition element together with a fibril breaker residue (Aib, Pro) could bind soluble Aβ peptides and prevent formation of large aggregates. Amino acid side chains could play a fundamental role in this process and could also be responsible for the structural differences in fibers at an atomic level (side-chain and peptide packing) or at a macromolecular level (proto-filament packing). Interestingly, it has already been shown that insertion of a Pro residue in the middle of a peptide containing a Py group disrupts the aromatic⋯aromatic dimerization motif, thereby decreasing the biocompatibility of the hydrogelators.5 In addition, the MD simulations described in this work for PyA5 and PyA3UA in MeOH and water environments highlight the pivotal role of Aib in disrupting the lateral association of the peptide chains.
Conclusions
The results reported here clearly indicate that the morphology of the aggregates at the nano- and meso-scales can be finely tuned by a modification of the secondary structure of the peptide building blocks. As peptide fibrillization is a hierarchical process, the conformational properties of the single peptide element propagate to the final 3D-structure.49 This conclusion results from the complex interplay of H-bonds, and van der Waals and aromatic⋯aromatic interactions occurring during the collapse of the peptide clusters seeding the growth of larger aggregates (nanorods, fibrils, nanotubes, nanodisks and nanovesicles) and depending on the operative conditions. Hydrophobic effects must also be taken into due account.In this paper, we confirmed the extremely potent action of Aib as a β-breaker α-amino acid,14,15 able to inhibit the formation of extended β-pleated sheet structures. In our opinion this finding may pave the way for the synthesis of new lead compounds with enhanced therapeutic efficacy against neurodegenerative diseases.
Acknowledgements
This work was supported by the Italian Minister of University and Research (MIUR), PRIN 2010–2011 no. 2010FM738P, ‘Photophysical and photochemical properties of organic and biological compounds in solution and in organized systems’.Notes and references
- I. W. Hamley, Angew. Chem., Int. Ed., 2007, 46, 8128–8147 CrossRef CAS PubMed.
- C. L. Chen and N. L. Rosi, Angew. Chem., Int. Ed., 2010, 49, 1924–1942 CrossRef CAS PubMed.
- I. W. Hamley, Soft Matter, 2011, 7, 4122–4138 RSC.
- F. Würthner, T. E. Kaiser and C. R. Saha-Möller, Angew. Chem., Int. Ed., 2001, 50, 3376–3410 CrossRef PubMed.
- M. Ma, Y. Kuang, Y. Gao, Y. Zhang, P. Gao and B. Xu, J. Am. Chem. Soc., 2010, 132, 2719–2728 CrossRef CAS PubMed.
- (a) M. Reches and E. Gazit, Science, 2003, 300, 625–627 CrossRef CAS PubMed; (b) C. H. Görbitz, Chem. Commun., 2006, 2332–2334 RSC.
- N. Amdursky, P. Beker and G. Rosenman, in Peptide Materials: From Nanostructures to Applications, ed. C. Aleman, A. Bianco and M. Venanzi, Wiley, Chichester, U.K., 2013, ch. 1, pp. 1–37 Search PubMed.
- R. Linding, J. Schymkowitz, F. Rousseau, F. Diella and L. Serrano, J. Mol. Biol., 2004, 342, 345–353 CrossRef CAS PubMed.
- (a) K. A. Conway, J. D. Harper and P. T. Lansbury, Nat. Med., 1998, 4, 1318–1320 CrossRef CAS PubMed; (b) C. G. Glabe, Neurobiol. Aging, 2006, 27, 570–575 CrossRef CAS PubMed.
- J. C. Rochet and P. T. Lansbury, Curr. Opin. Struct. Biol., 2000, 10, 60–68 CrossRef CAS.
- B. Caughey and P. T. Lansbury, Annu. Rev. Neurosci., 2003, 26, 267–298 CrossRef CAS PubMed.
- I. W. Hamley, Chem. Rev., 2012, 112, 5147–5192 CrossRef CAS PubMed.
- (a) C. Soto, Nat. Rev., 2003, 4, 49–60 CrossRef CAS PubMed; (b) C. Soto, FEBS Lett., 2001, 498, 204–207 CrossRef CAS.
- (a) V. Moretto, M. Crisma, G. M. Bonora, C. Toniolo, H. Balaram and P. Balaram, Macromolecules, 1989, 22, 2939–2944 CrossRef CAS; (b) F. Formaggio, A. Bettio, V. Moretto, M. Crisma, C. Toniolo and Q. B. Broxterman, J. Pept. Sci., 2003, 9, 461–466 CrossRef CAS PubMed; (c) C. Adessi, M.-J. Frossard, C. Boissard, S. Fraga, S. Bieler, T. Ruckle, F. Vilbois, S. M. Robinson, M. Mutter, W. A. Banks and C. Soto, J. Biol. Chem., 2003, 278, 13905–13911 CrossRef CAS PubMed; (d) D. Haldar, M. G. B. Drew and A. Banerjee, Tetrahedron, 2006, 62, 6370–6378 CrossRef CAS PubMed.
- S. Gilead and E. Gazit, Angew. Chem., Int. Ed., 2004, 43, 4041–4044 CrossRef CAS PubMed.
- (a) C. Toniolo, G. M. Bonora, M. Mutter and V. N. Rajasekharan Pillai, Makromol. Chem., 1981, 182, 2007–2014 CrossRef CAS; (b) M. Narita, S. Isokawa, M. Doi and R. Wakita, Bull. Chem. Soc. Jpn., 1986, 59, 3547–3552 CrossRef CAS.
- (a) J. Wang, S. Han, G. Meng, H. Xu, D. Xia, X. Zhao, R. Schweins and J. R. Lu, Soft Matter, 2009, 5, 3870–3879 RSC; (b) T. J. Measey, K. B. Smith, S. M. Decatur, L. Zhao, G. Yang and R. Schweitzer-Stenner, J. Am. Chem. Soc., 2009, 131, 18218–18219 CrossRef CAS PubMed; (c) C. Toniolo, G. M. Bonora and M. Mutter, Makromol. Chem., 1975, 176, 2547–2558 CrossRef CAS; (d) C. Toniolo and M. Palumbo, J. Polym. Sci., Polym. Chem. Ed., 1976, 14, 515–518 CrossRef CAS; (e) M. Palumbo, S. Da Rin, G. M. Bonora and C. Toniolo, Makromol. Chem., 1976, 177, 1477–1492 CrossRef CAS; (f) G. M. Bonora, C. Toniolo and M. Mutter, Polymer, 1978, 19, 1382–1386 CrossRef CAS; (g) C. Toniolo, G. M. Bonora and M. Mutter, J. Am. Chem. Soc., 1979, 101, 450–455 CrossRef CAS; (h) G. M. Bonora, M. Palumbo, C. Toniolo and M. Mutter, Makromol. Chem., 1979, 180, 1293–1304 CrossRef CAS.
- (a) S. E. Blondelle, B. Forood, R. A. Houghten and E. Perez-Paya, Biochemistry, 1997, 36, 8393–8400 CrossRef CAS PubMed; (b) M. Gasset, M. A. Baldwin, D. H. Lloyd, J. M. Gabriel, D. M. Holtzman, F. Cohen, R. Fletterick and S. B. Prusiner, Proc. Natl. Acad. Sci. U. S. A., 1992, 89, 10940–10944 CrossRef CAS.
- (a) V. Castelletto, D. R. Nutt, I. W. Hamley, S. Bucak, Ç. Cenker and U. Olsson, Chem. Commun., 2010, 46, 6270–6272 RSC; (b) D. A. Middleton, J. Madine, V. Castelletto and I. W. Hamley, Angew. Chem., 2013, 125, 10731–10734 CrossRef.
- F. M. Winnik, Chem. Rev., 1993, 93, 587–614 CrossRef CAS.
- L. A. Carpino, J. Am. Chem. Soc., 1993, 115, 4397–4398 CrossRef CAS.
- (a) R. Kurana, C. Coleman, C. Inaescu-Zanetti, S. A. Carter, V. Krishna, R. K. Grover, R. Roy and S. Singh, J. Struct. Biol., 2005, 151, 229–238 CrossRef PubMed; (b) K. J. Robbins, G. Liu, V. Selman and N. D. Lazo, Langmuir, 2012, 28, 16490–16495 CrossRef CAS PubMed.
- Y. Duan, C. Wu, S. Chowdhury, M. C. Lee, G. M. Xiong, W. Zhang, R. Yang, P. Cieplak, R. Luo, T. Lee, J. Caldwell, J. Wang and P. A. Kollman, J. Comput. Chem., 2003, 24, 1999–2012 CrossRef CAS PubMed.
- W. L. Jorgensen, J. Chandrasekhar, J. D. Madura, R. W. Impey and M. L. Klein, J. Chem. Phys., 1983, 79, 926–935 CrossRef CAS PubMed.
- M. J. Frisch, G. W. Trucks, H. B. Schlegel, G. E. Scuseria, M. A. Robb, J. R. Cheeseman, G. Scalmani, V. Barone, B. Mennucci, G. A. Petersson, H. Nakatsuji, M. Caricato, X. Li, H. P. Hratchian, A. F. Izmaylov, J. Bloino, G. Zheng, J. L. Sonnenberg, M. Hada, M. Ehara, K. Toyota, R. Fukuda, J. Hasegawa, M. Ishida, T. Nakajima, Y. Honda, O. Kitao, H. Nakai, T. Vreven, J. A. Montgomery, Jr, J. E. Peralta, F. Ogliaro, M. Bearpark, J. J. Heyd, E. Brothers, K. N. Kudin, V. N. Staroverov, R. Kobayashi, J. Normand, K. Raghavachari, A. Rendell, J. C. Burant, S. S. Iyengar, J. Tomasi, M. Cossi, N. Rega, J. M. Millam, M. Klene, J. E. Knox, J. B. Cross, V. Bakken, C. Adamo, J. Jaramillo, R. Gomperts, R. E. Stratmann, O. Yazyev, A. J. Austin, R. Cammi, C. Pomelli, J. W. Ochterski, R. L. Martin, K. Morokuma, V. G. Zakrzewski, G. A. Voth, P. Salvador, J. J. Dannenberg, S. Dapprich, A. D. Daniels, Ö. Farkas, J. B. Foresman, J. V. Ortiz, J. Cioslowski and D. J. Fox, Gaussian 09, Revision A.1, Gaussian, Inc., Wallingford CT, 2009 Search PubMed.
- (a) G. Cui and C. Simmerling, J. Am. Chem. Soc., 2002, 124, 12154–12164 CrossRef CAS PubMed; (b) V. A. Karachevtsev, S. G. Stepanian, A. Y. Glamazda, M. V. Karachevtsev, V. V. Eremenko, O. S. Lytvyn and L. Adamowicz, J. Phys. Chem. C, 2011, 115, 21072–21082 CrossRef CAS.
- D. Zanuy, F. Rodriguez-Ropero, R. Nussinov and C. Aleman, J. Struct. Biol., 2007, 160, 177–189 CrossRef CAS PubMed.
- A. Toukmaji, C. Sagui, J. Board and T. Darden, J. Chem. Phys., 2000, 113, 10913–10927 CrossRef CAS PubMed.
- J. C. Phillips, R. Braun, W. Wang, J. Gumbart, E. Tajkhorshid, E. Villa, C. Chipot, R. D. Skeel, L. Kale and K. Schulten, J. Comput. Chem., 2005, 26, 1781–1802 CrossRef CAS PubMed.
- H. J. C. Berendsen, J. P. M. Postma, W. F. van Gunsteren, A. Di Nola and J. R. Haak, J. Chem. Phys., 1984, 81, 3684–3690 CrossRef CAS PubMed.
- S. Toxvaerd, J. Chem. Phys., 1990, 93, 4290–4295 CrossRef CAS PubMed.
- G. J. Martyna, D. L. Tobia and M. L. Klein, J. Chem. Phys., 1994, 101, 4177–4189 CrossRef CAS PubMed.
- S. E. Feller, Y. Zhang, R. W. Pastor and B. R. Brooks, J. Chem. Phys., 1995, 103, 4613–4622 CrossRef CAS PubMed.
- T. Ban, K. Yamaguchi and Y. Goto, Acc. Chem. Res., 2006, 39, 663–670 CrossRef CAS PubMed.
- A. N. Smith, R. J. Williams, C. Tang, P. Coppo, R. C. Collins, M. L. Turner, A. Saiani and R. V. Ulijn, Adv. Mater., 2008, 20, 37–41 CrossRef CAS.
- (a) C. Toniolo and M. Palumbo, Biopolymers, 1977, 16, 219–224 CrossRef CAS PubMed; (b) M. H. Baron, C. de Lozé, C. Toniolo and G. D. Fasman, Biopolymers, 1978, 17, 411–424 CrossRef; (c) M. H. Baron, C. de Lozé, C. Toniolo and G. D. Fasman, Biopolymers, 1978, 17, 2225–2239 CrossRef CAS.
- E. G. Zavyalova, A. D. Protopova, A. M. Kopylov and I. Y. Yaminsky, Langmuir, 2011, 27, 4922–4927 CrossRef CAS PubMed.
- T. Kowalewski and D. M. Holtzman, Proc. Natl. Acad. Sci. U. S. A., 1999, 96, 3688–3693 CrossRef CAS.
- D. M. Ridgley and J. R. Barone, ACS Nano, 2013, 7, 1006–1015 CrossRef CAS PubMed.
- A. Aggeli, I. A. Nyrkova, M. Bell, R. Harding, L. Carrick, T. C. B. McLeish, A. N. Semenov and N. Boden, Proc. Natl. Acad. Sci. U. S. A., 2001, 98, 11857–11862 CrossRef CAS PubMed.
- A. Mishra, J. J. Panda, A. Basu and V. S. Chauhan, Langmuir, 2008, 24, 4571–4576 CrossRef CAS PubMed.
- S. Tsuzuki, K. Honda and R. Azumi, J. Am. Chem. Soc., 2002, 124, 12200–12209 CrossRef CAS PubMed.
- F. Rodriguez-Ropero, J. Casanovas and C. Aleman, J. Comput. Chem., 2008, 29, 69–78 CrossRef CAS PubMed.
- E. Gazit, FASEB J., 2002, 16, 77–83 CrossRef CAS PubMed.
- I. W. Hamley, G. D. Brown, V. Castelletto, G. Cheng, M. Venanzi, M. Caruso, E. Placidi, C. Aleman, G. Revilla-López and D. Zanuy, J. Phys. Chem. B, 2010, 114, 10674–10683 CrossRef CAS PubMed.
- B. Forood, E. Perez-Paya, R. A. Houghten and S. E. Blondelle, Biochem. Biophys. Res. Commun., 1995, 211, 7–13 CrossRef CAS.
- (a) E. Jack, M. Newsome, P. G. Stockley, S. E. Radford and D. A. Middleton, J. Am. Chem. Soc., 2006, 128, 8098–8099 CrossRef CAS PubMed; (b) O. S. Makin, E. Atkins, P. Sikorski, J. Johansson and L. C. Serpell, Proc. Natl. Acad. Sci. U. S. A., 2005, 102, 315–320 CrossRef CAS PubMed.
- W. Kim and M. H. Hecht, Proc. Natl. Acad. Sci. U. S. A., 2006, 103, 15824–15829 CrossRef CAS PubMed.
- M. Caruso, E. Placidi, E. Gatto, C. Mazzuca, L. Stella, G. Bocchinfuso, A. Palleschi, F. Formaggio, C. Toniolo and M. Venanzi, J. Phys. Chem. B, 2013, 17, 5448–5459 CrossRef PubMed.
Footnote |
| † Electronic supplementary information (ESI) available: (1) Peptide synthesis and characterization. (2) Partial charges of acetyl-pyrene and alanine tert-butyl ester. (3) Schematic representation of the 5-strand system (Scheme S1). (4) Average distances and total residence time of the H-bonds in PyA3UA and PyA5 strands (Table S1). (5) AFM imaging of the PyA3UA aggregates on a mica support. See DOI: 10.1039/c3sm52831f |
| This journal is © The Royal Society of Chemistry 2014 |

