 Open Access Article
Creative Commons Attribution 3.0 Unported Licence
Reversible helical unwinding transition of a self-assembling peptide amphiphile†
Ian W. Hamley*a,
Ashkan Dehsorkhia,
Valeria Castellettoa,
Steve Furzelandb,
Derek Atkinsb,
Jani Seitsonenc and
Janne Ruokolainenc
aDept of Chemistry, University of Reading, Whiteknights, Reading RG6 6AD, UK. E-mail: I.W.Hamley@reading.ac.uk
bColworth Discover-Unilever R&D, Sharnbrook MK44 1LQ, UK
cDept of Applied Physics, Aalto University School of Science, PO Box 15100, FI-00076 Aalto, Finland
First published on 19th August 2013
Abstract
A designed peptide amphiphile C16-KKFFVLK self-assembles into nanotubes and helical ribbons in aqueous solution at room temperature. A remarkable unwinding transition, leading to twisted tapes, is observed on heating. Nanotubes and ribbons re-form on cooling.
The formation of nanotubes by self-assembling systems continues to fascinate.1 Chiral self-assembly of twisted sheets and helical ribbons has also been studied for systems as diverse as seed pods,2 hexabenzocoronene derivatives,3 zinc oxide nanobelts,4 bile salts,5 gemini surfactants6 and peptides7 among others. The closure of helical ribbons is a possible mechanism for the formation of nanotubes, as suggested by experiments,5,6b,7b and various theories.8 Recently, “pulsating” tubules have been observed where the size of chiral tubules formed by noncovalent macrocycles can be switched thermally.9
We have discovered that a peptide amphiphile undergoes a reversible thermal transition between a state of predominantly nanotubes and helical ribbons and twisted tapes at higher temperature. Here, the nature of this remarkable transition is elucidated using a combination of microscopy, X-ray scattering and spectroscopic methods.
The peptide amphiphile (PA) has been designed based on the KLVFF core motif from the amyloid beta (Aβ) peptide.10 In the KKFFVLK heptapeptide sequence exploited here, the two F residues in KKFFVLK drive self-assembly through hydrophobic and π-stacking interactions.7a,b,11 Two additional lysine residues are incorporated between the hexadecanyl lipid chain and the KKFFVLK motif to promote solubility and impart amphiphilicity. This communication complements our recent report on the enzymatic degradation of this PA.12
Cryogenic transmission electron microscopy (cryo-TEM) is a powerful tool to image self-assembled structures, via cryo-vitrification of the aqueous medium. Fig. 1a and b show cryo-TEM images showing nanotubes of C16-KKFFVLK coexisting with helical ribbons at room temperature. The tube walls are extremely thin, less than 5 nm as indicated by images such as Fig. 1b. Fig. 1c and ESI Fig. 1† show twisted tapes which are the predominant structure at 55 °C. Additional cryo-TEM images are presented in ESI Fig. 1.†
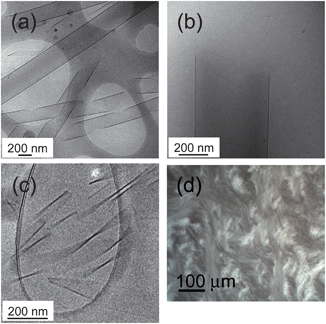 | ||
| Fig. 1 (a–c) Cryo-TEM images showing nanostructures from self-assembly of C16-FFKLVFF (1 wt%, i.e. 87 mM, solution) (a) single wall nanotubes coexisting with helical ribbons at 22 °C, (b) single wall nanotube at 22 °C, showing thin wall, (c) twisted tapes at 55 °C. (d) Birefringence texture in a polarized optical micrograph of a 2 wt% sample at 22 °C. | ||
Small-angle X-ray scattering (SAXS) was used to further probe the in situ self-assembled nanostructure. Fig. 2 presents data measured at 20 °C and 55 °C. The data at 20 °C can be fitted to a model form factor that consists of two contributions, one from nanotubes and the other from “lipid-like” bilayer structures. The fit indicates a nanotube radius R = 138 nm (with a very low polydispersity 2%) and a wall thickness 4.4 nm. The obtained nanotube radius is in good agreement with that estimated from cryo-TEM.
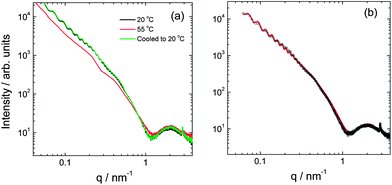 | ||
| Fig. 2 (a) SAXS data for a 1 wt% solution obtained at 20 °C, after heating to 55 °C and after cooling back to 20 °C. (b) Form factor fit (red line) using a nanotube model to fit the data (open circles) at 20 °C. | ||
On heating to 55 °C, the nanotube form factor oscillations disappear, leaving essentially a form factor profile from the helically wrapped PA bilayers. However, the nanotube form factor oscillations re-appear on cooling. The kinetics of this process was monitored, indicating that this process takes up to several hours, depending on the incubation time at 55 °C and the cooling rate.
The nanotubes exhibit spontaneous flow-induced alignment, as revealed by SAXS (Fig. 3a). This suggests nematic orientational ordering. This was confirmed by polarized optical microscopy (Fig. 1d and ESI Fig. 2,† showing thermo-reversibility of birefringence when the sample was heated to 55 °C and then cooled back to 22 °C). By SAXS, alignment was observed on flowing the sample through the capillary holder, and the extent of orientation could be increased by manually shearing by driving a delivery syringe back and forth. SAXS shows that orientation of the sample is retained on heating to 55 °C (ESI Fig. 3†), although alignment with respect to the flow direction is lost in the absence of shear forces. The form factor oscillations disappear (consistent with the 1D data in Fig. 2a). The extent of orientation as gauged by the anisotropy of the SAXS pattern appears greater at 55 °C (compare ESI Fig. 3b and a or d†). On cooling to 20 °C, the form factor oscillations reappear within 30 minutes, although they continue to develop for up to 9 h (ESI Fig. 3†).
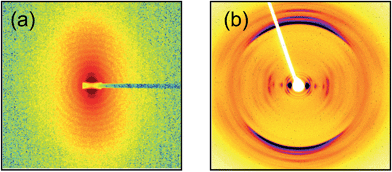 | ||
| Fig. 3 (a) SAXS data for a flow-aligned sample of 1 wt% C16-KKFFVLKFF at 20 °C, q scale: −0.3 to 0.3 nm−1. The flow direction is horizontal. The intensity is contoured on a logarithmic scale. (b) X-ray diffraction pattern obtained from a stalk dried from a 1 wt% sample (linear intensity scale). The fibril axis is vertical. The strong meridional reflection has a spacing 4.88 Å, and the spacing of other strong reflections is discussed in the text. | ||
X-ray diffraction on stalks prepared by drying also shows strong orientation, as well as features arising from the helical arrangement of the peptide strands within the tube wall (Fig. 3b). In particular, the prominent near-equatorial reflections with d = 2.68 nm, d = 2.25 nm and d = 1.09 nm are split off-axis, as are several weaker peaks with smaller d spacings. These coexist with on-axis equatorial reflections with d = 3.65, 1.87 and 1.23 nm. These correspond to the first, second and third order reflections respectively of a layered structure with spacing d = 3.7 nm. This value is very close (considering dehydration upon drying) to the nanotube wall thickness estimated from the fit to the SAXS form factor (Fig. 2a, actually it can be estimated from the broad maximum near q = 2 nm−1) and indicates that upon drying the sample for XRD, either the nanotubes collapse to give a multi-layer stack, or there is an increase in the population of multi-wall nanotubes. The d = 2.25 nm reflection spacing is very similar to that of the sharp Bragg peak in the SAXS data (Fig. 2) with d = 2.2 nm. The XRD pattern in Fig. 3b also features strong meridional reflections with d = 4.88 Å (v. strong) and 4.52 Å (strong) and 4.14 Å (strong). The main d spacing is that expected for the spacing of β-strands in a β-sheet structure. Further evidence for β-sheet structure is provided by FTIR (ESI Fig. 4†) which shows a peak in the amide I' region at 1625 cm−1.13 In addition, the uptake of thioflavin T (ThT) is observed for C16-KKFFVLK aggregates, consistent with the formation of “amyloid” β-sheet structures.14 As shown in ESI Fig. 5,† this technique was used to determine a low critical aggregation concentration (cac) of 0.012 wt%. The dye ThT is taken up selectively by β-sheet amyloid structures10c,15 however the mechanism of binding to amyloid has not been definitively identified. While some papers suggest ThT binds to β-sheet grooves, other research provides some evidence that the binding is dependent on electrostatic interactions or diameter-dependent binding to molecular grooves/cavities in β-sheet and other fibers.16 Electrostatic interactions between the cationic dye and the cationic PA here should hinder binding, although counterion effects may screen charge leading to predominant “steric” binding. The cac results show that at the concentrations at which self-assembly was studied by X-ray scattering and electron microscopy, the PA will be strongly aggregated.
The X-ray scattering data lead to a model in which the PA molecules form a highly interdigitated bilayer 4.4 nm thick. The estimated length of each C16-KKFFVLK molecule is 4 nm, assuming 3.2 Å per peptide residue in a parallel β-sheet.17 ESI Fig. 4† shows FTIR spectra which are consistent with this secondary structure (antiparallel β-sheets have an additional peak in the 1680–1690 cm−1 range).13b,18 Based on this estimation, it appears that only the C-terminal lysine protrudes from the lipid-rich hydrophobic bilayer core, in which the KKFFVL residues are also buried. The C16-KKFFVLK nanotubes are therefore expected to comprise lysine-rich surfaces.
The thermoreversible unwinding of the helical ribbons and nanotubes into twisted tapes (Fig. 4) involves a change in curvature of the PA bilayer. This may be driven by temperature-dependent changes in peptide solubility which may also be influence by thermally-induced changes in hydrogen bonding strength, both within the peptide β-sheets and also with the water solvent molecules. A role of pH is unlikely, since the pH does not change much from 2.89 at 20 °C to 2.73 at 55 °C for a 1 wt% solution. Estimates of the interaction energies within folding proteins suggest that aromatic stacking interaction energies are larger than those associated with hydrogen bonds or salt bridges19 and the F–F interactions here are likely to be significant. Consistent with this, CD spectra reveal remarkable pronounced temperature-dependent and reversible changes in the vibronic structure associated with phenylalanine (Fig. 5). The strong features in the CD spectra reflect the strongly chiral environment of the two F residues. The reduction in the magnitude of the ellipticity above 255 nm at 55 °C is consistent with the lower chirality of the unwrapped tapes. The CD spectra in the region sensitive to secondary structure are reported in our recent paper,12 unfortunately absorbance issues hindered temperature-dependent measurements in this region. Nevertheless, CD points to a likely role of changes in phenylalanine stacking as a driver for the observed transition.
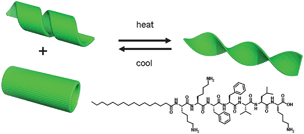 | ||
| Fig. 4 Schematic of the thermo-reversible transition, and (bottom right) structure of the peptide amphiphile. | ||
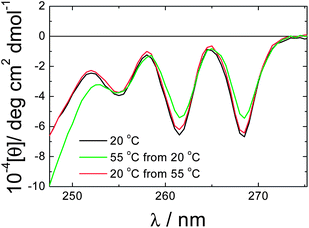 | ||
| Fig. 5 Circular dichroism spectra obtained from a 1 wt% solution of C16-KKFFVLK at the temperatures indicated. | ||
From a phenomenological perspective, the transition between twisted tapes and ribbons/nanotubes can be analysed using models for the elasticity of chiral membranes,6a although quantification would require estimates of the bending stiffness among other parameters which are not currently available for our system.
The thermally-induced unraveling of the nanotubes suggests possible applications in the release of encapsulated cargo. This might be useful in therapeutic applications, where the cationic functionality of the nanotube surface could be employed in targeted delivery. There also exists the potential to exploit the longitudinal expansion and contraction of the fibrillar structure that occurs when the helical ribbons unwind or refold upon heating/cooling. This could be localized if a local heat source (e.g. chemical reaction) was available. These and other aspects will be the subject of future research.
Notes and references
- T. Shimizu, M. Masuda and H. Minamikawa, Chem. Rev., 2005, 105, 1401–1443 CrossRef CAS PubMed.
- S. Armon, E. Efrati, R. Kupferman and E. Sharon, Science, 2011, 333, 1726–1730 CrossRef CAS PubMed.
- W. Zhang, W. Jin, T. Fukushima, N. Ishii and T. Aida, J. Am. Chem. Soc., 2013, 135, 114–117 CrossRef CAS PubMed.
- P. X. Gao, Y. Ding, W. J. Mai, W. L. Hughes, C. S. Lao and Z. L. Wang, Science, 2005, 309, 1700–1704 CrossRef CAS PubMed.
- P. Terech, S. K. P. Velu, P. Pernot and L. Wiegart, J. Phys. Chem. B, 2012, 116, 11344–11355 CrossRef CAS PubMed.
- (a) R. Oda, I. Huc, M. Schmutz, S. J. Candau and F. C. MacKintosh, Nature, 1999, 399, 566–569 CrossRef CAS PubMed; (b) L. Ziserman, H. Y. Lee, S. R. Raghavan, A. Mor and D. Danino, J. Am. Chem. Soc., 2011, 133, 2511–2517 CrossRef CAS PubMed; (c) L. Ziserman, A. Mor, D. Harries and D. Danino, Phys. Rev. Lett., 2011, 106, 238105 CrossRef.
- (a) V. Castelletto, I. W. Hamley, R. A. Hule and D. J. Pochan, Angew. Chem., Int. Ed. Engl., 2009, 48, 2317–2320 CrossRef CAS PubMed; (b) J. Adamcik, V. Castelletto, I. W. Hamley and R. Mezzenga, Angew. Chem., Int. Ed. Engl., 2011, 50, 5495–5498 CrossRef CAS PubMed; (c) E. T. Pashuck and S. I. Stupp, J. Am. Chem. Soc., 2010, 132, 8819–8821 CrossRef CAS PubMed.
- (a) P. G. Degennes, C. R. Acad. Sci., Ser. IIc: Chim., 1987, 304, 259–263 Search PubMed; (b) J. V. Selinger, F. C. MacKintosh and J. M. Schnur, Phys. Rev. E: Stat. Phys., Plasmas, Fluids, Relat. Interdiscip. Top., 1996, 53, 3804–3818 CrossRef CAS; (c) J. V. Selinger, M. S. Spector and J. M. Schnur, J. Phys. Chem. B, 2001, 105, 7157–7169 CrossRef CAS.
- Z. Huang, S. K. Kang, M. Banno, T. Yamaguchi, D. Lee, C. Seok, E. Yashima and M. Lee, Science, 2012, 337, 1521–1526 CrossRef CAS PubMed.
- (a) L. O. Tjernberg, J. Naslund, F. Lindqvist, J. Johansson, A. R. Karlstrom, J. Thyberg, L. Terenius and C. Nordstedt, J. Biol. Chem., 1996, 271, 8545–8548 CrossRef CAS PubMed; (b) M. J. Krysmann, V. Castelletto, A. Kelarakis, I. W. Hamley, R. A. Hule and D. J. Pochan, Biochemistry, 2008, 47, 4597–4605 CrossRef CAS PubMed; (c) I. W. Hamley, Chem. Rev., 2012, 112, 5147–5192 CrossRef CAS PubMed.
- M. J. Krysmann, V. Castelletto and I. W. Hamley, Soft Matter, 2007, 3, 1401–1406 RSC.
- A. Dehsorkhi, I. W. Hamley, J. Seitsonen and J. Ruokolainen, Langmuir, 2013, 29, 6665–6672 CrossRef CAS PubMed.
- (a) W. K. Surewicz, H. H. Mantsch and D. Chapman, Biochemistry, 1993, 32, 389–394 CrossRef CAS; (b) A. Barth, Biochim. Biophys. Acta, Bioenerg., 2007, 1767, 1073–1101 CrossRef CAS PubMed.
- H. LeVine, Methods in Enzymology, ed. R. Wetzel, Academic Press, San Diego, 1999, vol. 309, pp. 274–284 Search PubMed.
- (a) H. LeVine, Protein Sci., 1993, 2, 404–410 CrossRef CAS PubMed; (b) I. W. Hamley, Angew. Chem., Int. Ed., 2007, 46, 8128–8147 CrossRef CAS PubMed.
- (a) M. R. H. Krebs, E. H. C. Bromley and A. M. Donald, J. Struct. Biol., 2005, 149, 30–37 CrossRef CAS PubMed; (b) R. Khurana, C. Coleman, C. Ionescu-Zanetti, S. A. Carter, V. Krishna, R. K. Grover, R. Roy and S. Singh, J. Struct. Biol., 2005, 151, 229–238 CrossRef CAS PubMed; (c) W. S. Childers, A. K. Mehta, K. Lu and D. G. Lynn, J. Am. Chem. Soc., 2009, 131, 10165–10172 CrossRef CAS PubMed.
- T. E. Creighton, Proteins. Structures and Molecular Properties, W.H. Freeman, 1993 Search PubMed.
- A. Barth and C. Zscherp, Q. Rev. Biophys., 2002, 35, 369–430 CrossRef CAS.
- L. Milanesi, J. P. Waltho, C. A. Hunter, D. J. Shaw, G. S. Beddard, G. D. Reid, S. Dev and M. Volk, Proc. Natl. Acad. Sci. U. S. A., 2012, 109, 19563–19568 CrossRef CAS PubMed.
Footnote |
| † Electronic supplementary information (ESI) available: Experimental methods and characterization data. Additional TEM, SAXS, FTIR and POM data, and critical aggregation concentration data. See DOI: 10.1039/c3sm51725j |
| This journal is © The Royal Society of Chemistry 2013 |
