 Open Access Article
Dynamic phases of colloidal monolayers sliding on commensurate substrates†
Jaffar
Hasnain
*,
Swetlana
Jungblut
and
Christoph
Dellago
Faculty of Physics, University of Vienna, Boltzmanngasse 5, 1090 Vienna, Austria. E-mail: jaffar.hasnain@univie.ac.at
First published on 29th April 2013
Abstract
We report on numerical simulations of a monolayer of charge-stabilized colloids driven over a substrate potential by an external dc force acting along a symmetry axis of the monolayer. Using overdamped Langevin dynamics, we studied the sliding transition for various inter-particle interaction strengths as a function of the driving force. For weak interactions, the diffusion of individual defects is responsible for the motion of the monolayer. As the interaction strength is increased, sliding is induced by distinct density compression and decompression zones. For very strong interactions, a type of stick-slip mechanism emerges, in which the sliding of the monolayer is mediated by the propagation of collective distortion waves. Our predictions can be tested experimentally with two-dimensional arrangements of colloidal particles exposed to periodic light fields and our work shows that the inter-particle interaction strength tunes the degree of correlation in the sliding mechanism adopted by a monolayer driven over a commensurate substrate.
1 Introduction
The dynamics of two surfaces that are in contact with each other has been studied for centuries and empirical approaches based on the Amontons–Coulomb law1 have enjoyed great success in predicting the frictional response of macroscopic objects. However, a truly atomistic understanding of friction remains elusive. At the beginning of the last century, simplified atomistically resolved descriptions of friction such as the Frenkel–Kontorova (FK)2,3 and Tomlinson–Prandtl4,5 models were developed and have since been the subject of much attention on a theoretical level.6–14 The recent advances in experimental realizations of the FK model through the use of quartz-crystal microbalance setups15–17 and atomic force microscopy18 inspired a number of simulation studies that extend beyond the classical FK model.19–24Furthermore, soft matter systems, and in particular colloidal suspensions of particles with tunable interactions, provide a way to study condensed phase phenomena with single-particle resolution usually unavailable to atomistic systems.25,26 Recently, Bechinger and collaborators27 devised an experiment that is a two-dimensional extension of the FK model and Vanossi and collaborators28 performed simulations which reproduce and elucidate the key features of this experiment in which the motion of a monolayer subjected to a substrate potential is initiated through the formation of kink–antikink pairs, as predicted by the FK model.
In an attempt to build upon the aforementioned work, we performed computer simulations of overdamped Yukawa particles driven over a commensurate substrate (i.e., the number of the minima of the external potential is the same as the number of particles in the monolayer) in order to understand the role that the inter-particle interaction plays in the dynamical steady state adopted by the monolayer. We have been able to draw a consistent picture for all possible inter-particle interaction strengths for the particular substrate we considered, and find that the degree of clustering of the kinks and antikinks that are formed in the monolayer increases as the inter-particle interaction strength is increased or the density of colloidal particles is decreased.
2 Simulation details
We studied the dynamics of colloidal monolayers driven by a constant force while being subjected to a commensurate substrate potential, as shown schematically in Fig. 1. The motion of a colloidal particle is governed by the overdamped Langevin equation,29,30γṙi = FYukawai + Fsubi + Fd + ![[f with combining tilde]](https://www.rsc.org/images/entities/b_i_char_0066_0303.gif) i. i. | (1) |
 | (2) |
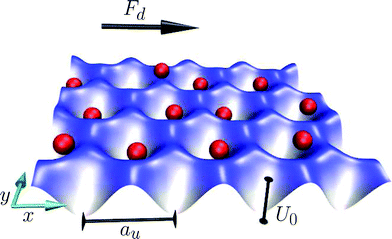 | ||
| Fig. 1 Sketch of the model; the colloids are subject to a substrate potential with lattice constant au and well depth U0. In addition to the forces exerted by the substrate, colloidal particles also experience inter-particle Yukawa forces, random buffeting forces due to the solvent, and a constant driving force, Fd. | ||
The substrate is a hexagonal arrangement of potential wells defined as
 | (3) |
 , were chosen so that the ensuing hexagonal substrate potential has the same orientation as a colloidal crystal with lattice vectors
  . The lattice constant of the substrate potential is au = 4π/3‖k‖, where ‖k‖ is the norm of the wave vectors, and, since we consider only the commensurate case, is set so that au = a for all simulation runs. This definition of Usub corresponds to the interference pattern produced by three coherent laser beams in experiments.27 The driving force, Fd = (Fd, 0), is constant in time. The components of the random buffeting forces,
 ![[f with combining tilde]](https://www.rsc.org/images/entities/b_i_char_0066_0303.gif) , that the fluid exerts on the particle are uncorrelated in time and follow a Gaussian distribution with zero mean and variance 〈
, that the fluid exerts on the particle are uncorrelated in time and follow a Gaussian distribution with zero mean and variance 〈![[f with combining tilde]](https://www.rsc.org/images/entities/i_char_0066_0303.gif) (t)
(t)![[f with combining tilde]](https://www.rsc.org/images/entities/i_char_0066_0303.gif) (0)〉 = 2 kBTγδ(t), where δ(t) is the Dirac delta function and t is time.
(0)〉 = 2 kBTγδ(t), where δ(t) is the Dirac delta function and t is time.
We examined monolayers with interaction strengths ranging from Γ = 0 to 10 kBT subject to various driving forces, Fd. Each monolayer consisted of 5476 particles and periodic boundary conditions were imposed. For each set of parameters, five simulation runs of 106 time steps of length δt = 10−4γ−1 were conducted and before any measurements were made, the systems were equilibrated for 2 × 10⁵ time steps.
3 Results and discussion
3.1 Drift velocity of the monolayer
We begin with the analysis of the average drift velocity 〈vcm〉 of the colloidal particles in the driving direction, which is presented in Fig. 2 as a function of the driving force, Fd. We express Fd in units of Fmax = 8πU0/9a, the maximum force that the substrate potential can exert on a colloid in the driving direction. In all simulation runs, the diffusion perpendicular to the direction of driving was indistinguishable from the undriven case. Before we discuss the sliding mechanisms adopted by the monolayer, we will present considerations on the particle mobility in the limiting cases of very large and small inter-particle interaction strengths as well as in the intermediate regime.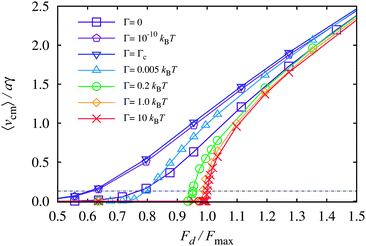 | ||
| Fig. 2 Average drift velocity of the colloidal crystal, 〈vcm〉/aγ, as a function of the applied driving force, Fd/Fmax. The lines are guides to the eye and the differences of the mean velocities between simulation runs are of the order of the symbol size. The points in the curves for Γ = 0.005, 0.2, and 1.0 kBT that are closest to the horizontal line 〈vcm〉/aγ = 0.13 (dot-dashed) are the subject of a detailed discussion. | ||
γẋ = Fsub(x) + Fd![[thin space (1/6-em)]](https://www.rsc.org/images/entities/char_2009.gif) , , | (4) |
 | (5) |
The average velocity is therefore given by
 | (6) |
The prediction of this equation is shown in Fig. 3 as the red dotted line. The limit is approached already at Γ = 10 kBT, as can be seen in Fig. 3. This velocity profile constitutes a lower boundary for all of the velocity profiles in Fig. 2. For driving forces smaller than Fmax, such a monolayer is completely pinned to the substrate and no drift occurs. However, as soon as the driving force Fd exceeds Fmax, the monolayer gains a non-vanishing average velocity. At non-zero temperatures and finite Γ, this sharp transition from a pinned to drifting monolayer, known as the depinning transition, is a smooth function in terms of 〈vcm〉.
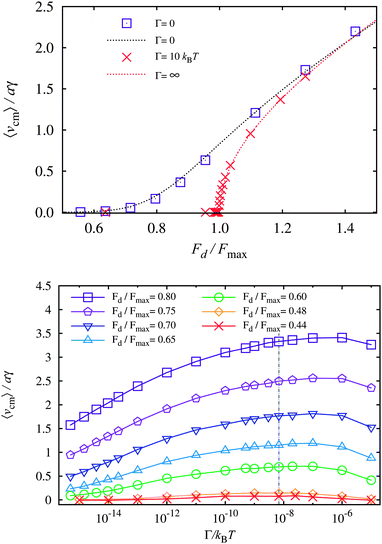 | ||
| Fig. 3 Comparison of simulation data to theoretical predictions. Top: the lines are the theoretical predictions of eqn (6) corresponding to Γ = ∞ (red dotted line) and eqn (10) corresponding to Γ = 0 (black dotted line). The symbols are datasets obtained from simulation for Γ = 0 and Γ = 10. Bottom: mean velocities of monolayers as a function of Γ for different driving forces Fd. Our estimation of Γc is indicated by the vertical dot-dashed line. The error bars are smaller than the symbol size. | ||
 | (7) |
 | (8) |
We note that these relationships hold for any kind of external potential. One can then proceed to obtain W(x),
 | (9) |
 | (10) |
The solution obtained numerically for Γ = 0 is shown in Fig. 3 as a black dotted line together with our simulation results. Evidently, we recover the analytical solution for the case of non-interacting particles.
To make a rough estimate of Γc, we derive the highest value of Γ for which a configuration of two particles sharing the same substrate potential minimum is mechanically stable. For all interaction strengths above this value, if a colloid hops from one substrate minimum to the next (occupied by another colloid), it will necessarily initiate a sequence of particle hops by forcing the particle previously residing in this minimum to move out of it. In the following, we neglect the effects of temperature, driving force, and the interactions with the surrounding particles and restrict the analysis to one dimension. We start with the Hamiltonian given by
| H = UYukawa(|x1 − x2|) + Usub(x1) + Usub(x2), | (11) |
 . Hence, we estimate that
 | (12) |
In the bottom frame of Fig. 3, we plotted the mean velocity of the monolayer 〈vcm〉 as a function of Γ for different driving forces Fd. All monolayers with Γ < Γc are indeed less mobile than those with Γ = Γc for all driving forces considered. In addition, Fig. 3 demonstrates that the effects due to the neighboring particles become perceivable at interaction strengths a few orders of magnitude above Γc, where the velocity of monolayers starts to decrease. It is to be expected that this crossover behavior is particularly pronounced for potentials that change drastically as particles approach each other, as in the case of the Yukawa potential.
3.2 Sliding mechanisms
An inspection of the trajectories of the monolayers revealed that, for different values of Γ, characteristic mechanisms (that persist for all driving forces) are responsible for the sliding motion. In order to investigate these mechanisms, we present a more detailed description of the motion of the monolayers for Γ = 1.0, 0.2, and 0.005 kBT that are driven by the forces Fd/Fmax = 0.987, 0.948, and 0.717, respectively. These values of Γ span the range of mechanisms available to the system, and the driving forces were selected so that they lead to the same average drift velocity for each monolayer (as indicated by the horizontal line in Fig. 2). In the top panel of Fig. 4, we show examples of the average displacement of the selected monolayers in the direction of the driving force as a function of time for these three cases. The curve for the largest interaction strength, Γ = 1.0 kBT, consists of distinct steps, indicating that the monolayer alternates between periods of rest and rapid spurts of motion. The difference in the height of two successive steps is one lattice constant, and the width of the plateaus is irregular, although there is a characteristic time between steps.20 The Γ = 0.2 kBT monolayer is perpetually in motion but there are large fluctuations in its drift velocity, whereas the Γ = 0.005 kBT curve appears as a smooth line at this resolution but is in fact the result of a stochastic process with very small variance.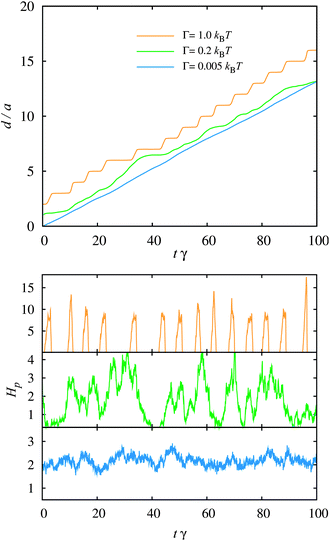 | ||
| Fig. 4 Top: displacement of the center of mass of the colloidal crystal, d/a, as a function of time, tγ, for three representative cases at interaction strengths and driving forces {Γ/kBT, Fd/Fmax} = {0.005, 0.717}, {Γ/kBT, Fd/Fmax} = {0.2, 0.948}, and {Γ/kBT, Fd/Fmax} = {1.0, 0.987}. Curves are shifted vertically for the sake of clarity. Bottom: percentage Hp of the particles undergoing a hop for each of the curves shown in the top panel. | ||
To obtain additional insights into the sliding mechanisms, we computed the fraction of particles undergoing a hop at a particular instant (in percent of the system size), Hp, as a function of time, for the same trajectories as in the top frame of Fig. 4. Particles are classified as undergoing a hop if the potential energy due to the substrate exceeds −7 kBT because we observed in our simulations that colloids entering this energy range almost invariably go from one substrate well to the next. While the average number of hopping particles, presented in the bottom frame of Fig. 4, is very similar for the three monolayers (all lie within the range of 1.7% to 2%), the signal continuously loses its structure as Γ is reduced. For large values of Γ, distinct peaks in the number of hopping particles separated by periods of rest indicate that many particles move at the same time in a correlated way. As Γ is decreased, the correlation of particle hops becomes smaller and the sliding motion becomes the result of independent hopping events leading to an almost time-independent fraction of hopping particles.
This general picture of a sliding mechanism increasingly dominated by correlations for growing interaction strength Γ is confirmed by an examination of the configurations computed over the course of a simulation run. Fig. 5 shows typical configurations chosen from trajectories of the discussed monolayers. The upper panels are depictions of configurations in which the colloids are colored according to their substrate potential values. The panels at the bottom show the local density compressions and decompressions corresponding to the kinks and antikinks of the FK model through the use of the configurations' Voronoi tessellations. In order to view movies of the trajectories from which these configurations were taken, we refer to the ESI.†
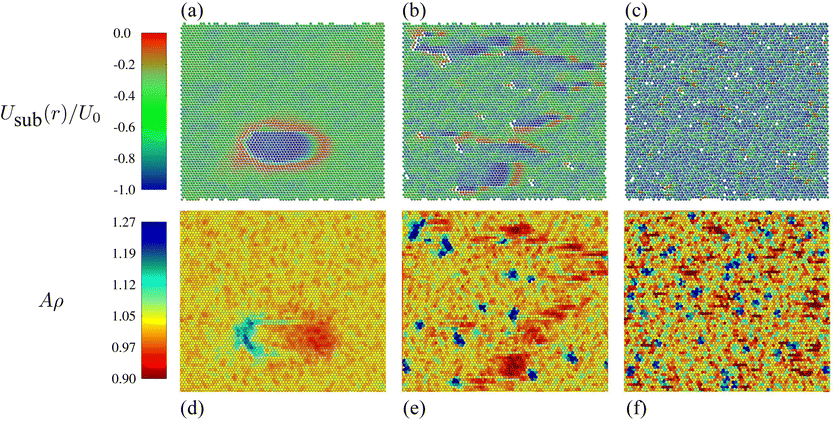 | ||
Fig. 5 Snapshots (top) and corresponding Voronoi tessellations (bottom) of typical configurations obtained for monolayers with (a and d) {Γ/kBT, Fd/Fmax} = {1.0, 0.987}, (b and e) {Γ/kBT, Fd/Fmax} = {0.2, 0.948}, and (c and f) {Γ/kBT, Fd/Fmax} = {0.005, 0.717}, as they are driven by a force that acts from left to right. The top color scale corresponds to the substrate potential values of the colloidal particles shown in (a)–(c), in units of the well depth, U0. The bottom color scale corresponds to the area A of the Voronoi cells depicted in (d)–(f), in units of the mean area per particle,  . See ESI† for videos of the trajectories from which these snapshots were taken. . See ESI† for videos of the trajectories from which these snapshots were taken. | ||
For a monolayer with Γ = 1.0 kBT and a driving force of Fd/Fmax = 0.987, there are long stretches of time in which each particle oscillates about the point where the substrate force counteracts the driving force. These particles appear green in the substrate potential representation of Fig. 5a. The hopping mechanism begins when a small cluster of particles reach the top of their respective substrate potential barriers. This small nucleus of particles initiates a circular sequence of particle hops that encompasses the entire system. In Fig. 5a, the particles that appear red are in the process of hopping from one substrate minimum to the next and this ring of hopping particles will subsequently continue to grow until each particle has hopped once. After the hopping wave has run its course, the system remains at rest until a new hopping nucleus spontaneously appears. The blue particles that form a core in the middle of the wave have recently hopped and are in the process of diffusing from the bottom of their respective substrate wells to their new equilibrium positions. The corresponding Voronoi representation, shown in Fig. 5d, illustrates that the front of the wave is a zone of local compressions (kinks) whereas the rear of the hopping wave is a decompression (antikink) region. As the ring of hopping particles expands, the compression region propagates in the direction of the driving force while the decompression zone travels in the opposite direction. Due to periodic boundary conditions used in our simulations, these two zones eventually collide and annihilate each other. The top and bottom of the hopping wave are not detected by this representation because the Voronoi cells of those particles are sheared, not compressed. For large driving forces, the likelihood of forming a hopping wave increases to such an extent that multiple waves appear simultaneously. This mechanism has been observed and analyzed in simulations of the two-dimensional FK model20 aimed at reproducing quartz-crystal microbalance experiments, in which the activation energy of the slip motion is derived by means of classical nucleation theory.
For Γ = 0.2 kBT and Fd/Fmax = 0.948, the average drift velocity of the colloidal crystal is almost identical to the previous case, but the motion of the monolayer follows an entirely different dynamical pattern. Typical configurations, such as the one shown in Fig. 5b, feature a number of clusters of vacancies. For each vacancy cluster, there is a corresponding island of (red) interstitial particles that are traveling through the system via inter-well hops, leaving low energy particles (blue) in their wake. As in the previous case, the blue particles then turn green when they reach their equilibrium position where the substrate force and the driving force cancel. In the Voronoi representation shown in Fig. 5e, one can clearly see that the traveling interstitials form compression zones or kinks (red) while the vacancies in the colloidal crystal are decompression zones (blue). In the course of a simulation run, many clusters of interstitials travel through the system, whereas the vacancy regions remain virtually stationary.
For Γ = 0.005 kBT and a driving force of Fd/Fmax = 0.717, the arrangement of the defects loses all structure (Fig. 5c). Here, vacancies are locked in place while single interstitial particles diffuse through the monolayer. As in the previous case, compression zones (kinks) are mobile whereas decompression zones (antikinks) are immobile.
Videos of trajectories from simulations of larger systems (see ESI†) reveal conclusively that the hopping waves encountered in the Γ = 1.0 kBT case also display a kink–antikink asymmetry because the kink region (front) of the wave travels more quickly than the antikink region (rear) by about a factor 3. This finding is corroborated by simulations of similar non-driven systems,34 where it was found that interstitials are more mobile than vacancies. Furthermore, simulation and experimental measurements of kink and antikink velocities demonstrate that, in charge-stabilized colloidal systems, antikinks are consistently slower than kinks.27,28 We ascribe the differences in the kink–antikink mobility to the purely repulsive nature of the Yukawa potential for which the motion of vacancies incurs larger energy penalties than interstitials. In the FK model, on the other hand, particles in the one-dimensional chain interact via a harmonic potential, which is perfectly symmetric and we expect this to be the reason why kinks and antikinks are equally mobile in that case.
4 Conclusions
In conclusion, we analyzed the mechanisms of thermally induced depinning of colloidal monolayers driven by an external force over a substrate potential and showed that the occurrence of different sliding mechanisms is determined by the strength of the inter-particle interactions. We have also been able to find upper and lower boundaries to the frictional response of the monolayer in terms of the interaction strength and preliminary results suggest that the approximations remain valid even for significantly weaker field strengths.The origins of the various depinning mechanisms involving different degrees of correlation can be explained in terms of the energetics associated with vacancy–interstitial pairs. For strong inter-particle interactions, the creation of a vacancy–interstitial pair is energetically so disadvantageous that motion can only be achieved through correlated hopping waves that involve many particles and only weakly distort the hexagonal structure of the monolayer. As the interaction strength is reduced, smaller clusters of particles can escape from the local substrate potential minima and diffuse through the lattice. Finally, for weak interactions, the energetic costs of a defect is so low that correlations are lost and individual particles can travel along one-dimensional channels in the direction of the driving force.
Further research into the dynamical asymmetry of kinks–antikinks as well as a quantitative treatment of the vacancy–interstitial energetics that give rise to the different sliding phases that have been observed is warranted. The role of incommensurabilities, variation of direction and frequency of the driving force, as well as the role of the shape of the substrate are also worth examining.
Acknowledgements
This research was supported by the FWF under the projects No. P24681-N20 and P20942-N16 and within the SFB ViCoM (F41). The authors would like to thank C. Bechinger for the inspiration to work on this system. We would also like to thank T. Bohlein, M. Schmiedeberg, C. Reichhardt, C. J. Olson Reichhardt, and W. Lechner for their interest as well as for their insights. The computational results were produced in part using the Vienna Scientific Cluster (VSC).References
- G. Amontons, Mem. Acad. Roy. Sci., 1699, 206 Search PubMed.
- J. Frenkel and T. Kontorowa, Phys. Z. Sowjetunion, 1938, 13, 1 Search PubMed.
- O. M. Braun and Y. S. Kivshar, Phys. Rep., 1998, 306, 1 CrossRef.
- L. Prandtl, Z. Angew. Math. Mech., 1928, 8, 85 CrossRef.
- G. A. Tomlinson, Philos. Mag., 1929, 7, 905 CAS.
- O. M. Braun and Y. S. Kivshar, The Frenkel–Kontorova Model: Concepts, Methods, and Applications, Springer, 2004 Search PubMed.
- M. Weiss and F.-J. Elmer, Z. Phys. B, 1997, 104, 55 CrossRef CAS.
- S. Aubry and P. Y. Le Daeron, Physica D, 1983, 8, 381 CrossRef.
- M. H. Müser, M. Urbakh and M. O. Robbins, Adv. Chem. Phys., 2003, 126, 187 CrossRef.
- O. M. Braun, A. R. Bishop and J. Röder, Phys. Rev. Lett., 1997, 79, 3692 CrossRef CAS.
- M. V. Paliy, O. M. Braun, T. Dauxois and B. Hu, Phys. Rev. E: Stat. Phys., Plasmas, Fluids, Relat. Interdiscip. Top., 1997, 56, 4025 CrossRef CAS.
- O. M. Braun, M. V. Paliy, J. Röder and A. R. Bishop, Phys. Rev. E: Stat., Nonlinear, Soft Matter Phys., 2001, 63, 036129 CrossRef CAS.
- J. Tekić, O. M. Braun and B. Hu, Phys. Rev. E: Stat., Nonlinear, Soft Matter Phys., 2005, 71, 026104 CrossRef.
- C. Reichhardt and C. J. Olson Reichhardt, Phys. Rev. E: Stat., Nonlinear, Soft Matter Phys., 2009, 79, 061403 CrossRef CAS.
- J. Krim, D. H. Solina and R. Chiarello, Phys. Rev. Lett., 1991, 66, 181 CrossRef CAS.
- T. Coffey and J. Krim, Phys. Rev. Lett., 2005, 95, 076101 CrossRef CAS.
- L. Bruschi, A. Carlin and G. Mistura, Phys. Rev. Lett., 2002, 88, 046105 CrossRef CAS.
- I. Szlufarska, M. Chandross and R. W. Carpick, J. Phys. D: Appl. Phys., 2008, 41, 123001 CrossRef.
- M. Urbakh and E. Meyer, Nat. Mater., 2010, 9, 8 CrossRef CAS.
- M. Reguzzoni, M. Ferrario, S. Zapperi and M. C. Righi, Proc. Natl. Acad. Sci. U. S. A., 2010, 107, 1311 CrossRef CAS.
- E. D. Smith, M. O. Robbins and M. Cieplak, Phys. Rev. B: Condens. Matter Mater. Phys., 1996, 54, 8252 CrossRef CAS.
- Y. Mo, K. T. Turner and I. Szlufarska, Nature, 2009, 457, 1116 CrossRef CAS.
- S. El Shawish, J. Dobnikar and E. Trizac, Phys. Rev. E: Stat., Nonlinear, Soft Matter Phys., 2011, 83, 041403 CrossRef.
- S. Bleil, H. H. von Grünberg, J. Dobnikar, R. Castañeda-Priego and C. Bechinger, Europhys. Lett., 2006, 73, 450 CrossRef CAS.
- A. Yethiraj, Soft Matter, 2007, 3, 1099 RSC.
- D. M. Herlach, I. Klassen, P. Wette and D. Holland-Moritz, J. Phys.: Condens. Matter, 2010, 22, 153101 CrossRef.
- T. Bohlein, J. Mikhael and C. Bechinger, Nat. Mater., 2012, 11, 126 CrossRef CAS.
- A. Vanossi, N. Manini and E. Tosatti, Proc. Natl. Acad. Sci. U. S. A., 2012, 109, 16426 CrossRef.
- M. P. Allen and D. J. Tildesley, Computer Simulation of Liquids, Oxford Science Publications, Oxford, 2008 Search PubMed.
- M. Lax, Rev. Mod. Phys., 1966, 38, 541 CrossRef.
- B. V. Derjaguin and L. Landau, Acta Phys. Chem., 1941, 14, 633 Search PubMed.
- H. Risken, The Fokker–Planck Equation, Springer, Berlin, 2nd edn, 1996 Search PubMed.
- Y. M. Ivanchenko and L. A. Zil'berman, Sov. Phys. JETP, 1969, 28, 1272 Search PubMed.
- A. Libál, C. Reichhardt and C. J. Olson Reichhardt, Phys. Rev. E: Stat., Nonlinear, Soft Matter Phys., 2007, 75, 011403 CrossRef.
Footnote |
| † Electronic supplementary information (ESI) available. See DOI: 10.1039/c3sm50458a |
| This journal is © The Royal Society of Chemistry 2013 |
