DOI:
10.1039/C3MB70416E
(Paper)
Mol. BioSyst., 2014,
10, 138-148
Molecular recognition of malachite green by hemoglobin and their specific interactions: insights from in silico docking and molecular spectroscopy
Received
21st September 2013
, Accepted 24th October 2013
First published on 25th October 2013
Abstract
Malachite green is an organic compound that can be widely used as a dyestuff for various materials; it has also emerged as a controversial agent in aquaculture. Since malachite green is proven to be carcinogenic and mutagenic, it may become a hazard to public health. For this reason, it is urgently required to analyze this controversial dye in more detail. In our current research, the interaction between malachite green and hemoglobin under physiological conditions was investigated by the methods of molecular modeling, fluorescence spectroscopy, circular dichroism (CD) as well as hydrophobic ANS displacement experiments. From the molecular docking, the central cavity of hemoglobin was assigned to possess high-affinity for malachite green, this result was corroborated by time-resolved fluorescence and hydrophobic ANS probe results. The recognition mechanism was found to be of static type, or rather the hemoglobin–malachite green complex formation occurred via noncovalent interactions such as π–π interactions, hydrogen bonds and hydrophobic interactions with an association constant of 104 M−1. Moreover, the results also show that the spatial structure of the biopolymer was changed in the presence of malachite green with a decrease of the α-helix and increase of the β-sheet, turn and random coil suggesting protein damage, as derived from far-UV CD and three-dimensional fluorescence. Results of this work will help to further comprehend the molecular recognition of malachite green by the receptor protein and the possible toxicological profiles of other compounds, which are the metabolites and ramifications of malachite green.
Introduction
Proteins are the chief actors in sustaining life and play essential roles in influencing the origin, evolution and metabolism of life. They perform a vast array of functions within living organisms including transporting molecules from one location to another. Thus, proteins can be the optimal choice for exploring the pharmacological action and characterization of drugs that may impact on human beings and animals.1 Hemoglobin, as a fundamental component of the circulatory system of vertebrates, is a type of plasma protein and involved in the transport of gases.2 Its major biological function is to carry oxygen from lungs to different tissues, and thus lead to electron transfer in all organs and parts of the body.3 Moreover, hemoglobin plays a vital role in producing peroxide dispersion, and transporting H+, CO2 and 2,3-bisphosphoglycerate from tissues which are then excreted from lungs and kidneys.4 It is a widely accepted point of view that the metabolism and distribution of biologically active compounds in vivo, including drugs and natural products, are correlated with their affinities toward plasma proteins.5,6 For this reason, the investigation of the interaction of drugs with hemoglobin is of great importance. The conjugation with proteins can make us realize the metabolism of drugs in vivo, and is of great significance in biochemistry, pharmacology, biopharmaceutics and related fields.
Malachite green (CAS 633-03-4), a diamino derivative of the triarylaminnethane dye (structure shown in Fig. 1), has been used extensively in the aquaculture industry as a food coloring agent, food additive, medical disinfectant and parasiticide, as well as a dye in paper, leather, jute, wool, silk and acrylic industries.7–10 Besides, malachite green is also widely used as an antifungal agent in animals' food because of its excellent ability to control and treat the protozoan infections, and some other diseases of aquatic species.11–14 Since the early 1930s, it has been routinely used in aquaculture and regarded as the most efficacious agent for combating fungal infections by many in the fish industry.15 The powerful antimicrobial activity of malachite green is attributed to inhibition of intracellular enzymes and intercalation into DNA.16 However, during the past few decades, malachite green has been ascertained to exhibit carcinogenic, genotoxic, mutagenic, teratogenic and respiratory toxicity properties in humans.17 Several years ago, malachite green had been selected for carcinogenicity testing in the National Toxicology Program by the United States Department of Health and Human Services, because of its potential for consumer exposure, which suggests evidence of tumor promotion in rodent livers.18,19 Besides, animal studies have demonstrated its detrimental effects on kidney, intestine, gonads, gills and pituitary gonadotropic cells.20–22 The instillation of an 8% aqueous solution into the eyes of rabbits led to slight hyperemia, marked edema and substantial discharge of the conjunctiva.16 Even though the use of malachite green has been strictly banned in several countries for nearly twenty years, it is still being produced and used around the world due to its high efficacy and low cost.23,24 Therefore, it is necessary and urgent to investigate the binding of malachite green to proteins, as it can provide valuable insight into the drug's toxicity, and also clarify biomacromolecular functioning in complexation systems.25 In this work, human hemoglobin was selected as the suitable protein model because of its availability and extraordinary ligand-binding properties.
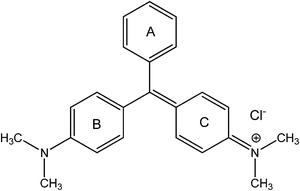 |
| | Fig. 1 Molecular structure of malachite green. | |
Hemoglobin (structure shown in Fig. 2) is made up of four subunits: two α-chains (each comprising 141 amino acids) and two β-chains (each comprising 146 amino acids).26,27 The molecular weight of hemoglobin is 64.45 kDa and its concentration in the red blood cells (330 mg mL−1)2,3 is much higher than albumin (∼40 mg mL−1).28,29 In previous work, Zhang et al.30 studied the binding of malachite green with bovine serum albumin (BSA) in order to determine the binding mechanism and binding site in detail. In our investigation, the focus is on the interaction of malachite green with the binding site of hemoglobin.
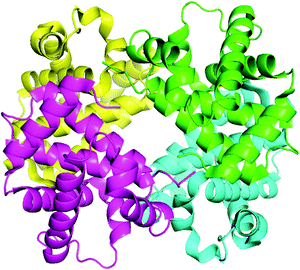 |
| | Fig. 2 The ribbon model of the hemoglobin derived from X-ray crystallography (PDB: 1G09). This illustration was made using PyMOL on the basis of the atomic coordinates available at the Brookhaven Protein Data Bank (http://www.rcsb.org/pdb). | |
In order to investigate plasma protein binding properties, numerous experimental techniques have been developed to date for studying protein–ligand complexation. The malachite green binding property of hemoglobin was characterized through molecular modeling, fluorescence spectroscopy and hydrophobic 8-anilino-1-naphthalenesulfonic acid (ANS) displacement experiments. Structural alterations of hemoglobin complexation with malachite green were described by synchronous fluorescence, three-dimensional fluorescence and circular dichroism (CD). Present results can act as further resources to comprehend the essence of hemoglobin–malachite green conjugation and other ligands which have analogous configuration with triphenylmethane.
Experimental procedures
Materials
Human hemoglobin (H7379, lyophilized powder), malachite green (38![[thin space (1/6-em)]](https://www.rsc.org/images/entities/char_2009.gif) 800, ≥96%) and ANS (A1028, ≥97%) utilized in this study were purchased from Sigma-Aldrich (St. Louis, MO, USA) and used without further purification. The deionized water was produced by a Milli-Q Ultrapure Water Purification System from Millipore (Billerica, MA, USA). All of the experiments were performed in Tris (0.2 M)-HCl (0.1 M) buffer of pH = 7.4, with an ionic strength of 0.1 in the presence of NaCl, and the pH was checked using an Orion Star A211 pH Benchtop Meter (Thermo Scientific, Waltham, MA, USA). Dilutions of the hemoglobin stock solution (30 μM) in Tris-HCl buffer were prepared immediately before use, and the concentration of hemoglobin was determined spectrophotometrically using ε555nm = 12.5 mM−1 cm−1 per heme.31 All other reagents employed were of analytical grade and received from Sigma-Aldrich. To remove any undissolved matter, all samples were filtered through a 0.22 μm Millex-GV Filter (Millipore, Billerica, MA, USA).
800, ≥96%) and ANS (A1028, ≥97%) utilized in this study were purchased from Sigma-Aldrich (St. Louis, MO, USA) and used without further purification. The deionized water was produced by a Milli-Q Ultrapure Water Purification System from Millipore (Billerica, MA, USA). All of the experiments were performed in Tris (0.2 M)-HCl (0.1 M) buffer of pH = 7.4, with an ionic strength of 0.1 in the presence of NaCl, and the pH was checked using an Orion Star A211 pH Benchtop Meter (Thermo Scientific, Waltham, MA, USA). Dilutions of the hemoglobin stock solution (30 μM) in Tris-HCl buffer were prepared immediately before use, and the concentration of hemoglobin was determined spectrophotometrically using ε555nm = 12.5 mM−1 cm−1 per heme.31 All other reagents employed were of analytical grade and received from Sigma-Aldrich. To remove any undissolved matter, all samples were filtered through a 0.22 μm Millex-GV Filter (Millipore, Billerica, MA, USA).
Molecular modeling
Molecular modeling of the hemoglobin–malachite green complex was carried out on a SGI Fuel Visual Workstation. The crystal structure of hemoglobin (entry codes 2DN1),32 determined at a resolution 1.25 Å, was retrieved from the Brookhaven Protein Data Bank (http://www.rcsb.org/pdb). After being imported in the program Sybyl Version 7.3 (http://tripos.com), the structure was carefully checked for atom and bond type correctness assignment. Hydrogen atoms were computationally added using the Sybyl Biopolymer and Build/Edit menus. To avoid negative acid–acid interactions and repulsive steric clashes, added hydrogen atoms were energy minimized using the Powell algorithm with 0.05 kcal mol−1 energy gradient convergence criteria for 1500 cycles, this procedure does not change positions of heavy atoms, and the potential of the three-dimensional structure of protein was assigned according to the AMBER force field with Kollman all-atom charges. The two-dimensional structure of malachite green was downloaded from PubChem (http://pubchem.ncbi.nlm.nih.gov), and the initial structure of the molecule was produced using Sybyl 7.3. The geometry of malachite green was subsequently optimized to minimal energy (tolerance of 0.5 kcal mol−1) using the Tripos force field with MMFF94 charges, and the lowest energy conformer was utilized for the docking analysis. The Surflex-Dock program, which employs an automatic flexible docking algorithm, was applied to analyze the possible conformation of the ligand that binds to hemoglobin, and the program PyMOL (http://www.pymol.org) was finally used for visualization of the molecular docking results.
Steady state fluorescence
Steady state fluorescence was conducted using a 1.0 cm path length quartz cell using a F-7000 spectrofluorimeter (Hitachi, Japan) equipped with a thermostatic bath and a microcomputer. The excitation and emission slits were set at 5.0 nm each, intrinsic fluorescence was obtained by exciting the continuously stirred hemoglobin solution at 280 nm to selectively excite the Trp residues, and the fluorescence emission spectra were recorded in the wavelength range of 300–450 nm at a scanning speed of 240 nm min−1. The reference sample consisting of the Tris-HCl buffer and malachite green did not give any fluorescence signal.
Time-resolved fluorescence
Time-resolved fluorescence was examined using a FLS920 spectrometer (Edinburgh Instruments, UK), using the time-correlated single photon counting system with a hydrogen flash lamp excitation source, in air equilibrated solution at an ambient temperature. The excitation wavelength was 280 nm and the number of counts gathered in the channel of maximum intensity was 4000. The data were analyzed using a nonlinear least-squares iterative method utilizing the Fluorescence Analysis Software Technology, which is a sophisticated software package designed by Edinburgh Photonics for the analysis of fluorescence and phosphorescence decay kinetics. The instrument response function (IRF) was gauged exploiting Ludox to scatter light at the excitation wavelength, IRF was deconvoluted from the experimental data, and the resolution limit after deconvolution was 0.2 ns. The value of χ2 (0.9∼1.2), the Durbin–Watson parameter (>1.7) as well as a visual inspection of the residuals were used to assess how well the calculated decay fits the data. The average fluorescence lifetime (τ) for multiexponential function fittings was calculated using the following relation:33| |  | (1) |
where τi are fluorescence lifetimes and Ai are their relative amplitudes, with i varying from 1 to 3.
Circular dichroism
Far-UV CD spectra were recorded using a Jasco-815 spectropolarimeter (Jasco, Japan) equipped with a microcomputer, and the instrument was calibrated with d-10-camphorsulfonic acid. All the CD spectra were recorded at 298 K using a PFD-425S Peltier temperature controller attached to a water bath with an accuracy of ±0.1 °C. Each spectrum was registered using a quartz cell of 1.0 cm path length and taken at wavelengths between 200 and 260 nm with 0.1 nm step resolution and averaged over five scans recorded at a speed of 20 nm min−1 and a response time of 1 s. All observed CD spectra were baseline subtracted for buffer, and the secondary structure was computed exploiting Jasco Spectra Manager II, which calculates the different designations of secondary structures by comparison with CD spectra, determined from distinct proteins for which high-quality X-ray diffraction data are available.34
Three-dimensional fluorescence
The emission wavelength was collected between 200 and 500 nm, the initial excitation wavelength was set to 200 nm with an increment of 10 nm, the number of scanning curves was 16, and the other scanning parameters were identical to the fluorescence emission above.
Extrinsic ANS displacement
In the first series of experiments, hemoglobin concentration was kept fixed at 3.0 μM, and malachite green–ANS concentration was from 0 to 27 μM, hemoglobin fluorescence was gauged (λex = 280 nm, λem = 325 nm). In the second series of experiments, malachite green was added to solutions of hemoglobin and ANS held in equimolar concentration (3.0 μM), and the concentrations of malachite green was also varied from 0 to 27 μM, the fluorescence of ANS was picked (λex = 370 nm, λem = 465 nm).
Principle of fluorescence quenching
Fluorescence quenching refers to any process that decreases the fluorescence intensity of a sample. A variety of molecular interactions can result in quenching, such as excited state reactions, molecular rearrangements, energy transfer, ground state complex formation, and collisional quenching. Fluorescence quenching is described by the well-known Stern–Volmer equation:35| | 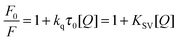 | (2) |
In this equation, F0 and F are the fluorescence intensities in the absence and presence of the quencher, respectively; kq is the bimolecular quenching constant; τ0 is the lifetime of the fluorophore in the absence of the quencher; [Q] is the concentration of the quencher; and Ksv is determined by linear regression of a plot of F0/F versus [Q].
Calculation of the affinity constant
When ligand molecules bind independently to a set of equivalent sites on a macromolecule, the equilibrium between free and bound ligand molecules is given by the following relation:36| | 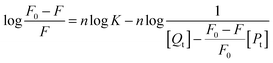 | (3) |
where F0 and F are the fluorescence intensities in the absence and presence of the quencher, respectively, K and n are the association constant and the number of binding sites, respectively, [Qt] and [Pt] are the total concentration of the quencher and the protein.
Results and discussion
Molecular modeling
To obtain insight into the malachite green interaction with hemoglobin, molecular modeling simulations were applied to examine the binding of malachite green at the active site of hemoglobin. The best docking energy result ΔG° = −24.12 kJ mol−1 is shown in Fig. 3(A). It can be seen that malachite green was situated within the domain formed between the helices of α1 and β2. The specific interactions between malachite green and hemoglobin are shown in Fig. 3(B). There is an extended network of hydrophobic contacts with amino acids as follows: Val-34, Trp-37, Val-96, Lys-99, Leu-105, Leu-106, Lys-127, Leu-129 and Ala-130. The perpendicular molecular distance between the nucleus of the indole ring in Trp-37 and the kernel of the A-ring in malachite green is 3.32 Å, which illustrated the existence of evident π–π interaction between hemoglobin and malachite green. Moreover, there is a significant T–π interaction between the indole ring in Trp-37 and the B-ring in the ligand. And, hydrogen bond interactions are found between the malachite green and hemoglobin, playing a considerable role in stabilizing the ligand. The hydrogen atom of the amino group in Thr-137 and the hydrogen atom of the hydroxyl group in Lys-127 can make hydrogen bonds with the positive nitrogen atom linked by the C-ring and the nitrogen atom next to the B-ring, with the distance of 3.12 Å and 3.05 Å, respectively. The hydrogen bonds serve as an “anchor”, which determines the three-dimensional space position of malachite green in the binding region, and stimulates the π–π interactions with the side chain of the protein.37 The above docking analyses verify the malachite green near the Trp-37 residue, and create structural changes of hemoglobin upon interactions with the ligand.
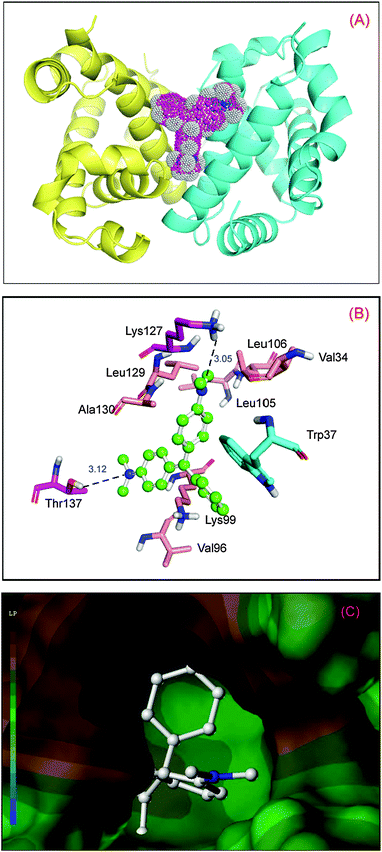 |
| | Fig. 3 Molecular modeling of malachite green docked to hemoglobin. Panel (A) shows docked malachite green into hemoglobin at the active site, hemoglobin represented in surface colored by chains (chain A: yellow; chain B: blue), and malachite green is colored as per the atoms and possesses dots on the surface showing electron spin density. Panel (B) displays the amino acid residues involved in binding of malachite green; the ball-and-stick model indicates malachite green, colored as per the atoms and the key amino acid residues around malachite green have been depicted using the stick model, the light magenta stick model reveals hydrogen bonds between Lys-127, Thr-137 and malachite green; the cyan stick model reveals π–π interaction between Trp-37 and the ligand; the salmon stick model explains hydrophobic interactions between Val-34, Val-96, Lys-99, Leu-105, Leu-106, Leu-129 and Ala-130 residues and malachite green. Panel (C) denotes hydrophobic interactions between the amino acid residues composed of the binding site and malachite green. (For interpretation of the references to color in this figure legend, the reader is referred to the web version of the article.) | |
As can be seen from a previous study, when hemoglobin undergoes a conformational change as a result of associative ligand binding, the α1β2 contacts are altered. Moreover, the ligand is accessible only to the heme groups of the α-chains in the T state, and the heme environment of β-chains in the T state is virtually inaccessible because of steric hindrance by the amino acid residues in the E helix.38 This hindrance disappears when the hemoglobin undergoes transition to the R state. For this reason, we may indicate that binding of malachite green to the binding site will lead to the T to R shift,39 and the phenomenon is triggered by the subtle changes that emerge when the ligand is situated near the α-chain heme groups. To demonstrate the results of molecular simulation, the collected data revealed in solution experiments are recounted below, as derived from steady state and time-resolved fluorescence, CD spectra, three-dimensional fluorescence and hydrophobic ANS displacement, to authenticate molecular simulation.
Fluorescence binding studies
As we know, binding of ligands to transporter protein is exceedingly prominent as it affects the distribution and intensity of its pharmacological and toxicological action; therefore, it is important to know the specific reaction strength of malachite green with hemoglobin. Fig. 4 shows the fluorescence emission spectra of hemoglobin with various concentrations of malachite green at 280 nm, the working concentration of protein was 3.0 μM so as to prevent quenching of Trp residue fluorescence by the neighboring heme group.40 Hemoglobin displays a weak fluorescence emission band at 325 nm and its fluorescence intensity decreased regularly with the addition of malachite green, accompanied by the bathochromic effect (from 325 nm to 330 nm).41 Under the experimental conditions, malachite green shows no fluorescence signal in the range 300–450 nm which did not interfere with hemoglobin fluorescence. As sstated earlier, hemoglobin is a globular tetrameric protein containing four globin chains, of which two are α-chains and two are β-chains. The tetramer is assembled from two αβ dimers, each αβ dimer contains three Trp residues, adding to a total of six Trp residues, namely α-14 Trp, β-15 Trp and β-37 Trp at the α1β2 interface and serves as a reporter for R–T transition.42 The R form is the oxy/ligand bound form while the T form is the deoxy form and the R–T form represents significant changes in relative fluorescence intensity. Consequently, the quenching of the intrinsic fluorescence of hemoglobin is clearly denoted as the association of malachite green with hemoglobin, malachite green being situated near the β-37 Trp residue, and moreover, the hydrophobicity of β-37 Trp dropped.43
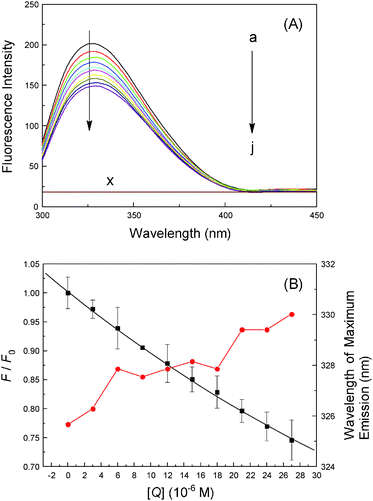 |
| | Fig. 4 Fluorescence emission spectra of hemoglobin (3.0 μM) at λex = 280 nm (pH = 7.4, T = 298 K) in the presence of different concentrations of malachite green; concentration (μM): 0, 3.0, 6.0, 9.0, 12.0, 15.0, 18.0, 21.0, 24.0 and 27.0; (×) 27.0 μM malachite green only. The λem maximum occurred at 325 nm and all data were corrected for quencher fluorescence. Each data was the mean of three independent observations ± S.D. ranging from 0.3% to 3.58%. | |
Binding properties
To interpret the data from steady state fluorescence quenching, it is important to investigate the binding mechanism between the malachite green and hemoglobin, the data were analyzed according to the well-known Stern–Volmer equation (2), and the corresponding results fitted from the Stern–Volmer plot (Fig. 5) are summarized in Table 1. The results provide evidence that the Stern–Volmer quenching constant Ksv is oppositely correlated with temperature and the value of kq is 100-fold higher than the maximum value for diffusion-controlled quenching in water (∼1010 M−1 s−1), indicating that the probable quenching mechanism for hemoglobin fluorescence by malachite green is of static type,41 because higher temperature will typically result in the dissociation of weakly bound complexes, and as a result smaller amounts of static quenching.
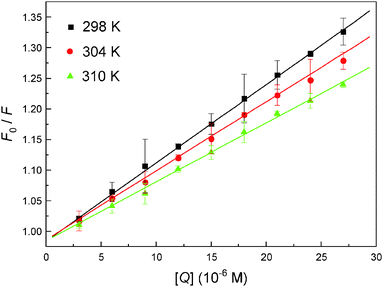 |
| | Fig. 5 The Stern–Volmer plot describing hemoglobin Trp residue quenching at pH = 7.4 caused by malachite green association. Fluorescence emission intensity was recorded at λex = 280 nm and the λem maximum occurred at 325 nm. All data were corrected for quencher fluorescence and each point was the mean of three individual experiments ± S.D. ranging from 0.32% to 4.39%. | |
Table 1 Stern–Volmer (KSV) and bimolecular quenching constants (kq) and affinity (K) for the molecular recognition of hemoglobin with malachite green
|
T (K) |
K
SV (×104 M−1) |
k
q (×1012 M−1 s−1) |
R
|
|
R is the correlation coefficient.
|
| 298 |
1.263 |
3.839 |
0.9996 |
| 304 |
1.101 |
3.347 |
0.9991 |
| 310 |
0.974 |
2.960 |
0.9984 |
Although static and dynamic quenching may be differentiated by their diverging dependence on temperature and viscosity, according to the theory of Lakowicz,33 fluorescence quenching is preferably acquired by time-resolved fluorescence measurements, which can distinguish between static and dynamic processes immediately. Accordingly, the fluorescence lifetimes and their amplitudes are summarized in Table 2. The decay curves fitted well to a biexponential function and the relative fluorescence lifetimes being produced are τ1 = 0.23 ns, τ2 = 2.12 ns and τ3 = 4.61 ns for hemoglobin, while at the maximum concentration of malachite green, the lifetimes are τ1 = 0.12 ns, τ2 = 2.16 ns and τ3 = 4.65 ns. As the Trp residue is known to divulge multi-exponential decays, we have not tried to assign the independent components, contrarily, the average lifetime has been employed in order to acquire a qualitative analysis. The average lifetime reduces from 3.29 ns to 3.24 ns, at different concentrations of malachite green, attesting that quenching is really static type, a hemoglobin–malachite green complex is formed between the fluorophore and the ligand, and this complex is nonfluorescent.42,44
Table 2 Fluorescence lifetime of hemoglobin as a function of concentrations of malachite green
| Samples |
τ
1 (ns) |
τ
2 (ns) |
τ
3 (ns) |
A
1
|
A
2
|
A
3
|
τ (ns) |
χ
2
|
| Free hemoglobin |
0.23 |
2.12 |
4.61 |
0.081 |
0.37 |
0.54 |
3.29 |
1.09 |
| Hemoglobin + malachite green (1:4) |
0.21 |
2.09 |
4.58 |
0.053 |
0.32 |
0.56 |
3.24 |
1.01 |
| Hemoglobin + malachite green (1:8) |
0.12 |
2.16 |
4.65 |
0.016 |
0.28 |
0.58 |
3.30 |
0.99 |
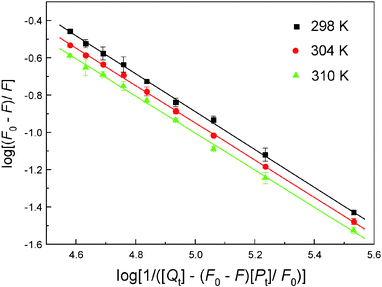
To evaluate the affinity of malachite green for hemoglobin, eqn (3) was utilized to calculate K and n by linear regression of a plot of the log(F0 – F)/F versus log(1/([Qt] – (F0 – F)[Pt]/F0)) (Fig. 6), and the results are listed in Table 3. The K values decreased with increasing temperature, bringing about the destabilization of the hemoglobin–malachite green complex. In addition, the value of n is approximately equal to 1, which shows the existence of only one kind of binding site in hemoglobin for malachite green. As noted earlier, the intrinsic fluorescence of hemoglobin is owing to the β-37 Trp residue,42 from the value of n, it was found that the ligand binding site is most likely adjacent to this residue, causing fluorescence quenching. Physiologically, a ligand with a relatively high binding affinity will have a long half-life, which may boost its toxicity; in contrast, a ligand with a low hemoglobin affinity is limited in its capacity to perfuse tissues and reaches the site of action. This is especially relevant to hydrophobic ligands, for which binding of protein such as hemoglobin enhances their solubility and subsequent tissue distribution. Consequently, understanding the extent of ligand affinity will aid in recognizing ligands with poisonous side effects, and we can hardly disregard this feature, because the degree of ligand binding to both blood and tissue biomacromolecules is, partially, dependent on both the distinct physicochemical properties of the exceptional chemical and on the character of the blood and tissue ingredients themselves.
 |
| | Fig. 6 The association constant plot describing Trp residue quenching of hemoglobin (3.0 μM) at pH 7.4 caused by malachite green conjugation. The fluorescence emission intensity was recorded at λex = 280 nm and the λem maximum occurred at 325 nm. Each data was the average of three separate determinations ± S.D. ranging from 0.71% to 4.33%. | |
Table 3 The affinities and thermodynamic parameters for the association of hemoglobin with malachite green at different temperatures
|
T (K) |
K (×104 M−1) |
N
|
R
|
ΔH° (kJ mol−1) |
ΔG° (kJ mol−1) |
ΔS° (J mol−1 K−1) |
|
R is the correlation coefficient.
|
| 298 |
1.459 |
1.01 |
0.9995 |
−28.18 |
−23.76 |
−14.92 |
| 304 |
1.135 |
1.00 |
0.9998 |
|
−22.60 |
|
| 310 |
0.9397 |
0.99 |
0.9992 |
|
−23.58 |
|
CD spectra
Far-UV CD is a powerful analytical method to study the association of proteins with other ligands, natural products and hazardous materials, and to determine the protein conformation in solution. To analyze quantitatively the secondary structure changes of hemoglobin, the raw CD spectra of hemoglobin with different concentrations of malachite green were recorded (Fig. 7), and secondary structure components computed based on CD data were collected in Table 4. The CD curve of hemoglobin displayed two negative peaks in the far-UV CD region at 208 nm and 222 nm, typical of α-helical structure of globular proteins. The rational explanation is that the two negative peaks (one is between 208 and 209 nm, and the other is between 222 and 223 nm) are both contributed by n→π* transition for the peptide bond of the α-helix.34,45 As can be seen in Table 4, free hemoglobin has 79.6% α-helix, 1.7% β-sheet, 6.5% turn and 12.2% random coil; after complexing with malachite green, decrease of α-helix was seen from 79.6% for free hemoglobin to 70.8% (complex) while increase in β-sheet, turn and random coil from 1.7%, 6.5% and 12.2% free hemoglobin to 4.7%, 9.8% and 14.7% (complex) at a molar ratio of hemoglobin to dye of 1:8. The decrease of α-helix with an increase in β-sheet, turn and random coil shows that malachite green binds with the amino acid residues of the polypeptide chain, thus giving rise to some degree of unfolding of hemoglobin.46 The structural changes examined by far-UV CD spectra are in good agreement with molecular docking simulation and steady state fluorescence, and are also in conformity with the three-dimensional fluorescence spectra below.
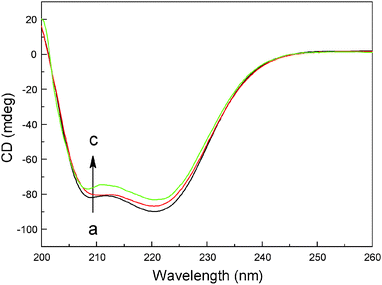 |
| | Fig. 7 Far-UV CD spectra of hemoglobin complexes with malachite green (pH = 7.4, T = 298 K). (a) 3.0 μM hemoglobin; (b) 3.0 μM hemoglobin + 12 μM malachite green; (c) 3.0 μM hemoglobin + 24 μM malachite green. | |
Table 4 Secondary structure components of hemoglobin recognition using malachite green at pH = 7.4 assessed using Jasco Spectra Manager II Software
| Samples |
Secondary structure components (%) |
| α-Helix |
β-Sheet |
Turn |
Random |
| Free hemoglobin |
79.6 |
1.7 |
6.5 |
12.2 |
| Hemoglobin + malachite green (1:4) |
76.8 |
2.7 |
7 |
13.5 |
| Hemoglobin + malachite green (1:8) |
70.8 |
4.7 |
9.8 |
14.7 |
Three-dimensional fluorescence
Extra proof of structural changes of hemoglobin after complexing with malachite green was represented by three-dimensional fluorescence (Fig. 8), and the commensurate parameters are merged in Table 5. This method, actually, has become a popular technique in recent years. It can comprehensively exhibit the fluorescence information of the sample, which makes the investigation of the characteristics conformational change of hemoglobin more scientific and credible. As can be seen from Fig. 8, peak a (λex = λem) is the Rayleigh scattering peak and peak b (λem = 2λex) is the second-order scattering peak. Peak 1 (λex = 280.0 nm, λem = 321.0 nm) mostly bespeaks the spectral peculiarity of Tyr and Trp residues, because when malachite green is excited at 280 nm, it greatly enunciates the intrinsic fluorescence of Tyr and Trp residues, and the phenylalanine (Phe) residues fluorescence can be negligible.33 Besides peak 1, peak 2 (λex = 230.0 nm, λem = 331.0 nm) principally betrays the fluorescence spectral demeanor of polypeptide chain backbone structure C![[double bond, length as m-dash]](https://www.rsc.org/images/entities/char_e001.gif) O. The intensity of peak 2 diminished after the augmentation of malachite green, which connoted that the peptide chain structure of hemoglobin was changed and this coincided with steady state fluorescence and far-UV CD phenomena. Comparing the fluorescence intensity of peak 1 and peak 2, in the presence and absence of malachite green, the strength ratio of the two peaks was 1:1.10 and 1:1.03, respectively. The decrement of the two peaks in combination with the steady state fluorescence and far-UV CD spectra showed that the molecular recognition of malachite green by hemoglobin caused the major destabilization of the polypeptide chain of hemoglobin, which resulted in structural changes of hemoglobin and augmented the baring of some hydrophobic speckles that had been concealed before. The results and elucidations apparently insinuated that the binding of malachite green to hemoglobin initiated conformational and microenvironmental alterations in proteins.
O. The intensity of peak 2 diminished after the augmentation of malachite green, which connoted that the peptide chain structure of hemoglobin was changed and this coincided with steady state fluorescence and far-UV CD phenomena. Comparing the fluorescence intensity of peak 1 and peak 2, in the presence and absence of malachite green, the strength ratio of the two peaks was 1:1.10 and 1:1.03, respectively. The decrement of the two peaks in combination with the steady state fluorescence and far-UV CD spectra showed that the molecular recognition of malachite green by hemoglobin caused the major destabilization of the polypeptide chain of hemoglobin, which resulted in structural changes of hemoglobin and augmented the baring of some hydrophobic speckles that had been concealed before. The results and elucidations apparently insinuated that the binding of malachite green to hemoglobin initiated conformational and microenvironmental alterations in proteins.
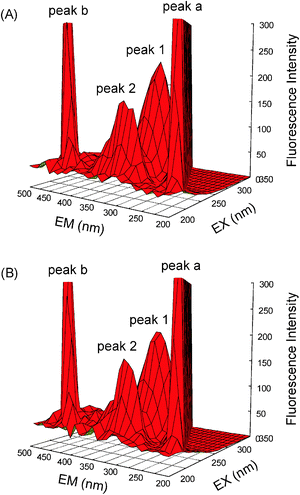 |
| | Fig. 8 Three-dimensional fluorescence of hemoglobin (A) and the hemoglobin–malachite green (B) system. (A) c(hemoglobin) = 3.0 μM, c(malachite green) = 0; (B) c(hemoglobin) = 3.0 μM, c(malachite green) = 6.0; pH = 7.4, T = 298 K. | |
Table 5 Three-dimensional fluorescence spectral characteristic parameters of hemoglobin and the hemoglobin–malachite green complex
| Peaks |
Hemoglobin |
Hemoglobin–malachite green |
| Peak position λex/λem (nm/nm) |
Stokes Δλ (nm) |
Intensity F |
Peak position λex/λem (nm/nm) |
Stokes Δλ (nm) |
Intensity F |
| Rayleigh scattering peaks |
235/235 → 350/350 |
0 |
263.3 → 1034 |
235/235 → 350/350 |
0 |
279.6 → 1047 |
| Fluorescence peak 1 |
280.0/321.0 |
41.0 |
227.1 |
280.0/324.0 |
44.0 |
207.3 |
| Fluorescence peak 2 |
230.0/331.0 |
101.0 |
163.3 |
230.0/334.0 |
104.0 |
157.8 |
Synchronous fluorescence
The synchronous fluorescence technique was introduced by Lloyd and Evett in 197147 and it can be used to provide information about the molecular environment in the vicinity of the chromophore molecules. When the D-value (Δλ) between excitation and emission wavelengths was fixed at 15 or 60 nm, the synchronous fluorescence gives the distinctive information on Tyr or Trp residues.48 The effect of malachite green in hemoglobin synchronous fluorescence is shown in Fig. 9, a slight red shift can be observed (from 277 nm to 282.2 nm) when Δλ = 60 nm, the bathochromic effect clearly shows that the structural state of hemoglobin was changed and there was an increased hydrophilicity in the vicinity of Trp residues. The fluorescence intensity diminished regularly with the addition of malachite green, which further demonstrated the occurrence of fluorescence quenching in the association.
 |
| | Fig. 9 Synchronous fluorescence of hemoglobin (Δλ = 60 nm) at pH = 7.4, plotted as extinction of hemoglobin tryptophan (F/F0) versus malachite green concentration. Each point was the average of three individual experiments ± S.D. ranging from 0.76% to 4.40%. | |
Binding energetics
Essentially, there are four types of noncovalent interactions existing in ligand binding to protein, the hydrophobic effect, hydrogen bonds, van der Waals force, and electrostatic interaction. The sign and magnitude of thermodynamic parameters for protein reactions can elucidate the acting forces contributing to protein stability. Assuming the enthalpy ΔH° does not vary obviously over the temperature range studied, the three thermodynamic functions are related by the following equations:| |  | (4) |
where K is the binding affinity for a given association reaction under a specified set of experimental conditions, R is the gas constant, T is the absolute temperature, and the superscript “°” shows the value of the property of a molar concentration of unity. From the linear relationship between ln K and 1/T (Fig. 10), the thermodynamic parameters were received and listed in Table 3. The negative sign for ΔG° means that the molecular recognition process was spontaneous and the formation of the macromolecule–ligand complex was an exothermic reaction accompanied by a negative ΔS° value. The signs and magnitudes of the thermodynamic parameters associated with various individual types of interaction that may happen in protein association processes have been summarized by Ross and Subramanian.49 For typical hydrophobic effects, both ΔH° and ΔS° are positive, while they are negative for van der Waals forces and hydrogen bond formation in low dielectric medium. Further, specific electrostatic interactions between ionic species in aqueous solution were expressed by a positive value of ΔS° and a negative ΔH° (almost zero). A negative ΔH° value is observed whenever there are hydrogen bonds in the binding events. In the present case of the hemoglobin–malachite green complex (as shown in Table 3), the negative ΔH° (−28.18 kJ mol−1) and ΔS° (−14.92 J mol−1 K−1) attested that both hydrogen bonds and van der Waals forces play a foremost role in the molecular recognition of malachite green by biomacromolecules.
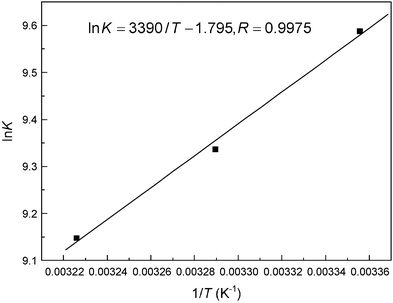 |
| | Fig. 10 van't Hoff plot for the molecular recognition of malachite green by hemoglobin in Tris-HCl buffer, pH = 7.4. | |
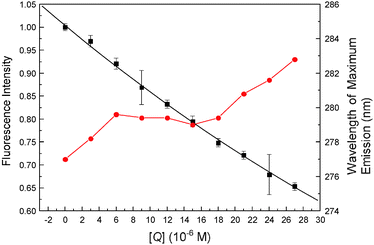
Hydrophobic ANS probe
Fluorescent dye 8-anilino-1-naphthalenesulfonic acid (ANS) is sensitive to microenvironmental changes and can inspect the structure and interactions of proteins, for this reason, it has been utilized to provide information on all the hydrophobic binding sites in biomicromolecules.50,51 In order to further investigate the essence of the complexation of malachite green with hemoglobin, binding studies were conducted in the presence of ANS under identical conditions. The relative fluorescence intensity (F/F0) versus ligand concentration ([Ligand]) plots are shown in Fig. 11. At a ligand concentration of 27 μM, both malachite green and ANS decrease β-37 Trp residue fluorescence, but the degree of quenching by malachite green was less than ANS; malachite green could quench the fluorescence by about 29.72%, whereas ANS could diminish by about 40.27% of Trp-37 residue fluorescence. Moreover, the dye, malachite green, when added to the hemoglobin–ANS mixture, can compete with ANS for the hydrophobic portion, and the fluorescence intensity should weaken. The reason is that ANS is essentially nonfluorescent when in aqueous solution, but it will become highly fluorescent in nonpolar solvents or when it is bound to proteins. In this work, approximately 40% displacement of ANS fluorescence alludes to hydrophobic patches being the major sites for malachite green binding on hemoglobin. These results corroborated the molecular modeling simulation results that the malachite green lies at the hydrophobic patch of hemoglobin.
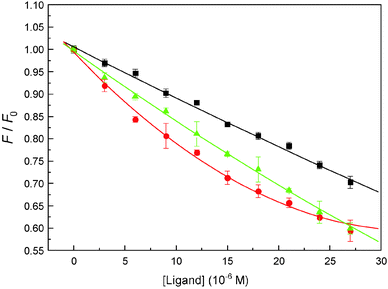 |
| | Fig. 11 Fluorescence quenching patterns of hemoglobin and the ANS-hemoglobin system at pH = 7.4, T = 298 K. The binding isotherm of malachite green (■) and ANS (●) caused quenching of hemoglobin Trp residue fluorescence and quenching of ANS–hemoglobin adduct fluorescence by malachite green (▲). All data were corrected for quencher fluorescence. Each point was the average of three individual measurements ± S.D. ranging from 0.22% to 2.77%. | |
Comparison with albumin and α1-acid glycoprotein
As mentioned previously, binding of ligands to protein is exceptionally vital for it can affect the distribution and elimination of the ligand as well as the duration and intensity of its pharmacological and toxicological action. There are some reports indicating that malachite green can complex with albumin.30,52 In this task, the albumin binding manner of malachite green was assessed by employing the molecular docking approach below. The most reasonable docking energy result is shown in Fig. 12(A) (entry codes: 1AO6, resolution 2.5 Å);53 the malachite green binding site is situated within subdomain IIA in Sudlow's site constituted by six helices. As can be seen in Fig. 12(A), for the nitrogen atom on the B-ring and the amino group in Lys-195, and the oxygen atom of the hydroxyl group in Ser-202, the bond lengths, respectively, are 2.61 Å and 2.78 Å. In addition, the perpendicular molecular distance between the nucleus of the C-ring in the ligand and the center of benzene ring in Trp-214 is 2.95 Å, which can show the existence of evident π–π interactions. Besides, the positive nitrogen atom can cause cation–π interaction with the pyrrole ring on Trp-214, with the distance from the positive nitrogen atom to the heart of the pyrrole ring being 3.30 Å. Malachite green is also surrounded by hydrophobic residues: Lys-195, Leu-198, Lys-199, Leu-203, Phe-211, Trp-214 and Tyr-452, which implied that there is notable hydrophobic interaction between them.
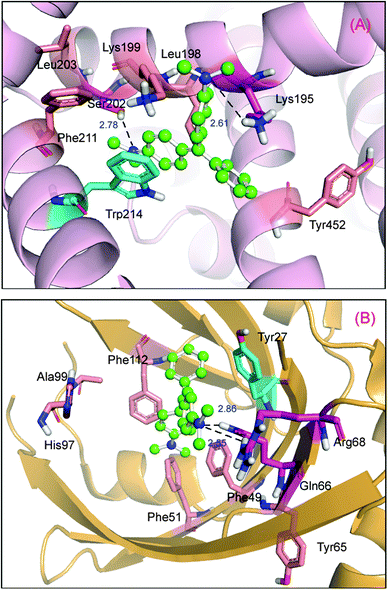 |
| | Fig. 12 Molecular modeling of malachite green docked to albumin and α1-acid glycoprotein. Panel (A) shows docked malachite green into albumin at active sites, albumin is represented as a surface colored in light pink, the ball-and-stick model indicates malachite green, colored by element and the key amino acid residues around malachite green have been depicted using a stick model, the light magenta stick model reveals hydrogen bonds between Lys-195, Ser-202 and malachite green; the cyan stick model reveals π–π interaction between Trp-214 and the ligand; the salmon stick model explains hydrophobic interactions between Leu-198, Lys-199, Leu-203, Phe-211 and Tyr-452 residues and malachite green. Panel (B) shows docked malachite green into the α1-acid glycoprotein at the active site, α1-acid glycoprotein represented as a surface colored in bright orange. The ball-and-stick model indicates malachite green, colored by element and the key amino acid residues around malachite green has been depicted using the stick model, the light magenta stick model reveals hydrogen bonds between Glu-66, Arg-68 and malachite green; the cyan stick model reveals T–π interaction between Tyr-27 and the ligand; the salmon stick model explains hydrophobic interactions between Phe-49, Phe-51, Tyr-65, His-97, Ala-99 and Phe-112 residues and malachite green. | |
As for α1-acid glycoprotein–malachite green, there is not yet any relative research targeting the binding mechanism of the complex system. In the current study, we sought to decipher the nature of the α-acid glycoprotein binding mode of malachite green by using the molecular modeling method, and the best docking energy result is shown in Fig. 12(B) (entry codes: 3APU, resolution 2.10 Å).54 The positive nitrogen atom can form two hydrogen bonds with the hydrogen atom of the amino group in Arg-68 and the hydrogen atom of the amino group in Gln-66, the bond lengths are 2.86 Å and 2.55 Å, respectively. Moreover, the perpendicular distance between the heart of the A-ring in malachite green and the nucleus of benzene in Tyr-127 is 4.52 Å, which obviously shows the existence of T–π interaction. The whole structure of malachite green is in the hydrophobic patch that is composed of Tyr-27, Phe-49, Phe-51, Tyr-65, His-97, Ala-99 and Phe-112 residues. In view of the molecular modeling results, it is evident that the hydrogen bonds, T–π, π–π and hydrophobic interactions exist between the malachite green and model proteins, this outcome based on computational analyses is important and needs to be confirmed by further experimental data and discussion.
Concluding remarks
Malachite green is a triphenylmethane dye widely used to prevent fungal infections in commercial fisheries because of its excellent antifungal properties. However, accumulating evidence has shown its potential toxic or cancer-related hazards to humans by animal experiments. Culp55 performed the toxicologic and carcinogenic studies of malachite green and provided equivocal evidence of carcinogenic activity in female F344/N rats. Malachite green induces genotoxicity that can directly give rise to the liver adenomas in female rats. Furthermore, the structural similarity of malachite green to the carcinogenic arylamine dye and experimental evidence for its tumor promoting activity suggest the potential for adverse health effects upon exposure to malachite green.
Our work has stated and expounded clearly the conjugation of malachite green to hemoglobin, and the computational simulation, fluorescence, CD spectra and extrinsic ANS displacement were employed to uncover the coordination of malachite green to hemoglobin. According to the results of molecular modeling, we could find that the malachite green binding site is located at the domain composed of α1 and β2 subunits on hemoglobin and close to the Trp-37 residue, this corroborates the hydrophobic ANS probe results that the dye molecule lies in the central hydrophobic cavity of hemoglobin. Further, fluorescence emission data have shown that the binding of malachite green to hemoglobin was due to the formation of a protein–malachite green complex, which is consistent with the time-resolved fluorescence measurements indicating that static quenching does appear to be the predominant cause in this reaction process. The secondary structure of hemoglobin proved to be changed after the addition of malachite green with a reduction of the α-helix and an increase in the β-sheet, turn and random coil, symbolizing a partial destabilization of protein. This shows that malachite green bound with amino acid residues of the polypeptide chain through noncovalent interactions, such as hydrogen bonds, π-conjugated effects and hydrophobic interactions, with a relatively moderate affinity of 104 M−1. Based on computational analyses, it is noticeable that the triphenylmethane, malachite green, complexes with albumin and α1-acid glycoprotein through noncovalent bonds, such as hydrogen bonds, T–π, π–π and hydrophobic interactions, and several salient amino acid residues, e.g. Lys, Trp, Ser, all took part in the reaction processes. Since hemoglobin is an important protein in the human body and can act as a model protein to help investigate the binding mechanism of ligands, the binding interaction of malachite green with hemoglobin is greatly essential in toxicology. This study is also expected to provide important insight into the reaction of hemoglobin with malachite green, which can provide useful guidelines for further toxicological investigation.
Funding
This work was executed under the auspices of the National Natural Science Foundation of China (No. 31171693) and the National Key Technology R & D Program (No. 2011BAE06B05-5).
Notes
The authors declare no competing financial interest.
Acknowledgements
We are particularly indebted to Professor Ulrich Kragh-Hansen of the Department of Medical Biochemistry, University of Aarhus, for the priceless gift of his doctoral dissertation. Thanks also go to the reviewers of this manuscript for their insightful comments.
References
- U. Kragh-Hansen, S. O. Brennan, M. Galliano and O. Sugita, Mol. Pharmacol., 1990, 37, 238–242 CAS.
- M. F. Perutz, M. G. Rossmann, A. F. Cullis, H. Muirhead, G. Will and A. C. T. North, Nature, 1960, 185, 416 CrossRef CAS.
-
M. M. Cox and G. N. Phillips Jr., Handbook of Proteins: Structure, Function and Methods, Wiley, West Sussex, 2007, vol. 2 Search PubMed.
- M. F. Perutz, Br. Med. Bull., 1976, 32, 193–194 CAS.
- R. W. Lucek and C. B. Coutinho, Mol. Pharmacol., 1976, 12, 612–619 CAS.
- N. Shahabadi, M. Maghsudi, Z. Kiani and M. Pourfoulad, Food Chem., 2011, 124, 1063–1068 CrossRef CAS PubMed.
- S. J. Culp and F. A. Beland, J. Am. Coll. Toxicol., 1996, 15, 219–238 CrossRef.
- Y. C. Sharma, J. Chem. Eng. Data, 2011, 56, 478–484 CrossRef CAS.
- S. Srivastava, R. Sinha and D. Roy, Aquat. Toxicol., 2004, 66, 319–329 CrossRef CAS PubMed.
- G. H. Jang, I.-S. Park, S. H. Lee, T.-L. Huh and Y. M. Lee, Biochem. Biophys. Res. Commun., 2009, 382, 486–491 CrossRef CAS PubMed.
- B. H. Hammeed and M. I. El-Khaiary, J. Hazard. Mater., 2008, 153, 701–708 CrossRef PubMed.
- L. A. Pérez-Estrada, A. Agüera, M. D. Hernando, S. Malato and A. R. Fernández-Alba, Chemosphere, 2008, 70, 2068–2075 CrossRef PubMed.
- E. G. Snyderwine, R. Sinha, J. S. Felton and L. R. Ferguson, Mutat. Res., Fundam. Mol. Mech. Mutagen., 2002, 506–507, 1–8 CrossRef CAS.
- Y. Z. Guo, P. P. Gai, T. T. Hao, J. Duan and S. Wang, J. Agric. Food Chem., 2011, 59, 5257–5262 CrossRef PubMed.
- S. K. Khanna, G. B. Singh and S. G. Singh, J. Food Sci. Technol., 1973, 10, 33–36 CAS.
- S. J. Culp and F. A. Beland, Int. J. Toxicol., 1996, 15, 219–238 CrossRef.
- K. V. K. Rao, Toxicol. Lett., 1995, 81, 107–113 CrossRef CAS.
- P. Debnam, S. Glanville and A. G. Clark, Biochem. Pharmacol., 1993, 45, 1227–1233 CrossRef CAS.
- C. Fernandes, V. S. Lalitha and K. V. K. Rao, Carcinogenesis, 1991, 12, 839–845 CrossRef CAS PubMed.
- R. A. Mittelstaedt, N. Mei, P. J. Webb, J. G. Shaddock, V. N. Dobrovolsky, L. J. McGarrity, S. M. Morris, T. Chen, F. A. Beland, K. J. Greenlees and R. H. Heflich, Mutat. Res., Fundam. Mol. Mech. Mutagen., 2004, 561, 127–138 CrossRef CAS PubMed.
- S. J. Culp, P. W. Mellick, R. W. Trotter, K. J. Greenlees, R. L. Kodell and F. A. Reland, Food Chem. Toxicol., 2006, 44, 1204–1212 CrossRef CAS PubMed.
- S. J. Culp, F. A. Heflich, R. W. Benson, L. R. Blankenship, P. J. Webb, P. W. Mellick, R. W. Trotter, S. D. Shelton, K. J. Greenlees and M. G. Manjanatha, Mutat. Res., Fundam. Mol. Mech. Mutagen., 2002, 506–507, 55–63 CrossRef CAS.
- J. Zhang, Y. Li, C. L. Zhang and Y. M. Jing, J. Hazard. Mater., 2008, 150, 774–782 CrossRef CAS PubMed.
- N. Daneshvar, A. R. Khataee, M. H. Rasoulifard and M. Pourhassan, J. Hazard. Mater., 2007, 143, 214–219 CrossRef CAS PubMed.
- I. Hasni, P. Bourassa and H. A. Tajmir-Riahi, J. Phys. Chem. B, 2011, 115, 6683–6690 CrossRef CAS PubMed.
- J. A. Lukin and C. Ho, Chem. Rev., 2004, 104, 1219–1230 CrossRef CAS PubMed.
- S. C. Huang, E. S. Peterson, C. Ho and J. M. Friedman, Biochemistry, 1997, 36, 6197–6206 CrossRef CAS PubMed.
- U. Kragh-Hansen, Pharmacol. Rev., 1981, 33, 17–53 CAS.
- D. Charbonneau, M. Beauregard and H. A. Tajmir-Riahi, J. Phys. Chem. B, 2009, 113, 1777–1784 CrossRef CAS PubMed.
- Y. Z. Zhang, B. Zhou, X. P. Zhang, P. Huang, C. H. Li and Y. Liu, J. Hazard. Mater., 2009, 163, 1345–1352 CrossRef CAS PubMed.
- A. A. Romeo, J. A. Capobianco and A. M. English, J. Am. Chem. Soc., 2003, 125, 14370–14378 CrossRef CAS PubMed.
- S.-Y. Park, T. Yokoyama, N. Shibayama, Y. Shiro and J. R. Tame, J. Mol. Biol., 2006, 360, 690–701 CrossRef CAS PubMed.
-
J. R. Lakowicz, Principles of Fluorescence Spectroscopy, third ed., Springer Science + Business Media, New York, 2006, pp. 63–606 Search PubMed.
- N. J. Greenfield, Nat. Protocols, 2006, 1, 2876–2890 CAS.
- O. K. Abou-Zied, N. Al-Lawatia, M. Elstner and T. B. Steinbrecher, J. Phys. Chem. B, 2013, 117, 1062–1074 CrossRef CAS PubMed.
- S. Y. Bi, L. Ding, Y. Tian, Q. D. Song, X. Zhou, X. Liu and H. Q. Zhang, J. Mol. Struct., 2004, 703, 37–45 CrossRef CAS PubMed.
- R. M. Esquerra, I. López-Peña, P. Tipgunlakant, I. Birukou, R. L. Nguyen, J. Soman, J. S. Olson, D. S. Kliger and R. A. Goldbeck, Phys. Chem. Chem. Phys., 2010, 12, 10270–10278 RSC.
-
R. K. Murray, D. K. Granner, P. A. Mayes and V. W. Rodwell, Harper's Illustrated Biochemistry, 26th ed., McGraw-Hill Companies, Inc., New York, 2003 Search PubMed.
- N. Zahid, O. K. Abou-Zied, R. Hashim and T. Heidelberg, Langmuir, 2012, 28, 4989–4995 CrossRef CAS PubMed.
- O. K. Abou-Zied and N. Al-Lawatia, J. Phys. Chem. A, 2011, 115, 4195–4201 CrossRef PubMed.
- O. K. Abou-Zied, RSC Adv., 2013, 3, 8747–8755 RSC.
- B. Alpert, D. M. Jameson and G. Weber, Photochem. Photobiol., 1980, 31, 1–4 CrossRef CAS.
- M. Mahato, P. Pal, T. Kamilya, R. Sarkar, G. B. Chaudhuri and J. Talapatra, J. Phys. Chem. B, 2010, 114, 7062–7070 CrossRef CAS PubMed.
- O. K. Abou-Zied and N. Al-Lawatia, ChemPhysChem, 2011, 12, 270–274 CrossRef CAS PubMed.
- N. J. Greenfield, Nat. Protocols, 2006, 1, 2527–2535 CAS.
- D. Agudelo, P. Bourassa, J. Bruneau, G. Bérubé, É. Asselin and H. A. Tajmir-Riahi, PLoS One, 2012, 7, e43814 CAS.
- J. B. F. Lloyd and I. W. Evett, Anal. Chem., 1977, 49, 1710–1715 CrossRef CAS.
- C. W. Fuller and J. N. Miller, Proc. Anal. Div. Chem. Soc., 1979, 16, 199–208 RSC.
- P. D. Ross and S. Subramanian, Biochemistry, 1981, 20, 3096–3102 CrossRef CAS.
- L. Stryer, J. Mol. Biol., 1965, 13, 482–495 CrossRef CAS.
- O. K. Abou-Zied and O. I. Al-Shihi, J. Am. Chem. Soc., 2008, 130, 10793–10801 CrossRef CAS PubMed.
- O. Tacal and I. Ozer, J. Biochem. Mol. Toxicol., 2004, 18, 253–256 CrossRef CAS PubMed.
- S. Sugio, A. Kashima, S. Mochizuki, M. Noda and K. Kobayashi, Protein Eng., 1999, 12, 439–446 CrossRef CAS PubMed.
- K. Nishi, T. Ono, T. Nakamura, N. Fukunaga, M. Izumi, H. Watanabe, A. Suenaga, T. Maruyama, S. Curry and M. Otagiri, J. Biol. Chem., 2011, 286, 14427–14434 CrossRef CAS PubMed.
- S. J. Culp, Toxic. Rep. Ser., 2004, 71, 1–F10 Search PubMed.
Footnote |
| † These authors contributed equally to this work. |
|
| This journal is © The Royal Society of Chemistry 2014 |
Click here to see how this site uses Cookies. View our privacy policy here. 


