DOI:
10.1039/C2GC36715G
(Paper)
Green Chem., 2013,
15, 245-254
Bio-based epoxy resin from itaconic acid and its thermosets cured with anhydride and comonomers
Received
11th August 2012
, Accepted 9th November 2012
First published on 9th November 2012
Abstract
A novel itaconic acid (IA) based epoxy resin with curable double bonds (EIA) was synthesized by the esterification reaction between IA and epichlorohydrin (ECH). Its chemical structure was confirmed in detail by FT-IR, 1H-NMR and ESI-ION TRAP MS before being cured by methyl hexahydrophthalic anhydride (MHHPA). In order to manipulate the properties of the cured resin, divinyl benzene (DVB) and acrylated epoxidized soybean oil (AESO) were employed here to act as comonomers. The results demonstrated that EIA showed a higher epoxy value of 0.625 and higher curing reactivity toward MHHPA compared with the commonly used diglycidyl ether of bisphenol A (DGEBA). The glass transition temperature, tensile strength, flexural strength and modulus of the cured EIA without comonomers were 130.4 °C, 87.5 MPa, 152.4 MPa and 3400 MPa, respectively, which were comparable or better than those of DGEBA cured by the same curing agent. After being copolymerized with DVB or AESO, the properties of the cured EIA could be regulated further. The results indicated that EIA has great potential to replace the petroleum-based thermosetting resin, such as DGEBA.
1. Introduction
Due to the increasing concern about the depletion of fossil reserves and greenhouse gas emission, a large range of natural polymers and bio-based thermoplastics, such as starch, cellulose, polylactic acid (PLA) and polyhydroxyalkanoates (PHA) as well as the polyethylene derived from sugar cane1–3 have been developed as the ideal products to replace petroleum-based polymeric materials. However, compared with the rapid progress on bio-based thermoplastics,4 research on bio-based thermosetting resins has been overlooked.5–7
Epoxy resin is one of the most important thermosetting resins because of its superior mechanical properties, excellent thermal resistance and good processability.8–10 Diglycidyl ether of bisphenol A (DGEBA), which represents more than 90% of the epoxy precursors in the world, is by far the most widely used monomer to formulate epoxy networks.5 Although acetone, together with butanol and ethanol, has been produced by White Biotechnology using the ABE-process7 and epichlorohydrin (ECH, one of the main precursors to produce DGEBA) is more and more being made from bio-based glycerol according to the Solvay Epicerol® and DOW GTE technologies,11,12 commercial bisphenol A, accounting for more than 67% of the molar mass of DGEBA, is largely dependent on fossil resources. In addition, bisphenol A appears to be both an estrogen receptor agonist and an androgen receptor antagonist, and toxic to living organisms.13 Nowadays, its application has been strictly limited in many countries. Therefore there is a huge interest in developing a bio-based or environmentally friendly epoxy resin to replace the conventional DGEBA.
The currently most popular bio-based epoxy resins might be derived from plant oils.14–18 But due to the long aliphatic chain and the low reactivity of epoxy groups, epoxidized plant oil always leads to poorly cross-linked materials with unsatisfactory thermal or mechanical properties.5 At the same time, bio-based glycerol, sorbitol and isosorbide are also employed to produce bio-based epoxy resin and the resulting resins: glycerol polyglycidyl ether, polyglycerol polyglycidyl ether and sorbitol polyglycidyl ether are now industrially available.19 However, their flexible structures usually lead to low glass transition temperatures and they are hard to use individually as structural and engineering plastics.20,21 In order to obtain a bio-based epoxy with high performance (i.e. high glass transition temperature and excellent mechanical properties), a lot of novel rigid compounds from renewable resources, such as lignin22–26 and rosin,27–29 have also been developed. However, lignin based epoxy resins present a slow curing rate and unstable properties due to the low mobility of the macromolecular species and complex structures.22,23 The rosin based epoxy resins usually exhibit satisfactory thermal and mechanical properties,27 while its rigid hydrogenated phenanthrene ring structure would induce severe brittleness.29
Itaconic acid (IA), or methylenesuccinic acid, is produced by fermentation of carbohydrates, such as glucose, using Aspergillus terreus. It is a fully sustainable industrial building block with an annual global production of 70![[thin space (1/6-em)]](https://www.rsc.org/images/entities/char_2009.gif) 000–80
000–80![[thin space (1/6-em)]](https://www.rsc.org/images/entities/char_2009.gif) 000 tons reported in 2002.30 Now, the annual global production is estimated at more than 150
000 tons reported in 2002.30 Now, the annual global production is estimated at more than 150![[thin space (1/6-em)]](https://www.rsc.org/images/entities/char_2009.gif) 000 tons. Because of its great potential to replace the petrochemicals in the chemical industry, it has been selected as one of the top 12 potential bio-based platform chemicals by U.S. Department of Energy.31 Up to now, it has been proved to be an excellent comonomer32,33 and widely used as the primary sources for emulsion paints34 and paper coating latexes.35 It has been also functionalized by phosphorus and silicon to improve the properties of some polyesters.36,37 To the best of our knowledge, a bio-based epoxy derived from itaconic acid has never been reported.
000 tons. Because of its great potential to replace the petrochemicals in the chemical industry, it has been selected as one of the top 12 potential bio-based platform chemicals by U.S. Department of Energy.31 Up to now, it has been proved to be an excellent comonomer32,33 and widely used as the primary sources for emulsion paints34 and paper coating latexes.35 It has been also functionalized by phosphorus and silicon to improve the properties of some polyesters.36,37 To the best of our knowledge, a bio-based epoxy derived from itaconic acid has never been reported.
In this study, a novel itaconic acid based epoxy resin with double bonds (EIA) was synthesized by the esterification reaction between IA and ECH. The epoxy network was obtained by the epoxy ring-opening reaction with MHHPA as the curing agent and its properties were studied. In order to regulate the properties of the resulting resins further, DVB and AESO were employed here to act as the comonomers. For comparison, DGEBA cured with the same curing agent was also investigated. The objective of this work is to synthesize a bio-based epoxy from IA and then evaluate its possibility to partially replace DGEBA in some fields. The results from this study could provide us with important information to design and develop a novel bio-based epoxy resin with high performance.
2. Experimental
2.1 Materials
Itaconic acid (IA) was purchased from Zhejiang Guoguang Biochemistry Co., Ltd, China. Epichlorohydrin (ECH), hexadecyl trimethyl ammonium bromide (HTAB or CTAB) and dilauroyl peroxide (LPO) were from Aladdin Reagent, China. Tetrabutyl ammonium bromide (TBAB), sodium hydroxide and divinyl benzene (DVB) were supplied by Sinopharm Chemical Reagent Co., Ltd, China. Methyl hexahydrophthalic anhydride (MHHPA) was obtained from Gracia chemical technology co., Ltd, China. Acrylated epoxidized soybean oil (AESO) with double bond content of 7.046 wt% was supplied by Jiangsu Litian Technology Co., Ltd, China. Diglycidyl ether of bisphenol A (DGEBA) with epoxide equivalent weight of 182–192 g eq.−1 was purchased from DOW Chemical Company. All the chemicals were used as received.
2.2 Preparation of itaconic acid based epoxy resin (EIA)
50 g IA, 355.5 g ECH and 1.5 g TBAB were placed in a three-necked round-bottomed flask with a magnetic stirrer, a thermometer and a reflux condenser. After the reactants were mixed vigorously at room temperature for 10 min, it was heated to about 105 °C and maintained at this temperature for another 0.5 h under nitrogen flow. Then the mixture was cooled to 50 °C and 80 g aqueous solution of sodium hydroxide (50 wt%) was added drop by drop. After that, the reaction was kept at 50 °C for 3 h before it was washed with deionized water five times. About 68.1 g itaconic acid based epoxy resin (EIA) was obtained after removing the water and residual ECH on a rotary evaporator. The epoxy value of EIA determined by hydrochloric acid–acetone method was about 0.625. The synthetic scheme is shown in Fig. 1.
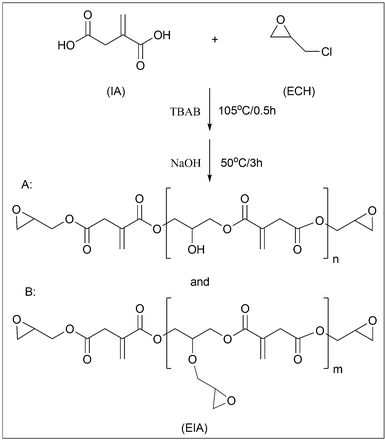 |
| | Fig. 1 The synthetic route to EIA. | |
2.3 Preparation of epoxy networks
The predetermined DVB or AESO, a stoichiometric amount of MHHPA (the molar ratio of MHHPA to epoxy group is 0.75/1), 0.1 wt% CTAB and 0.6 wt% LPO (on the basis of the total weight of curing agent and epoxy) were stirred together until a homogeneous mixture was obtained. After that, it was degassed in a vacuum oven at 60 °C for at least 30 min. Then the gas free mixture was poured into a preheated stainless steel mould and cured at 120 °C for 2 h, 150 °C for 2 h and 180 °C for 2 h to obtain a completely cured resin. The cured EIA/MHHPA systems with different contents of DVB or AESO were prepared according to the programs shown in Fig. 2. Their compositions and codes are listed in Table 1. All the samples were cured under the same conditions.
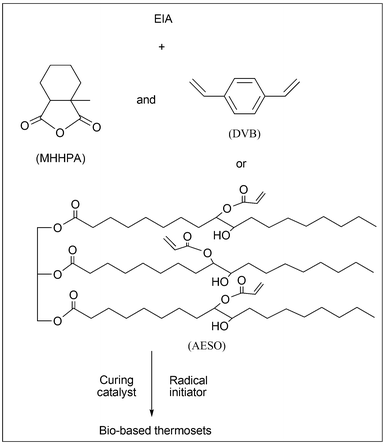 |
| | Fig. 2 The scheme for the curing process. | |
Table 1 The composition and activation energy (Ea) for the different systems
| Sample |
EIA/DVB/AESO/DGEBA weight ratio |
E
a![[thin space (1/6-em)]](https://www.rsc.org/images/entities/char_2009.gif) a/kJ mol−1 a/kJ mol−1 |
| Kissinger |
Ozawa |
|
L and H represent the activation energy of the reactions occurring at the lower and higher temperatures, respectively, during DSC scanning.
|
| EIA0 |
100/0/0/0 |
66.9 |
70.2 |
| EIA-D5 |
100/5/0/0 |
— |
— |
| EIA-D10 |
100/10/0/0 |
99.5(L), 65.5(H) |
101.3(L), 68.9(H) |
| EIA-D20 |
100/20/0/0 |
— |
— |
| EIA-A5 |
100/0/5/0 |
— |
— |
| EIA-A10 |
100/0/10/0 |
106.6(L), 67.1(H) |
107.3(L), 70.3(H) |
| EIA-A20 |
100/0/20/0 |
— |
— |
| DGEBA |
0/0/0/100 |
81.8 |
79.9 |
2.4 Characterization
The infrared spectrum (FT-IR) was recorded with NICOLET 6700 FT-IR (NICOLET, America). 1H-NMR was performed on a 400 MHz AVANCE III Bruker NMR spectrometer (Bruker, Switzerland) with CDCl3 as a solvent. Mass spectrum (MS) was recorded with an Esquire6000 ESI-ION TRAP mass spectrometry (Bruker Daltonics, America). The non-isothermal curing reaction was monitored on a Mettler-Toledo MET DSC (METTLER TOLEDO, Switzerland) under a nitrogen atmosphere. A heat scan ranging from 25–225 °C was performed at the heating rates of 2, 5, 8, and 10 °C min−1, respectively. The curves of heat flow as a function of time were recorded for activation energy analysis. The cured epoxy resins were cut into small pieces and about 9 mg of sample was taken for the glass transition temperature measurement. It was heated to 200 °C and held there for 3 min to eliminate any thermal history. Then it was cooled to 25 °C at a cooling rate of 50 °C min−1 and followed by heating again to 200 °C at a rate of 20 °C min−1. The glass transition temperature was obtained from the peak temperature of the differential curve of the second heating curve of the cured epoxy resins. The rheological behavior of the epoxy resin was studied by dynamic oscillation using a dynamic analyzer Physica MCR-301 of Rheometric (Anton Paar, Austria) with parallel plate tools. The plate diameter and its gap were 25.0 mm and 0.30 mm, respectively. It was carried out with a heating rate of 3 °C min−1, an angular frequency of 1 Hz and an initial ramp strain between 10% and 0.5%. The curing temperature ranged from 40–200 °C and the storage modulus (G′), loss modulus (G′′) and dynamic viscosity (η) were registered as a function of temperature. Thermogravimetric analysis (TGA) was performed on a Mettler-Toledo TGA/DSC1 Thermogravimetric Analyzer (METTLER TOLEDO, Switzerland) with high purity nitrogen or air as purge gas at a scanning rate of 10 °C min−1 from 50–700 °C. Dynamic mechanical analysis (DMA) was carried out on Mettler-Toledo DMA/SDTA861e using a three points bending fixture. All the samples with the dimension of 64 mm × 10 mm × 3.5 mm were tested from 30–250 °C at a heating rate of 2 °C min−1 and a frequency of 1 Hz. The mechanical properties of the cured resins were measured with an Instron 5567 Electric Universal Testing Machine (Instron, America). For the tensile testing, the cross-head speed was selected to be 10 mm min−1 according to GB/T 1040.2-2006 and the gauge length of the specimens was 50 mm. For the flexural strength measurement, the three-point bending method was employed and the span length was 48 mm with a cross-head speed of 2 mm min−1. The data was taken from an average of at least five specimens for accuracy. The adhesion strength was measured according to ASTM 1002-01 with some modifications. The adhesion testing experimental geometry is shown in Fig. 3. The overlap of steel (DC01) with the size of 25.4 mm (the width of the steel) × 12.7 mm (the length of overlap) was sanded and cleaned using acetone before use. Two steel test pieces were attached by epoxy systems and cured at 120 °C for 2 h, 150 °C for 2 h and 180 °C for 2 h in an oven. The adhesive thickness was controlled at about 0.18 mm by two copper wires with the diameter of 0.18 mm. The bonded test pieces were pulled apart at the room temperature with a cross-head speed of 1.3 mm min−1 on an Instron 5567 Electric Universal Testing Machine (Instron, America).
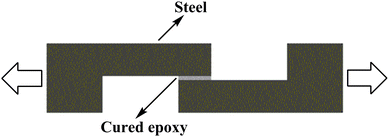 |
| | Fig. 3 The adhesion test geometry for tensile test. | |
3. Results and discussion
3.1 Synthesis and characterization
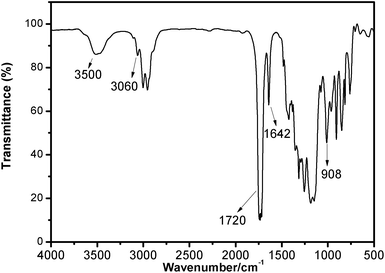
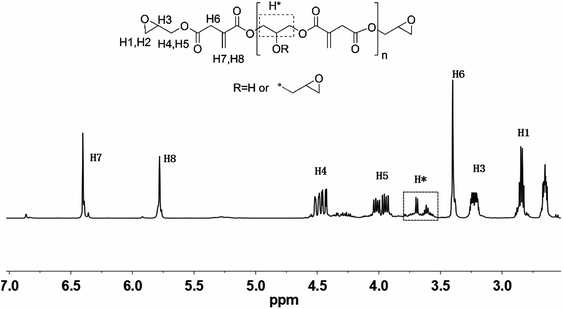
Fig. 4 shows the typical FT-IR spectrum of EIA. The bands at 3060 cm−1 and 1642 cm−1 were assigned to the characteristic peak of the double bond group; the bond at 1720 cm−1 was attributed to the carbonyl stretch (C![[double bond, length as m-dash]](https://www.rsc.org/images/entities/char_e001.gif) O) and the peak at 908 cm−1 indicated the presence of oxirane rings. Based on these data, the chemical structure of EIA was preliminarily determined. In order to further identify its structure, the 1H-NMR spectrum is also shown in Fig. 5. The peaks at 2.6, 2.8 and 3.2 ppm represent the protons H1, H2 and H3 in the ethylene oxide ring. The multiple peaks at 5.8 and 6.4 ppm were attributed to the unsaturated protons H7 and H8 attached to the double bond. Other peaks at 4.5, 4.0 and 3.4 ppm were also identified accordingly. These results adequately indicated the occurrence of the esterification between IA and ECH.
O) and the peak at 908 cm−1 indicated the presence of oxirane rings. Based on these data, the chemical structure of EIA was preliminarily determined. In order to further identify its structure, the 1H-NMR spectrum is also shown in Fig. 5. The peaks at 2.6, 2.8 and 3.2 ppm represent the protons H1, H2 and H3 in the ethylene oxide ring. The multiple peaks at 5.8 and 6.4 ppm were attributed to the unsaturated protons H7 and H8 attached to the double bond. Other peaks at 4.5, 4.0 and 3.4 ppm were also identified accordingly. These results adequately indicated the occurrence of the esterification between IA and ECH.
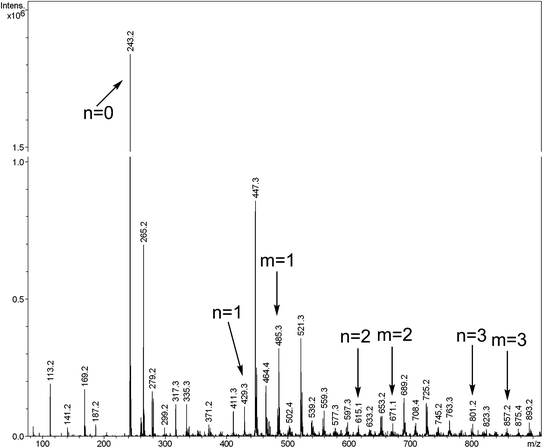
It is well known that the esterification between acid groups and ECH usually results in a mixture of different oligomers and their chemical structures or distribution play the most important role in determining the end-use properties of the cured resin. In order to obtain more precise information on the molar mass and structures of the synthesized EIA, the ESI-ION TRAP mass spectrum is presented in Fig. 6. Obviously, it showed a lot of peaks, which indicated the presence of many oligomers, which could be explained by the competition during the reaction. If ECH always reacted with the carboxy groups of IA, the linear oligomers would be formed and their structures are represented by A in Fig. 1 and Table 2. Their molar masses could be confirmed by exact molar mass analysis and given by M = 242 + 186n (n = 0, 1, 2, 3). When the reaction between ECH and the secondary hydroxyl groups, which were formed during the esterification reaction between IA and ECH, was carried out, the branched oligomers would be found. In Fig. 1 and Table 2, the capital letter B stands for the branched oligomers and their molar masses are given by M = 484 + 186m (m = 1, 2, 3). Although the amount of each oligomer cannot be accurately determined by the peaks of the mass spectrum,19 the intensity of the peak at 243.2 belonging to the diglycidyl ester of IA monomer (where n equals 0) was much higher than other peaks, which could be regarded as the indicator that the diglycidyl ester of IA monomer dominated the oligomer mixture under our experimental conditions.
Table 2 Molar mass values of some EIA oligomers revealed by ESI-ION TRAP MS
| Molar mass/g mol−1 |
Formula |
Structure |
| 242 |
C11H14O6 |
A (n = 0) |
| 428 |
C19H24O11 |
A (n = 1) |
| 484 |
C22H28O12 |
B (m = 1) |
| 614 |
C27H34O16 |
A (n = 2) |
| 670 |
C33H42O18 |
B (m = 2) |
| 800 |
C35H44O21 |
A (n = 3) |
| 856 |
C44H56O24 |
B (m = 3) |
3.2 Curing behavior
Non-isothermal (dynamic) curing behaviors of EIA/MHHPA systems with or without 10 phr (parts per hundreds of resin) DVB/AESO and DGEBA/MHHPA system were studied by DSC and rheological measurements. Fig. 7 shows the DSC curing curves for these systems. It was obvious that the heat flow for the EIA0 and DGEBA system both displayed a single exothermic peak, which corresponded to the ring-opening reaction between epoxy and anhydride groups. However, in the EIA-D10 and EIA-A10 systems, multiple exothermic peaks were observed. The peaks at a lower temperature belonged to the radical copolymerization of DVB or AESO with the double bond of EIA, whereas the peaks at a higher temperature were attributed to the ring-opening reaction between epoxy and anhydride groups. Due to the lower content of double bonds in AESO (about 7 wt%) compared with DVB (35.33 wt%), the peak at the lower temperature of EIA-A10 is much weaker than that of EIA-D10. As we know, under the same curing conditions, the peak temperature of the DSC exothermic curve is often taken as an indicator to evaluate the reactivity of the compound in curing reactions. The lower the temperature of the peak is, the higher the reactivity is.38,39 Obviously, the epoxy group of EIA (the temperature of the exothermic peak is about 165.5 °C) was much more active than that of DGEBA (the temperature of the exothermic peak is 189.5 °C) during the curing reaction with MHHPA. With the introduction of AESO, the exothermic peak for the ring-opening reaction of epoxy group was moved to a lower temperature (161.3 °C), as shown in Fig. 2. The reason might be the presence of hydroxyl groups, which could accelerate the curing reaction between the epoxy groups and the anhydride groups.40
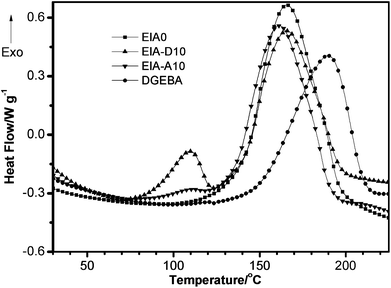 |
| | Fig. 7 DSC thermograms of non-isothermal curing behaviors of EIA/MHHPA systems with or without 10 phr DVB or AESO and DGEBA/MHHPA systems at the heating rate of 8 °C min−1. | |
The activation energy of the curing reaction was determined by both Kissinger's41 and Ozawa's42 methods for accuracy of the results. Based on Kissinger's theory, the activation energy could be obtained from the peak temperatures at different heating rates. The equation is expressed as:
| | | −ln(q/Tp2) = Ea/RTp − ln(AR/Ea) | (1) |
where
q is the heating rate,
Tp is the exothermic peak temperature,
Ea is the activation energy,
R is the gas constant and
A is the pre-exponential factor. A plot of −ln(
q/
Tp2)
versus Ea/
RTp is obtained and the apparent activation energy can be calculated from the slope of the linear fitting plot. As for Ozawa's method, it can be expressed by the following equation:
| | | lnq = −1.052 × Ea/RTp + ln(AEa/R) − lnF(x) − 5.331 | (2) |
where
F(
x) is a conversion dependent term. Therefore,
Ea could be calculated from the slope of linear fitting plot of ln
q versus 1/
Tp.
Fig. 8 shows the plots of −ln(q/Tp2) versus 1/Tp based on Kissinger's equation (a) as well as lnq versus 1/Tp based on Ozawa's theory (b) for the EIA0, EIA-D10, EIA-A10 and DGEBA systems. The calculated Ea are shown in Table 1. As could be seen, Ea of the ring-opening reaction of EIA with MHHPA was lower than that of the DGEBA/MHHPA system, which meant that EIA possessed a higher reactivity than that of DGEBA under the curing of MHHPA. In Fig. 8, EIA-D10(L) and EIA-A10(L) denote the exothermic peaks appearing at the lower temperatures, while the exothermic peaks emerging at the higher temperatures were represented by EIA-D10(H) and EIA-A10(H). According to the above analysis, the activation energy of the ring-opening reaction between epoxy and anhydride group in the EIA-D10 and EIA-A10 systems was calculated to be about 68 kJ mol−1, which were shown as 67.1(H)/70.3(H) and 65.5(H)/68.9(H) in Table 1. Obviously, they were similar to that of the EIA0 system. This indicated that the radical copolymerization of EIA with DVB and AESO had no effect on the ring-opening reaction of epoxy with anhydride groups. The activation energies of the radical copolymerization of EIA with DVB and AESO were also determined based on the Kissinger's equation and Ozawa's theory. As shown in Table 1, the radical copolymerization Ea of EIA/AESO system (106.6(L)/107.3(L)) was higher than that of EIA/DVB system (99.5(L)/101.3(L)), which indicated that DVB was more active than AESO during the copolymerization reaction.
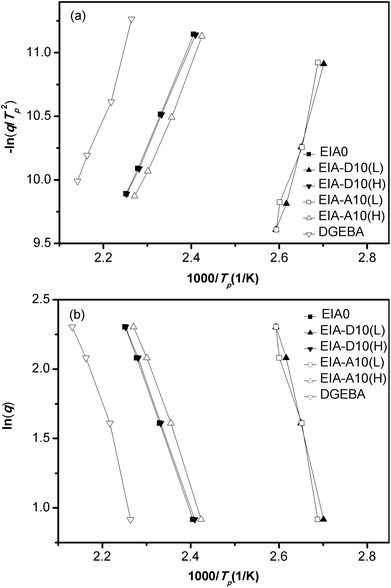 |
| | Fig. 8 Linear plot of −ln(q/Tp2) versus 1/Tp based on Kissinger's equation (a) and lnq versus 1/Tp based on Ozawa's theory (b). | |
Among the physicochemical methods for studying the curing process, rheokinetics is the closest to calorimetry,43 yielding both combined characteristics of the chemical dynamics of the process and morphological changes.44Fig. 9 presents the variation of the viscoelastic properties during the curing reaction. The storage modulus (G′), loss modulus (G′′) and dynamic viscosity (η) as a function of temperature were recorded for analysis. It was obvious that the gelation occurred at a lower temperature for the EIA/MHHPA system compared with the DGEBA/MHHPA system, as indicated by the intersection of G′ and G′′ curves. This crossover point denotes the transition from viscous dominant behavior (G′′ > G′) to elastic behavior (G′ > G′′), which is caused by the sufficient entanglements of polymer chains.44 Nevertheless, the curing reaction of the EIA-A10 system seems to finish at one stage, which was different from the EIA-D10 system and disagreed with the DSC measurement. This might be due to the low double bond content and low degree of radical copolymerization in AESO, which caused the slightly increased G′ from the copolymerization to be counteracted by the decreased G′ from the increased temperature. As a result, during the reaction the variation of the viscoelastic properties was not obvious at the first stage for the EIA-A10 system. As shown in Fig. 9, the η for the cured epoxy networks demonstrated the same variation trend as G′ as a function of temperature, because they were both dependent on the crosslink density of the networks in the non-isothermal curing process when reaching the curing temperatures.
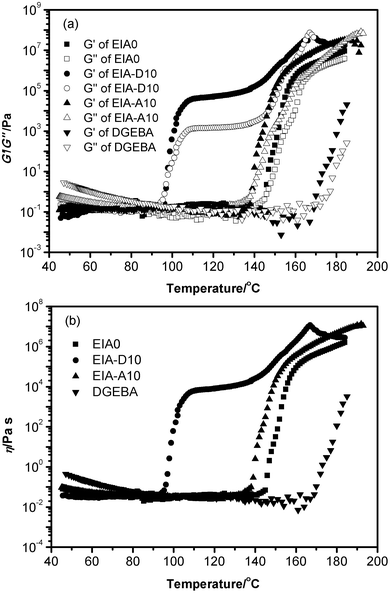 |
| | Fig. 9 Storage modulus (G′), loss modulus (G′′) (a) and dynamic viscosity (η) (b) as a function of temperature. | |
3.3 Thermal properties
The dynamic mechanical analysis (DMA) was used to determine the crosslink density (νe) and glass transition temperature (Tg) of the cured systems. The storage modulus (E′) obtained from DMA in the rubbery plateau region (which is 60 °C above Tg) is often used to calculate the crosslink density (νe) based on the following formula:| |  | (3) |
where E′ is the storage modulus of thermoset in the rubbery plateau region at Tg + 60 °C, R is the gas constant, and T is the absolute temperature.45,46
Fig. 10a shows the curves of storage modulus (E′) as a function of temperature for the different cured systems. Their data for E′ at Tg + 60 °C and the calculated νe are shown in Table 3. Obviously, EIA0 based networks demonstrated much higher E′ at Tg + 60 °C and νe than those of the DGEBA system. This might be attributed to the longer molecular chain of DGEBA relative to that of EIA. When DVB was added as the comonomer, the E′ at Tg + 60 °C and νe of EIA based networks were increased rapidly with the increasing content of DVB. But the addition of AESO led to a sharp reduction of its E′ at Tg + 60 °C and νe. Bhuyan et al.47 and Sarwono et al.48 also reported similar results in their studies. This was due to the fact that DVB could act as a crosslink agent and then increase its crosslink density, while the long soft chain of AESO diluted its crosslink point. As we know, the νe of a thermosetting resin plays the most important role in determining its mechanical properties, the above results demonstrated that the cured EIA might have a better mechanical performance than that of the cured DGEBA system and it could be manipulated further by the addition of DVB or AESO.
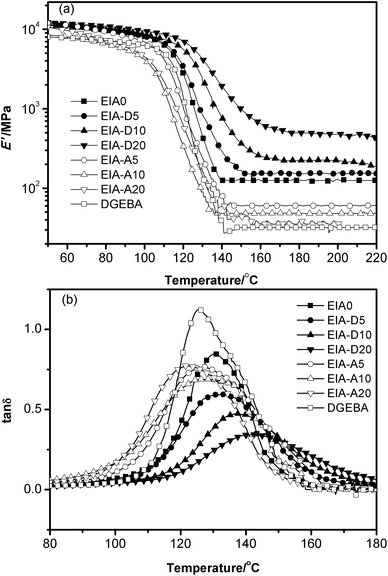 |
| | Fig. 10 Storage modulus (E′) versus temperature (a) and tan δ versus temperature (b) for the cured systems. | |
Table 3 The thermal properties of the cured epoxy resins
| Sample |
E′ at Tg + 60 °C (MPa) |
ν
e (mol m−3) |
T
g (°C) |
T
d 5% (°C) |
R
700 (%) |
| DMA |
DSC |
In N2 |
In air |
In N2 |
In air |
| EIA0 |
124.8 |
10794.1 |
130.4 |
111.2 |
325.9 |
311.1 |
1.51 |
0 |
| EIA-D5 |
152.6 |
13137.9 |
132.6 |
115.2 |
322.9 |
304.8 |
2.73 |
0 |
| EIA-D10 |
224.6 |
19050.8 |
139.4 |
117.2 |
331.5 |
310.3 |
3.17 |
0 |
| EIA-D20 |
477.2 |
40266.0 |
142.0 |
119.5 |
336.8 |
317.9 |
3.25 |
0 |
| EIA-A5 |
60.1 |
5232.0 |
127.4 |
108.5 |
310.4 |
295.6 |
1.84 |
0 |
| EIA-A10 |
48.2 |
4245.8 |
126.7 |
107.7 |
319.6 |
295.5 |
1.84 |
0 |
| EIA-A20 |
38.3 |
3339.3 |
122.0 |
100.1 |
320.1 |
288.0 |
1.88 |
0 |
| DGEBA |
32.0 |
2796.1 |
125.7 |
107.8 |
353.8 |
323.2 |
5.85 |
0 |
Fig. 10b shows the curves of tan δ as a function of temperature for different systems whose Tgs were determined by the peak temperatures of the α-transition. From Table 3, it was easy to note that the Tg of EIA0 was a little bit higher than that of DGEBA. When 20 phr DVB was added, the Tg of EIA based networks increased to as high as 142 °C, while the addition of AESO led to a slight Tg reduction. We all know that the glass transition temperature of epoxy networks is mainly dependent on its crosslink density and the chemical structure of the chain segment. A higher crosslink density or more rigid chain segment will produce a higher Tg. In this work, DVB had a rigid ring structure and increased the crosslink density of the corresponding epoxy network, while the long flexible aliphatic chain of AESO decreased its crosslink density.
The DSC measurement was also employed to investigate the glass transition temperature of the different cured systems in our study. The DSC heating curves for the cured resins are shown in Fig. 11. Apparently, the same results as the DMA test were obtained.
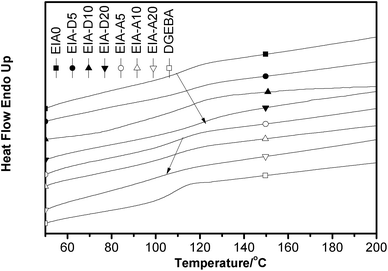 |
| | Fig. 11 DSC curves of the cured epoxy resins. | |
The thermal stability of an epoxy is one of the important factors in determining its end use. TGA is a convenient and most often used method to evaluate the thermal stability and degradation behaviors of polymers.38 The TGA curves under nitrogen and air are shown in Fig. 12. The values of the initial degradation temperature for 5% weight loss (Td 5%) and the residual weight percent at 700 °C (R700) are concluded in Table 3. Based on Fig. 12 and Table 3, the Td 5% and R700 of the EIA based networks were a little bit lower than that of DGEBA based networks. This result indicated that the EIA could be thermally decomposed more easily than DGEBA due to the EIA owned a lot of easily cleavable ester linkages.49 It was also noted that Td 5% and R700 of EIA systems were increased with the increasing content of DVB under N2 atmosphere, while they were decreased with the addition of AESO, especially under air atmosphere. This was because DVB contains a benzene ring, which exhibits higher thermal stability and AESO contains three secondary ester linkages which can be easily thermally cleaved.50 Although the thermal stability of EIA based networks is a little bit lower than that of DGEBA, they might meet the end-use requirement in most areas.
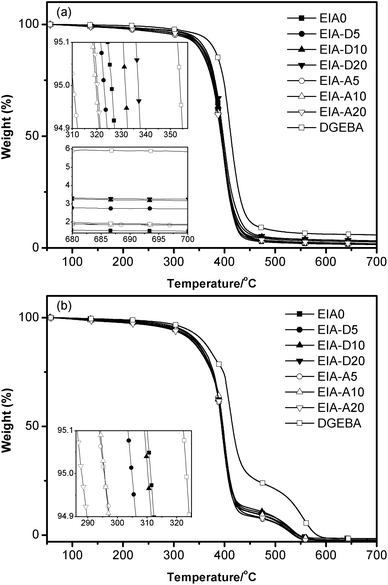 |
| | Fig. 12 TGA curves of the cured epoxy resins under nitrogen (a) and air (b). | |
3.4 Mechanical properties
The mechanical properties of the cured epoxy resins are shown in Fig. 13 and Fig. 14. Obviously, the tensile strength, flexural strength and elongation at break of EIA0 were much higher than those of the cured DGEBA. The higher tensile strength and flexural strength of the EIA based network might be due to the higher crosslink density relative to DGEBA based on the DMA analysis (Table 3). It was also noted that the tensile strength and flexural strength of EIA systems decreased slightly with the incorporation of 5 phr and 10 phr DVB or AESO. But they were sharply decreased when the addition content of DVB or AESO reached at 20 phr. With the increasing content of DVB in the EIA systems, the elongation at break was decreased from 6.36% to 3.82% and the flexural modulus was increased from 3500 MPa to 3700 MPa for EIA-D5 and EIA-D20, respectively. However, EIA-A10 displayed the highest elongation at break (8.33%) and the EIA-A20 possessed the lowest flexural modulus (2900 MPa). These results indicated that the network rigidity of the cured EIA system could be increased by the addition of DVB while its toughness could be adjusted by the incorporation of AESO.
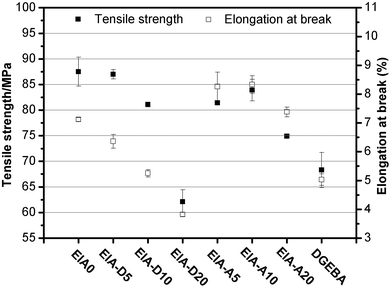 |
| | Fig. 13 Tensile strength and elongation at break of the cured epoxy resins. | |
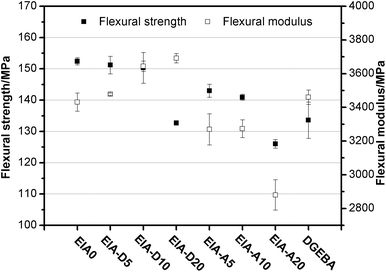 |
| | Fig. 14 Flexural strength and modulus of the cured epoxy resins. | |
3.5 Adhesive properties
Epoxy resins are widely used as adhesives because of their outstanding properties. Thus, it was necessary for us to investigate the adhesive properties of the synthesized epoxy system in order to demonstrate its application in an example here. Based on Fig. 9, the EIA systems show a similar viscosity to that of the DGEBA system below 80 °C, which indicated that they might have the same coating process. Therefore, as a utility demonstration, only the adhesion strength of the epoxy systems to steel was studied in this work. As shown in Fig. 15, the adhesion strength of EIA0 to steel was about 12.7 MPa, which was close to that of DGEBA. After the introduction of AESO, its adhesion strength to steel was remained stable, while it decreased gradually with the increase of DVB content in the system. Okamatsu51et al. reported that the adhesion strength of epoxy systems was related to the brittleness. The higher the brittleness of the epoxy system was, the lower the adhesion strength was. Thus, the above result might be due to the fact that DVB increased the brittleness of the cured epoxy network, resulting in the decrease of the adhesion strength. Anyway, the synthesized epoxy system showed the ability to perform as an adhesive comparable with DGEBA.
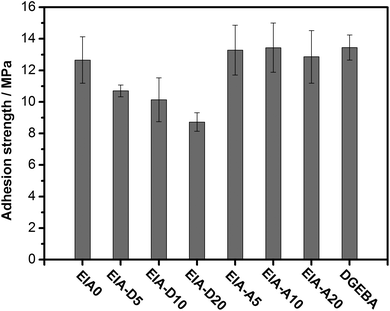 |
| | Fig. 15 Adhesion testing results of the epoxy systems to steel. | |
4. Conclusions
Itaconic acid was an excellent alternative feedstock to prepare bio-based epoxy with outstanding properties. Compared with the diglycidyl ether of bisphenol A, EIA had a higher epoxy value of 0.625 as well as comparable or better mechanical, thermal and adhesive properties. After being copolymerized with comonomers, its properties could be manipulated further. Based on our results, EIA has already shown great potential to partially replace the petroleum-based thermosetting resin in some field, such as DGEBA.
Acknowledgements
The authors greatly thank the financial support from the Project 51203176 supported by NSFC, Project 51003116 supported by NSFC, National Basic Research Program of China (973 Program, Grant no. 2010CB631100) and the careful checking of the language of this article by S. Saqib Shams.
Notes and references
- F. W. Xie, P. J. Halley and L. Averous, Prog. Polym. Sci., 2012, 37, 595–623 CrossRef CAS.
- A. Sionkowska, Prog. Polym. Sci., 2011, 36, 1254–1276 CrossRef CAS.
- G. Q. Chen and M. K. Patel, Chem. Rev., 2012, 112, 2082–2099 CrossRef CAS.
- G. F. Fernando and B. Degamber, Int. Mater. Rev., 2006, 51, 65–106 CrossRef CAS.
- J. M. Raquez, M. Deléglise, M. F. Lacrampe and P. Krawczak, Prog. Polym. Sci., 2010, 35, 487–509 CrossRef CAS.
-
A. Gandini, in Epoxy Polymers: New Materials and Innovations, ed. J.-P. Pascault and R. J. Wilson, Wiley-VCH, Weinheim, 2010, pp. 55–78 Search PubMed.
-
J.-P. Pascault, R. Höfer and P. Fuertes, in Polymer Science: A Comprehensive Reference, ed. M. Möller and K. Matyjaszewski, Elsevier, Amsterdam, Oxford, Waltham, 1st edn, 2012, vol. 10, pp. 59–82 Search PubMed.
- C. B. Bucknall and A. H. Gilbert, Polymer, 1989, 30, 213–217 CrossRef CAS.
- M. C. Lee, T. H. Ho and C. S. Wang, J. Appl. Polym. Sci., 1996, 62, 217–225 CrossRef CAS.
- S. T. Lin and S. K. Huang, Eur. Polym. J., 1997, 33, 365–373 CrossRef CAS.
-
T. W. Abraham and R. Höfer, in Polymer Science: A Comprehensive Reference, ed. M. Möller and K. Matyjaszewski, Elsevier, Amsterdam, Oxford, Waltham, 1st edn, 2012, vol. 10, pp. 15–58 Search PubMed.
- J. J. Bozell and G. R. Petersen, Green Chem., 2010, 12, 539–554 RSC.
- S. Flint, T. Markle, S. Thompson and E. Wallace, J. Environ. Manage., 2012, 104, 19–34 CrossRef CAS.
- H. Miyagawa, A. K. Mohanty, M. Misra and L. T. Drzal, Macromol. Mater. Eng., 2004, 289, 629–635 CrossRef CAS.
- H. Miyagawa, M. Misra, L. T. Drzal and A. K. Mohanty, Polym. Eng. Sci., 2005, 45, 487–495 CAS.
- S. J. Park and F. L. Jin, Polym. Int., 2005, 54, 705–709 CrossRef CAS.
- S. J. Park, F. L. Jin and C. J. Lee, Mater. Sci. Eng., A, 2005, 402, 335–340 CrossRef.
- M. Stemmelen, F. Pessel, V. Lapinte, S. Caillol, J. P. Habas and J. J. Robin, J. Polym. Sci., Part A: Polym. Chem., 2011, 49, 2434–2444 CrossRef CAS.
- M. Chrysanthos, J. Galy and J.-P. Pascault, Polymer, 2011, 52, 3611–3620 CrossRef CAS.
- M. Shibata and K. Nakai, J. Polym. Sci., Part B: Polym. Phys., 2010, 48, 425–433 CrossRef CAS.
- Y. Takada, K. Shinbo, Y. Someya and M. Shibata, J. Appl. Polym. Sci., 2009, 113, 479–484 CrossRef CAS.
- K. Hofmann and W. Glasser, Macromol. Chem. Phys., 1994, 195, 65–80 CrossRef CAS.
- K. Hofmann and W. G. Glasser, J. Adhes., 1993, 40, 229–241 CrossRef CAS.
- N. E. El Mansouri, Q. L. Yuan and F. R. Huang, BioResources, 2011, 6, 2492–2503 CAS.
- N. E. El Mansouri, Q. L. Yuan and F. R. Huang, BioResources, 2011, 6, 2647–2662 CAS.
- T. Koike, Polym. Eng. Sci., 2012, 52, 701–717 CAS.
- X. Q. Liu and J. W. Zhang, Polym. Int., 2010, 59, 607–609 CrossRef CAS.
- X. Q. Liu, W. Huang, Y. H. Jiang, J. Zhu and C. Z. Zhang, eXPRESS Polym. Lett., 2012, 6, 293–298 CrossRef CAS.
- L. L. Deng, M. M. Shen, J. Yu, K. Wu and C. Y. Ha, Ind. Eng. Chem. Res., 2012, 51, 8178–8184 CrossRef CAS.
-
G. J. G. Ruijter, C. P. Kubicek and J. Visser, in The Mycota: A Comprehensive Treatise on Fungi as Experimental Systems for Basic and Applied Research, ed. K. Esser, J. W. Bennett and H. D. Osiewacz, Springer, Berlin, Hamburg, 2002, vol. X, pp. 213–230 Search PubMed.
-
T. Werpy and G. Petersen, Top Value Added Chemicals from Biomass. Volume I—Results of Screening for Potential Candidates from Sugars and Synthesis Gas, N. R. E. Laboratory Report DOE/GO-102004–1992, U.S. Department of Energy, 2004 Search PubMed.
- J. S. Vesaratchanon, K. Takamura and N. Willenbacher, J. Colloid Interface Sci., 2010, 345, 214–221 CrossRef CAS.
- T. Willke and K. D. Vorlop, Appl. Microbiol. Biotechnol., 2004, 66, 131–142 CrossRef CAS.
-
C. L. Zhao, J. Roser, R. Dersch and R. Baumstark, U.S. Pat. 6790272, 1999 (BASF).
-
J. I. Westerman, J. B. Laurich, M. Flickinger and D. Oblak, U.S. Pat. 7629410, 2006 (Omnova).
- C. Zhang, J. Y. Huang, S. M. Liu and J. Q. Zhao, Polym. Adv. Technol., 2011, 22, 1768–1777 CrossRef CAS.
- J. J. Laverty, J. Polym. Sci., Polym. Lett. Ed., 1973, 11, 327–332 CrossRef CAS.
- X. Q. Liu, W. B. Xin and J. W. Zhang, Green Chem., 2009, 11, 1018–1025 RSC.
- Z. Q. Tao, S. Y. Yang, J. S. Chen and L. Fan, Eur. Polym. J., 2007, 43, 1470–1479 CrossRef CAS.
- S. Q. Ma, W. Q. Liu, Y. Zhao, Z. L. Yan and N. Gao, J. Macromol. Sci., Part A: Pure Appl. Chem., 2012, 49, 81–84 CAS.
- H. E. Kissinger, J. Res. Natl. Bur. Stand., 1956, 57, 217–221 CrossRef CAS.
- T. Ozawa, J. Therm. Anal., 1976, 9, 369–373 CrossRef CAS.
- A. Zlatanic, B. Dunjic and J. Djonlagic, Macromol. Chem. Phys., 1999, 200, 2048–2058 CrossRef CAS.
- P. Canamero-Martinez, M. Fernandez-Garcia and J. L. de la Fuente, React. Funct. Polym., 2010, 70, 761–766 CrossRef CAS.
- L. W. Hill, Prog. Org. Coat., 1997, 31, 235–243 CrossRef CAS.
- X. Pan and D. C. Webster, Macromol. Rapid Commun., 2011, 32, 1324–1330 CrossRef CAS.
- S. Bhuyan, S. Sundararajan, D. Andjelkovic and R. Larock, Tribol. Int., 2010, 43, 2231–2239 CrossRef CAS.
- A. Sarwono, Z. Man and M. A. Bustam, J. Polym. Environ., 2012, 20, 540–549 CrossRef CAS.
- E. Khosravi and O. M. Musa, Eur. Polym. J., 2011, 47, 465–473 CrossRef CAS.
- H. Y. Li, L. J. Wang, K. Jacob and C. P. Wong, J. Polym. Sci., Part A: Polym. Chem., 2002, 40, 1796–1807 CrossRef CAS.
- T. Okamatsu and M. Ochi, Polymer, 2002, 43, 721–730 CrossRef CAS.
|
| This journal is © The Royal Society of Chemistry 2013 |
Click here to see how this site uses Cookies. View our privacy policy here. ![[thin space (1/6-em)]](https://www.rsc.org/images/entities/char_2009.gif) 000–80
000–80![[thin space (1/6-em)]](https://www.rsc.org/images/entities/char_2009.gif) 000 tons reported in 2002.30 Now, the annual global production is estimated at more than 150
000 tons reported in 2002.30 Now, the annual global production is estimated at more than 150![[thin space (1/6-em)]](https://www.rsc.org/images/entities/char_2009.gif) 000 tons. Because of its great potential to replace the petrochemicals in the chemical industry, it has been selected as one of the top 12 potential bio-based platform chemicals by U.S. Department of Energy.31 Up to now, it has been proved to be an excellent comonomer32,33 and widely used as the primary sources for emulsion paints34 and paper coating latexes.35 It has been also functionalized by phosphorus and silicon to improve the properties of some polyesters.36,37 To the best of our knowledge, a bio-based epoxy derived from itaconic acid has never been reported.
000 tons. Because of its great potential to replace the petrochemicals in the chemical industry, it has been selected as one of the top 12 potential bio-based platform chemicals by U.S. Department of Energy.31 Up to now, it has been proved to be an excellent comonomer32,33 and widely used as the primary sources for emulsion paints34 and paper coating latexes.35 It has been also functionalized by phosphorus and silicon to improve the properties of some polyesters.36,37 To the best of our knowledge, a bio-based epoxy derived from itaconic acid has never been reported.

![[thin space (1/6-em)]](https://www.rsc.org/images/entities/char_2009.gif) a/kJ mol−1
a/kJ mol−1
![[double bond, length as m-dash]](https://www.rsc.org/images/entities/char_e001.gif) O) and the peak at 908 cm−1 indicated the presence of oxirane rings. Based on these data, the chemical structure of EIA was preliminarily determined. In order to further identify its structure, the 1H-NMR spectrum is also shown in Fig. 5. The peaks at 2.6, 2.8 and 3.2 ppm represent the protons H1, H2 and H3 in the ethylene oxide ring. The multiple peaks at 5.8 and 6.4 ppm were attributed to the unsaturated protons H7 and H8 attached to the double bond. Other peaks at 4.5, 4.0 and 3.4 ppm were also identified accordingly. These results adequately indicated the occurrence of the esterification between IA and ECH.
O) and the peak at 908 cm−1 indicated the presence of oxirane rings. Based on these data, the chemical structure of EIA was preliminarily determined. In order to further identify its structure, the 1H-NMR spectrum is also shown in Fig. 5. The peaks at 2.6, 2.8 and 3.2 ppm represent the protons H1, H2 and H3 in the ethylene oxide ring. The multiple peaks at 5.8 and 6.4 ppm were attributed to the unsaturated protons H7 and H8 attached to the double bond. Other peaks at 4.5, 4.0 and 3.4 ppm were also identified accordingly. These results adequately indicated the occurrence of the esterification between IA and ECH.
