 Open Access Article
Creative Commons Attribution 3.0 Unported Licence
Identification of polymer types and additives in marine microplastic particles using pyrolysis-GC/MS and scanning electron microscopy†
Elke Fries‡*a, Jens H. Dekiffab, Jana Willmeyera, Marie-Theres Nuelleab, Martin Ebertc and Dominique Remyb
aInstitute of Environmental Systems Research, University of Osnabrueck, Barbarastraße 12, D-49076 Osnabrueck, Germany. E-mail: e.fries@brgm.fr; Tel: +33 2 38 64 3668
bDepartment of Biology/Chemistry, Division of Ecology, University of Osnabrueck, Barbarastraße 13, D-49076 Osnabrueck, Germany
cEnvironmental Mineralogy, Institute for Applied Geosciences, Technical University of Darmstadt, Schnittspahnstr. 9, D-64287 Darmstadt, Germany
First published on 8th August 2013
Abstract
Any assessment of plastic contamination in the marine environment requires knowledge of the polymer type and the additive content of microplastics. Sequential pyrolysis-gas chromatography coupled to mass spectrometry (Pyr-GC/MS) was applied to simultaneously identify polymer types of microplastic particles and associated organic plastic additives (OPAs). In addition, a scanning electron microscope equipped with an energy-dispersive X-ray microanalyser was used to identify the inorganic plastic additives (IPAs) contained in these particles. A total of ten particles, which were optically identified as potentially being plastics, were extracted from two sediment samples collected from Norderney, a North Sea island, by density separation in sodium chloride. The weights of these blue, white and transparent fragments varied between 10 and 350 μg. Polymer types were identified by comparing the resulting pyrograms with those obtained from the pyrolysis of selected standard polymers. The particles consisted of polyethylene (PE), polypropylene, polystyrene, polyamide, chlorinated PE and chlorosulfonated PE. The polymers contained diethylhexyl phthalate, dibutyl phthalate, diethyl phthalate, diisobutyl phthalate, dimethyl phthalate, benzaldehyde and 2,4-di-tert-butylphenol. Sequential Py-GC/MS was found to be an appropriate tool for identifying marine microplastics for polymer types and OPAs. The IPAs identified were titanium dioxide nanoparticles (TiO2-NPs), barium, sulphur and zinc. When polymer–TiO2 composites are degraded in the marine environment, TiO2-NPs are probably released. Thus, marine microplastics may act as a TiO2-NP source, which has not yet been considered.
Environmental impactAn assessment of the chemical status of the marine environment requires knowledge on both the polymer type and the additive content of the microplastics. Sequential Pyr-GC/MS turned out to be an appropriate tool for the identification of marine microplastics for polymer types and organic plastic additives. The occurrence of microplastics in sediments in the Wadden Sea National Park of Lower Saxony with its sensitive habitats has been shown for the first time. The particles consisted of polyethylene (PE), polypropylene, polystyrene, polyamide, chlorinated PE and chlorosulfonated PE. The particles contained diethylhexyl phthalate, dibutyl phthalate, diethyl phthalate, diisobutyl phthalate, dimethyl phthalate, benzaldehyde, and 2,4-di-tert-butylphenol. In addition titanium dioxide nanoparticles, barium, sulphur, and zinc were identified using a scanning electron microscope equipped with an energy dispersive X-ray microanalyser. |
1 Introduction
Over the last 30 years, plastic pollution in the aquatic environment has become a major concern, especially in marine ecosystems.1,2 It was estimated that the proportion of plastic among total global marine debris ranges from 60 to 80%,3 reaching 90 to 95% in some areas.4 Today, plastics are one of the most common and persistent pollutants in ocean waters and beaches worldwide.5 The omnipresence of plastic debris in the German Bight has already been reported.6–8 In the study by Thiel et al.,7 anthropogenic debris was one of the three major flotsam categories (32.4 items per km2); more than 70% of the floating debris was made up of plastic items.Plastic debris steadily fragments into smaller pieces, forming microscopic particles of less than 5 mm, which are referred to accordingly as microplastics.9 Due to their potential to accumulate marine debris, beach sediments are suitable for monitoring microplastics.8,10–15 Many islands, which act as sinks for ocean-borne plastics, have already been heavily impacted by plastic debris originating far from their shores.4 For example, the abundance of microplastic at eighteen shores across six continents ranged from 2 (Australia) to 31 (Portugal, UK) fibres per 250 mL sediment.16 Microplastics may be ingested by small organisms at the base of the food web, such as amphipods, polychaete worms, barnacles and sea cucumbers.1
Polymers often contain plastic additives (PAs) to modify the colour (pigments and dyestuffs), to improve or modify mechanical properties (fillers and reinforcements), to provide resistance to heat and aging (antioxidants and stabilisers), to provide resistance to light degradation (UV stabilizers), to improve flame resistance (flame retardants) and processing characteristics (recycling additive) and to improve the performance (anti-static/conductive additives, plasticisers, blowing agents, lubricants, mould release agents, surfactants, preservatives) of the polymer.17 In addition to mechanical effects, microplastics may have toxic or endocrine effects due to the presence of PAs.18,19
With the aim of protecting the marine environment, the Marine Strategy Framework Directive (MSFD) was enacted.20 According to criteria and methodological standards on the good environmental status of marine waters,21 the “composition of micro-particles (in particular microplastics) has to be characterized in marine litter in the marine and coastal environment”. A critical step following extraction is to identify plastics, especially particles <1 mm in size.9 Fourier transform infrared spectroscopy (FTIR) (for a review, see Hidalgo-Ruz et al.14) and Raman microspectroscopy15 have been applied to determine the polymer composition of particles extracted from sediments. Pyrolysis gas chromatography (Pyr-GC) is a common technique used in polymer science to analyse the chemical composition of polymers.22 Organic PAs (OPAs) in polymers were analysed using supercritical fluid extraction23 and Soxhlet extraction as extraction techniques.24 Thermo-analytical techniques were used to analyse additives contained in polymers that cannot be dissolved, extracted or hydrolysed easily.25 Recently, a sequential Pyr-GC/MS method was published that enables the polymer type and OPAs to be investigated in one run by analysing identical samples under different pyrolysis conditions.26 To our knowledge Pyr-GC has never been applied to analyse microplastic particles in the environment.
The aim of the present study was to identify polymer types and associated OPAs of marine microplastic particles and associated inorganic additives in one run. After extracting microplastics from sediment samples, a sequential Pyr-GC/MS method was applied to provide a first test for analysing polymer types of microplastics found in marine sediments and the OPAs contained in them in one run. In addition, microplastic particles were analysed using a scanning electron microscope (SEM) to identify their content of IPAs.
2 Materials and methods
2.1 Study area and sampling
The study area containing the sampling sites is shown in Fig. 1. The island of Norderney, one of the German East Frisian Islands, is a typical representative of a barrier island located in front of the German North Sea coastline. It is approximately 14 km long and 2.5 km wide, with a total area of around 26 km2. Norderney is heavily influenced by tidal streams and periodic storm surges in spring and autumn, producing a high degree of sediment mobilisation. The northern side is characterised by beaches with a width of more than 200 m, followed by a belt of large secondary dunes and further dune belts of different succession stadiums with dune valleys in between. The eastern part is sparsely inhabited, and is part of Lower Saxony's Wadden Sea National Park. Urban areas on Norderney are restricted to the far west of the island, kilometres away from the sampling sites. On 6 April 2010, two sediment samples weighing 4 and 1.9 kg were taken from two sampling areas on the north-east of the island. Accumulations of macroplastics clearly showing that floating plastic litter has been deposited by the water flow were visible at these sites. The two sampling sites, shown in Fig. 1, were randomly chosen from these areas. The first sampling point N1 was located at the base of a secondary dune (N53°43.187′ E007°15.946′); the second sampling point N2 was situated in a dune valley 2 km to the east (N53°43.106′ E007°17.768′). Sediment samples were collected straight from the surface to a depth of 2 cm using a metal spoon, and placed in PET drinking water bottles. The metal spoon was cleaned with lint-free paper after taking each sample.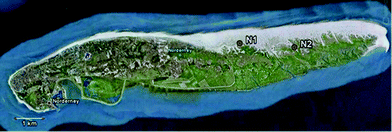 | ||
| Fig. 1 Map of the island Norderney showing the two sampling sites N1 and N2 (source: Google Earth). | ||
2.2 Extraction procedure
In order to avoid background contamination during the analysis, the following preventive measures were taken during the extraction procedure: all materials and vessels were covered with aluminium foil after each single step; all materials and vessels used for the first time for one sample were cleaned, usually in a dish washer when possible, or otherwise washed thoroughly by hand, and covered with aluminium foil straight after washing. Lab coats were worn during the analysis; the workplace for stereomicroscopic analysis was cleaned before opening and analysing the Petri dishes containing the target sample. Each sediment sample was divided into aliquots of 175 g. A density separation was applied using sodium chloride (NaCl), as suggested by Thompson et al. (2004), to separate lower dense particles from sediments. A saturated NaCl solution with a density of 1.2 g cm−3 (ref. 27) was prepared using common food-grade table salt (Suedsalz GmbH, Heilbronn, Germany). The table salt contained small amounts of sodium ferrocyanide as an anticaking agent. A 2L glass separatory funnel was filled with 600 mL NaCl solution via the upper opening. The sediment sample was carefully poured into the plugged separatory funnel. The funnel was panned and tipped (up to an angle of 90°) making sure that the sediment came into contact with the solution, and then shaken manually to overcome surface tension. After 1 h of settling, the sediment and the lower half of the solution was drained off. In the second step, 300 mL NaCl solution was poured into the funnel by rinsing the interior wall. Again, after 1 h of settling, the sediment and the lower half of the solution were drained off. This procedure was repeated using 100 mL NaCl solution. Finally, the funnel was rinsed with 1 L ultrapure water, and the content of the funnel containing all less dense particles was filtered using a vacuum filtration unit (Sartorius AG, Goettingen, Germany) with a 0.45 μm nitrocellulose filter (Mili, China). The filter was dried at room temperature and sealed in a Petri dish.2.3 Recovery and background contamination studies
In order to assure quality, recovery experiments were performed using black PE pellets (Black 190900-S, AMPACET Europe S.A., Windhof, Luxembourg) with a density of 1.15 g cm−3. The pellets were grated using a metal file to obtain rasps with an approximate length, height and width of 1, 0.2 and 0.2 mm, respectively. Eight recovery experiments were performed in which 10 rasps were added each time to 175 g sediment collected from sampling location N1. The mixture of sediment/plastic rasps was processed as described in section 2.2; rasps on the filters were identified using a stereomicroscope at 6.5-fold magnification and counted.Fibres were collected from the laboratory window ledge that had not been cleaned for around two weeks by taking off-prints using a tape to study depositions from the laboratory air as a potential source of background contamination. Moreover, fibres from jeans cotton (jeans are usually worn in our laboratory) were optically analysed for comparison with fibres found in the sediment samples.
2.4 Optical analysis
Nitrocellulose filters were analysed optically under a stereomicroscope Wild M3Z (Leica Microsystems, Wetzlar, Germany), providing 6.5-fold up to 40-fold magnifications. The stereomicroscope was equipped with a digital camera via a phototube. Particles that were optically identified as potentially being plastics were separated using tweezers. Decisions were taken based on features such as shininess, bright or specific unnatural colours, unnatural forms and structures, and a specific elastic consistency of particles or hardness determined by applying tweezers.2.5 SEM analysis
Microplastics were transferred onto a conductive and adhesive carbon tape mounted on an aluminium SEM sample holder. Chemical and morphological characterisation of the particles was performed using a scanning electron microscope (SEM) (Quanta 200FEG, FEI) equipped with an energy-dispersive X-ray microanalyser (EDAX Genesis). By working in the “low vacuum” mode at 1.2 mbar, any electrical charging effects of the sample were avoided, without requiring any further sample preparation (coating). EDX analysis in the “low vacuum” mode was performed at a working distance of 10 mm, with a high voltage of 15–25 kV and a spot size of 5.2.6 Pyr-GC/MS analysis
Pyr-GC in combination with mass spectrometry (MS) is used to obtain structural information about macromolecules by analysing their thermal degradation products. Sequential pyrolysis is performed by analysing identical samples under different conditions, for example by increasing the pyrolysis temperature. Such a sequential procedure can be an adequate tool for extracting OPAs at lower temperatures before determining the pyrolysis products of polymers in one run. Sequential pyrolysis of particles optically identified as potentially being plastics extracted from the sediments was performed using the Multipurpose Sampler 2XL equipped with a thermal desorption system (TDS 3) (Gerstel, Muelheim, Germany). In addition, 10 different types of the most common standard polymers were analysed to create a database of pyrograms. Details of the analysed polymers are given in Table 1. A particle was placed in a thermal desorption tube, which was pre-conditioned at 40 °C for 60 min in order to remove any sorbed contaminants. The particle was then thermally desorbed at a maximum temperature of 350 °C. The cold injection system's (CIS) initial temperature during desorption was −50 °C in order to trap compounds at this stage. The CIS was cooled down using liquid nitrogen. The thermal desorption (TD) mode was split less and the temperature programme for TD was from 40 to 350 °C, held for 10 min, at 10 °C min−1. The temperature of the transfer line was 350 °C. When TD was completed, the CIS was heated to 280 °C at a heating rate of 12 °C min−1 and maintained at 280 °C for 3 min. Once the first chromatogram resulting from TD had been registered, the same particle was pyrolysed at 700 °C for 60 s. Prior to pyrolysis, the TD temperature was set to 60 °C, held for 1 min, and heated up to 350 °C at 180 °C min−1.| Polymer name | Polymer type | Supplier |
|---|---|---|
| Study aim: compare different LDPE product lines | ||
| LDPE 1840D | LDPE (pellet) | LyondellBasell Industries AF S.C.A., Rotterdam, The Netherlands |
| LDPE 2420F | LDPE (pellet) | LyondellBasell Industries AF S.C.A., Rotterdam, The Netherlands |
| LDPE 2426F | LDPE (pellet) | LyondellBasell Industries AF S.C.A., Rotterdam, The Netherlands |
| Study aim: determine the influence of carbon black on pyrolysis of LPDE (pellet) | ||
| Plasblak PE 1873 | LDPE (pellet) containing ‘srf’ type carbon black (40% w/w) | Cabot Plastics, Leuven, Belgium |
| Study aim: determine the influence of branching degree on pyrolysis | ||
| HDPE ACP 9255plus | HDPE (pellet) | LyondellBasell Industries AF S.C.A. Rotterdam, The Netherlands |
| LLDPE 2049E | LLDPE (pellet) | Dow Plastics, Midland, USA |
| Study aim: obtain pyrograms | ||
| Not specified plastic raw material | PVC | KTK Kunststofftechnik GmbH, Germering, Germany |
| Not specified plastic raw material | PC | KTK Kunststofftechnik GmbH, Germering, Germany |
| Not specified plastic raw material | PUR | KTK Kunststofftechnik GmbH, Germering, Germany |
| Not specified plastic raw material | PA6 | KTK Kunststofftechnik GmbH, Germering, Germany |
| Not specified plastic raw material | PA6 cast | KTK Kunststofftechnik GmbH, Germering, Germany |
| Not specified plastic raw material | ABS | KTK Kunststofftechnik GmbH, Germering, Germany |
| Not specified plastic raw material | PET | KTK Kunststofftechnik GmbH, Germering, Germany |
| LDPE 362 BW EVA | LDPE/EVA (pellets) with antiblocks and heat stabilisers | ExxonMobil Chemical, Houston, USA |
| PPHC 904 CF | PP (pellets) | Borealis AG, Vienna, Austria |
| PS 143E | PS (pellets) | BASF SE, Ludwigshafen, Germany |
| Plastic clog | EVA | Beco Beerman GmbH & Co. KG, Bad Salzuflen, Germany |
In order to separate and detect OPAs and pyrolysis products, the TDS was interfaced to a gas chromatograph (GC) 7890A coupled to a mass selective detector (MS) 5975C (both Agilent Technologies, Santa Clara, USA). A 30 m HP-5MS capillary column (Agilent Technologies, Santa Clara, USA) with an inner diameter of 250 μm and a film thickness of 0.25 μm was used for chromatographic separation. The GC oven was programmed from 40 to 180 °C at 15 °C min−1 and then to 300 °C at 5 °C min−1, held for 12 min. The sample introduction technique was a CIS (CIS 4, Gerstel, Muelheim, Germany) using a deactivated glass liner filled with glass beads (Gerstel, Muelheim, Germany). The CIS was used as a programmed temperature vaporiser (PTV) inlet in the solvent vent mode. The carrier gas was helium (purity 5.0) with a vent flow of 60 mL min−1. At 0.01 min after the CIS raised the temperature, the split vent was closed and reopened at 1 min with a purge flow of 60 mL min−1 to split vent. Mass spectra of OPAs and pyrolysis products were obtained running the MS in full scan mode with a mass range between 10 and 600 amu.
OPAs were first identified by consulting the NIST05 and Wiley mass spectra libraries. Final identification was carried out by comparing retention times and mass spectra to those obtained from authentic standards of the following OPAs (standards were purchased according to the initial identification results): diethyl phthalate (DEP), dibutyl phthalate (DBP), diisobutyl phthalate (DIBP), dimethyl phthalate (DMP), diethylhexyl phthalate (DEHP), 2,4-di-tert-butylphenol and benzaldehyde (supplied by Dr Ehrenstorfer GmbH, Augsburg, Germany). A piece of cotton wool (about 3 mm in diameter) pre-cleaned with hexane was spiked with 1 μL of a mixture standard solution (concentration of 10 mg L−1 of each compound in methanol, except for benzaldehyde where ethanol was used) and analysed by TD-GC/MS.
3 Results and discussion
3.1 Recoveries and background contamination
The results of recovery studies are presented in Table 2. The recoveries varied between 80 and 100%. Places leading to the loss of rasps were the interior wall of the separatory funnel and the lower fringe of the vacuum filtration unit's glass funnel, which was in direct contact with the filter and O-ring. Up to now, recovery rates for extracting microplastics from sediments have only rarely been reported. The recovery rates reported in Claessens et al.13 using the method of Thompson et al.1 with a number of minor modifications, ranged from 68.8 to 97.5%. Imhof et al.15 achieved a similar mean recovery rate of 95.5 ± 1.8% for 0.1 g microplastic particles from seven environmentally relevant plastic types (PA, PE, PVC, PC, HDPE, PET and PP) with a diameter <1 mm in 1 L sediments using a ZnCl2 solution.| R (%) | Sink |
|---|---|
| 90 | Unknown |
| 100 | — |
| 100 | — |
| 80 | Lower fringe of the glass funnel (filtration unit) |
| 90 | Interior wall of the separatory funnel |
| 100 | — |
| 90 | Lower fringe of the glass funnel (filtration unit) |
| 100 | — |
Microscopic images of jeans cotton fibres and fibres collected from the laboratory window ledge are shown in Fig. 2A and B, respectively. Our results clearly indicate the deposition of blue, red and transparent fibres from laboratory air onto laboratory surfaces (Fig. 2B), which could be a potential source of background contamination whilst extracting sediments. A comparison of the pyrogram obtained from the Pyr-GC/MS analysis of the blue jeans fibre and of selected fibres in the blank revealed no similarities in the pyrolysis pattern. Since such background contamination is difficult to avoid, preparing a procedural blank is highly recommended. A comparison of background contamination levels among laboratories is urgently recommended, as proposed by Hidalgo-Ruz et al.14 A recently published study by Browne et al.16 highlighted the presence of microplastic fibres from 18 shores of six continents. Studies by Thompson et al.,1 Noren,28 Noren29 and Liebezeit and Dubaish30 also document large amounts of fibrous microplastics. Interestingly, Noren29 found that most fibres were coloured blue, black and red, as was the case for fibres collected from the laboratory ledge in the present study (Fig. 2B). Microscopic photos by Noren29 revealed a similar appearance to fibres found in the present study. Based on our results, however, we urgently recommend taking into account the laboratory-specific background contamination of fibres when extracting microplastics from sediments. In order to quantify the amount of fibres in relation to the fibres found in blanks, sufficient procedural blanks have to be run to take into account their variability.
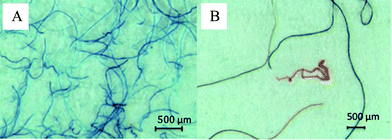 | ||
| Fig. 2 Microscopic images of jeans cotton fibres (A) and fibres collected from the laboratory window ledge (B). | ||
3.2 Occurrence of microplastic particles in sediments from Norderney
In addition to red, blue and transparent fibres, six and four particles were extracted from sediments collected from sampling point N1 and sampling point N2, respectively. Due to their similar visual nature to fibres deposited from air onto laboratory surfaces, fibres were not considered any further. The optical analysis of the 10 particles revealed that they are potentially plastics (#1–9 and #x, Fig. 3). The extracted objects included blue, white and transparent fragments with sharp or rounded edges. They weighed between 10 and 350 μg. Particles #1–8 were analysed using sequential Py-GC/MS (the blue particle #9 was not analysed using Py-GC/MS because it was optically very similar to particle #8; particle #x was not analysed because it got lost during transportation from the SEM lab to the lab where Py-GC/MS analysis was performed). The polymer types of these eight particles were identified by comparing the resulting pyrograms with those obtained from the analysis of selected standard polymers shown in Fig. S1–14.† In Fig. 4, the pyrogram of PE overlaid by the pyrogram obtained from the pyrolysis of particle #1 is shown for comparison. Particles were identified as PE (#1, #4), PP (#2, #5), PS (#3) and polyamide 6 (PA 6) (#8) (see Fig. 3). By comparing the pyrograms to those published in Tsuge et al. (2011), particles # 6 and #7 (Fig. 3) were identified as chlorinated PE and chlorosulfonated PE, respectively.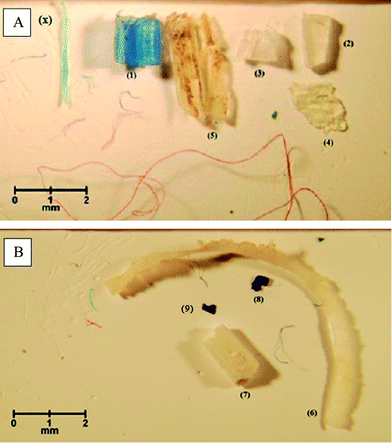 | ||
| Fig. 3 Microscopic images of potential microplastics extracted from sediments collected at sampling sites N1 (A) and N2 (B). | ||
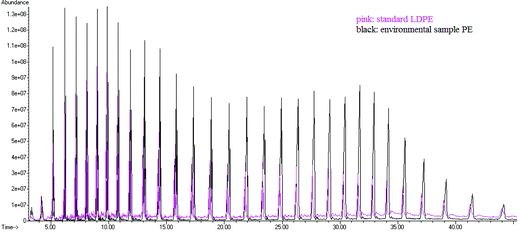 | ||
| Fig. 4 Pyrogram of PE (black) found in the environmental microplastic overlayed by the pyrogram of a PE standard (pink). | ||
The method was highly sensitive, enabling polymer types in microplastics with relatively low masses below 350 μg to be identified. Concerning the size limitations of plastic particles, the maximum size of plastic particles that can be analysed using the Py-GC/MS method is determined by the diameter of the thermal desorption tubes (1.5 mm). To overcome this size limitation, larger particles can be cut into smaller pieces before being analysed using Py-GC/MS. The minimum size of particles is defined by their visibility under the stereomicroscope and by the ability to be transferred to thermal desorption tubes by tweezers.
Our results demonstrate for the first time the presence of common microplastics in sediments from the nature reserve of Norderney. To the best of our knowledge, microplastics containing chlorinated and chlorosulfonated PE were identified for the first time in the marine environment. Liebezeit and Dubaish30 found granules and fibres in beach sediments collected from two East Frisian Islands in the North Sea with much higher concentrations of 38 particles per 10 g sediments and 496 particles per 10 g sediments, respectively. Even if we include fibres, the sediments collected from Norderney, which is also one of the East Frisian Islands, were much less polluted with microplastics than those collected by Liebezeit and Dubaish (2012) from other East Frisian Islands. This could be due to the different flow and deposition conditions at the various sampling areas and/or due to the different formation of corresponding erosion and accumulation zones. Claessens et al.13 reported average concentrations between 52.8 and 132.4 particles per kg dry sediment collected from 11 sampling stations in the Belgium coastal zone, where the majority were fibres (59% of the total number of particles). After subtracting fibres, concentrations are still higher than those obtained in the present study, which could be attributed to the fact that in Claessens et al.13 sediments were collected close to harbours, which could be potential sources of pollution.
3.3 Organic plastic additives
The OPAs, DEHP (#2, #4–8), DBP (#1, #3–5), DEP (#1, #3–8), DIBP (#1–6, #8), DMP (#3), benzaldehyde (#1, #3) and 2,4-di-tert-butylphenol (#1, #2, #5) (see Fig. 3 for numbering of plastic particles) were found in the microplastics. The OPAs were randomly distributed among the particles. Phthalates (DEHP, DBP, DEP, DIPB and DMP) are usually used as plasticisers. The risk of background contamination by phthalates from the PET drinking water sampling bottles is estimated to be low because these OPAs are mainly incorporated into PVC. 2,4-Di-tert-butylphenol is an antioxidant; benzaldehyde is used as a flavouring substance in food, cosmetics31 and plastics. For phthalates, several studies about effects on marine organisms have been published.32–35 Phthalates are known for their endocrine-disrupting effects as they can mimic, compete with or disrupt the synthesis of endogenous hormones.35 Phthalates are known to affect reproduction in invertebrates and fish; the development of crustaceans may also be impaired, and they can induce genetic aberrations.34 Due to these negative effects, the Environmental Quality Standard (EQS) for DEHP within the Water Framework Directive (WFD) was set at 1.3 μg L−1.36Applying sequential Py-GC/MS was found to be an effective, time-saving and cost-cutting method for analysing polymer types and OPAs in one run. However, further efforts are required to calibrate the Py-GC/MS method before it can be applied to monitor OPAs in marine microplastics. Previously, polymer types and OPAs (polybrominated diphenyl ethers (PBDEs), octylphenol, nonylphenol and bisphenol A) were determined in marine plastic debris in two separate stages using Soxhlet extraction for OPA prior to FTIR for identifying the polymer type.24,37 Since the distribution of OPAs in marine plastic particles is expected to be very heterogeneous, for monitoring issues each particle must be analysed. Py-GC/MS would therefore be more suitable than Soxhlet extraction since the Py-GC/MS method can be fully automated to analyse up to 100 samples, cutting labour costs. In the study by Hirai et al.,24 plastics ∼10 mm in size were used. Solvent-based extraction methods such as Soxhlet extraction are time-consuming and costly, involving a high solvent consumption, and also require a certain amount of polymers to reach detection limits. In addition, solvent usage in several analytical stages often implicates background contamination, especially for phthalates, because many materials in the laboratory are made of PVC. The use of the Py-GC/MS method led to no peaks occurring in the chromatogram after pre-conditioning the thermal desorption tube, indicating the absence of such compounds in laboratory air.
3.4 Inorganic plastic additives
Electron images of plastic fragments (#x, #8 and #9, see Fig. 3 for numbering) are shown in Fig. 5A and B, 6A and 7A. Resulting spectra of the SEM analysis (Fig. 5C, 6B and 7B) demonstrated the presence of aluminium (Al), titanium (Ti), barium (Ba), sulphur (S), oxygen (O) and zinc (Zn) (carbon, C, signal results from the polymer material). Al and Zn have been shown to be sorbed to marine plastic particles.38,39 In order to clarify whether metals are sorbed or whether they refer to additives, EOX spectra must also be analysed from the interior of the particles. Titanium dioxide nanoparticles (TiO2-NPs) were identified as small grains (100 to 250 nm in diameter) on the surface of particle x (Fig. 5A). TiO2-NPs are added to plastics during manufacture as white pigments or UV blockers,40 resulting in their high degradation efficiency in the natural environment. When polymer TiO2 composites are degraded in the environment, TiO2-NPs are probably released. Surprisingly, the role of plastics as a possible source of TiO2-NPs has not yet been discussed in the literature. Our findings suggest that microplastics could act as sources and vectors for associated TiO2-NPs. Data on biological effects revealed that TiO2-NPs may be toxic to bacteria, algae, invertebrates and fish.41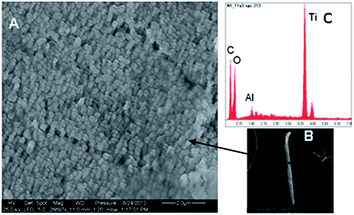 | ||
| Fig. 5 (A and B) SEM images of particle x (Fig. 3). (C) EDX spectra showing high titanium (Ti) content, not specified plastic carbon (C) and oxygen (O). | ||
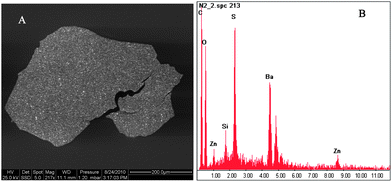 | ||
| Fig. 6 (A) SEM image of particle #8 (Fig. 3). (B) EDX spectra showing sulphur (S) as well as barium (Ba) and zinc (Zn) content, not specified plastic carbon (C) and oxygen (O). | ||
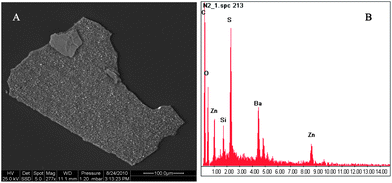 | ||
| Fig. 7 (A) SEM image of particle #9 (Fig. 3). (B) EDX spectra showing sulphur (S) as well as barium (Ba) and zinc (Zn) content, not specified plastic carbon (C) and oxygen (O). | ||
4 Conclusions
The occurrence of microplastics in sediments in Lower Saxony's Wadden Sea National Park, containing sensitive habitats that deserve particular protection, has been shown for the first time. Further studies are necessary to quantify and analyse the distribution patterns of microplastics contamination on Norderney and other islands along the North Sea coast.Compared to traditional solvent extraction techniques, sequential Py-GC/MS had the advantage of being able to analyse the polymer type and OPA content in one run without using any solvents and without any background contamination. The sequential Py-GC/MS method has an appropriate degree of sensitivity for analysing plasticisers, antioxidants and flavouring agents in microplastic particles with sample masses below 350 μg. This provides evidence of the chemical risk posed by marine plastic debris, since some of the OPAs identified have toxic and/or endocrine-disrupting properties. When implementing MSFD, the sequential Py-GC/MS method could be used to study the chemical composition of microplastics, which can be visually identified and handled using tweezers. In addition to OPAs, inorganic TiO2-NPs were identified for the first time in marine plastic debris, highlighting the potential of plastics to act as a source of the release of such NPs into the marine environment. However, further work is required to quantify this new source and to study the fate of NPs in the marine environment.
References
- R. C. Thompson, Y. Olsen, R. P. Mitchell, A. Davis, S. J. Rowland, A. W. G. John, D. McGonigle and A. E. John, Lost at sea: where is all the plastic?, Science, 2004, 304, 838 CrossRef CAS PubMed
.
- OSPAR, Marine litter in the North-East Atlantic Region: Assessment and priorities for response, London, 2009 Search PubMed
.
- M. R. Gregory and P. G. Ryan, Pelagic Plastics and Other Seaborne Persistent Synthetic Debris: a review of southern hemisphere perspectives, in Marine Debris–Sources, Impacts and Solutions, ed. J. M. Coe and D. B. Rogers, Springer Press, New York, 1997, pp. 49–66 Search PubMed
.
- C. J. Moore, Synthetic polymers in the marine environment: A rapidly increasing, long-term threat, Environ. Res., 2008, 108, 131–139 CrossRef CAS PubMed
.
- C. J. Moore, Trashed: across the Pacific Ocean, plastics, plastics everywhere, Nat. Hist., 2003, 112, 46–51 Search PubMed
.
- G. Liebezeit, Marine litter on the Kachelotplate, Lower Saxonian Wadden Sea, Senckenbergiana Marit., 2008, 38, 147–151 CrossRef
.
- M. Thiel, I. A. Hinojosa, T. Joschko and L. Gutow, Spatio-temporal distribution of floating objects in the German Bight (North Sea), J. Sea Res., 2011, 65, 368–379 CrossRef PubMed
.
- M.-T. Nuelle, J. H. Dekiff, D. Remy and E. Fries, A new analytical approach for monitoring microplastics in marine sediments, Environ. Pollut., 2013 DOI:10.1016/j.envpol.2013.07.027
.
- JRC, MSFD GES Technical Subgroup on Marine Litter. Marine Litter – Technical Recommendations for the Implementation of MSFD Requirements, Luxembourg, 2011 Search PubMed
.
- L. Thornton and N. L. Jackson, Spatial and temporal variations in debris accumulation and composition on an estuarine shoreline, Cliffwood Beach, New Jersey, USA, Mar. Pollut. Bull., 1998, 36, 705–711 CrossRef CAS
.
- M. S. Reddy, S. Basha, S. Adimurthy and G. Ramachandraiah, Description of the small plastics fragments in marine sediments along the Alang-Sosiya ship-breaking yard, India, Estuarine, Coastal Shelf Sci., 2006, 68, 656–660 CrossRef PubMed
.
- M. A. Browne, T. S. Galloway and R. C. Thompson, Spatial patterns of plastic debris along estuarine shorelines, Environ. Sci. Technol., 2010, 44, 3404–3409 CrossRef CAS PubMed
.
- M. Claessens, S. D. Meester, L. V. Landuyt, K. D. Clerck and C. R. Janssen, Occurrence and distribution of microplastics in marine sediments along the Belgian coast, Mar. Pollut. Bull., 2011, 62, 2199–2204 CrossRef CAS PubMed
.
- V. Hidalgo-Ruz, L. Gutow, R. C. Thompson and M. Thiel, Microplastics in the marine environment: a review of the methods used for identification and quantification, Environ. Sci. Technol., 2012, 46, 3060–3075 CrossRef CAS PubMed
.
- H. K. Imhof, J. Schmid, R. Niessner, N. P. Ivleva and C. Laforsch, A novel, highly efficient method for the separation and quantification of plastic particles in sediments of aquatic environments, Limnol. Oceanogr.: Methods, 2012, 10, 524–537 CAS
.
- M. A. Browne, P. Crump, S. J. Niven, E. Teuten, A. Tonkin, T. S. Galloway and R. C. Thompson, Accumulation of Microplastic on Shorelines Worldwide: Sources and Sinks, Environ. Sci. Technol., 2011, 45, 9175–9179 CrossRef CAS PubMed
.
- R. Gächter and H. Müller, Plastics Additives Handbook, Hansa, Munich, 4th edn, 1993 Search PubMed
.
- R. C. Thompson, C. J. Moore, F. S. Vom Saal and S. H. Swan, Plastics, the environment and human health: current consensus and future trends, Philos. Trans. R. Soc., B, 2009, 364, 2153–2166 CrossRef CAS PubMed
.
- A. L. Andrady, Microplastics in the marine environment, Mar. Pollut. Bull., 2011, 62, 1596–1605 CrossRef CAS PubMed
.
- European Parliament and the Council, Directive 2008/56/EC of 17 June 2008 establishing a framework for community action in the field of marine environmental policy (Marine Strategy Framework Directive), Official Journal of the European Union 51, 2008, L164, 19–40 Search PubMed
.
- European Commission, Commission Decision 2010/477/EU of 1 September 2010 on criteria and methodological standards on good environmental status of marine waters (notified under document C(2010) 5956), Official Journal of the European Union 53, 2010, L232, 14–24 Search PubMed
.
- S. Tsuge, H. Ohtani and C. Watanabe, Pyrolysis-GC/MS data book of synthetic polymers, Elsevier B.V., Oxford, UK, 2011 Search PubMed
.
- X. W. Lou, H. G. Janssen and C. A. Cramers, Investigation of Parameters Affecting the Supercritical Fluid Extraction of Polymer Additives from Polyethylene, J. Microcolumn Sep., 1995, 7, 303–317 CrossRef CAS
.
- H. Hirai, H. Takada, Y. Ogata, R. Yamashita, K. Mizukawa, M. Saha, C. Kwan, C. Moore, H. Gray, D. Laursen, E. R. Zettler, J. W. Farrington, C. M. Reddy, E. E. Peacock and M. W. Ward, Organic micropollutants in marine plastics debris from the open ocean and remote and urban beaches, Mar. Pollut. Bull., 2011, 62, 1683–1692 CrossRef CAS PubMed
.
- M. Herrera, G. Matuschek and A. Kettrup, Fast identification of polymer additives by pyrolysis-gas chromatography/mass spectrometry, J. Anal. Appl. Pyrolysis, 2003, 70, 35–42 CrossRef CAS
.
- E. Kleine-Benne and B. Rose, Versatile automated pyrolysis GC combining a filament type pyrolyzer with a thermal desorption unit. Gerstel Application Note 4/2011, Mülheim an der Ruhr, Germany, 2011, http://www.gerstel.de/pdf/p-gc-an-2011-04.pdf, accessed 17 April 2013 Search PubMed
.
- K. Schäfer and C. Synowietz, Chemiker Kalender, Springer, Berlin, Heidelberg, New York, Tokio (in German), 3rd edn, 1984 Search PubMed
.
- F. Noren, Small plastic particles in coastal Swedish waters, N-Research, KIMO, Sweden, 2007 Search PubMed
.
- F. Noren, Microscopic anthropogenic particles in Swedish waters many more than believed. HELCOM MONAS 12/2009, N-Research, Sweden, 2009 Search PubMed
.
- G. Liebezeit and F. Dubaish, Microplastics in Beaches of the East Frisian Islands Spiekeroog and Kachelotplate, Bull. Environ. Contam. Toxicol., 2012, 89, 213–217 CrossRef CAS PubMed
.
- R. J. Lewis Sr, Hawley's Condensed Chemical Dictionary, John Wiley & Sons, New York, 15th edn, 2007 Search PubMed
.
- N. Ghorpade, V. Mehta, M. Khare, P. Sinkar, S. Krishnan and C. Vaman Rao, Toxicity study of diethyl phthalate on freshwater fish Cirrhina mrigala, Ecotoxicol. Environ. Saf., 2002, 53, 255–258 CrossRef CAS
.
- H. Ohtani, I. Miura and Y. Ichikawa, Effects of dibutylphthalate as an environmental endocrine disrupter on gonadal sex differentiation of genetic males of the frog Rana rugosa, Environ. Health Perspect., 2000, 108, 1189–1193 CrossRef CAS
.
- J. Oehlmann, U. Schulte-Oehlmann, W. Kloas, O. Jagnytsch, I. Lutz, K. O. Kusk, L. Wollenberger, E. M. Santos, G. C. Paull, K. J. W. Van Look and C. R. Tyler, A critical analysis of the biological impacts of plasticizers on wildlife, Philos. Trans. R. Soc., B, 2009, 364, 2047–2062 CrossRef CAS PubMed
.
- C. E. Talsness, A. J. M. Andrade, S. N. Kuriyama, J. A. Taylor and F. S. vom Saal, Components of plastic: experimental studies in animals and relevance for human health, Philos. Trans. R. Soc., B, 2009, 364, 2079–2096 CrossRef CAS PubMed
.
- European Parliament and the Council, Directive 2008/105/EC of 24 December 2008 on environmental quality standards in the field of water policy, amending and subsequently repealing Council Directives 82/176/EEC, 83/513/EEC, 84/156/EEC, 84/491/EEC, 86/280/EEC and amending Directive 2000/60/EC of the European Parliament and of the Council, Official Journal of the European Union, 2008, L348, 84–91 Search PubMed
.
- Y. Mato, T. Isobe, H. Takada, H. Kanehiro, C. Ohtake and T. Kaminumas, Plastic resin pellets as a transport medium for toxic chemicals in the marine environment, Environ. Sci. Technol., 2001, 35, 318–324 CrossRef CAS
.
- L. Ashton and A. Holmes, Turner, association of metals with plastic production pellets in the marine environment, Mar. Pollut. Bull., 2010, 60, 2050–2055 CrossRef PubMed
.
- L. A. Holmes, A. Turner and R. C. Thompson, Adsorption of trace metals to plastic resin pellets in the marine environment, Environ. Pollut., 2011, 160, 42–48 CrossRef PubMed
.
- S. Cho and W. Choi, Solid-phase photocatalytic degradation of PVC–TiO2 polymer composites, J. Photochem. Photobiol., A, 2001, 143, 221–228 CrossRef CAS
.
- R. D. Handy, R. Owen and E. Valsami-Jones, The ecotoxicology of nanoparticles and nanomaterials: current status, knowledge gaps, challenges, and future needs, Ecotoxicology, 2008, 17, 315–325 CrossRef CAS PubMed
.
Footnotes |
| † Electronic supplementary information (ESI) available. See DOI: 10.1039/c3em00214d |
| ‡ Present address: Water, Environment and Eco-technologies Division, Bureau de Recherches Géologiques et Minières (BRGM), 3, Avenue Claude Guillemin – B.P. 36009, 45060 Orléans Cedex 02, France. |
| This journal is © The Royal Society of Chemistry 2013 |
