High-temperature surface enhanced Raman spectroscopy for in situ study of solid oxide fuel cell materials†
Xiaxi
Li
a,
Jung-Pil
Lee
ab,
Kevin S.
Blinn
a,
Dongchang
Chen
ac,
Seungmin
Yoo
b,
Bin
Kang
c,
Lawrence A.
Bottomley
c,
Mostafa A.
El-Sayed
c,
Soojin
Park
b and
Meilin
Liu
*a
aSchool of Materials Science and Engineering, Center for Innovative Fuel Cell and Battery Technologies, Georgia Institute of Technology, 771 Ferst Drive, Atlanta, Georgia 30332-0245, USA. E-mail: meilin.liu@mse.gatech.edu
bInterdisciplinary School of Green Energy, Ulsan National Institute of Science and Technology (UNIST), Ulsan 689-798, Republic of Korea
cSchool of Chemistry and Biochemistry, Georgia Institute of Technology, Atlanta, Georgia 30332-0400, USA
First published on 16th October 2013
Abstract
In situ probing of surface species and incipient phases is vital to unraveling the mechanisms of chemical and energy transformation processes. Here we report Ag nanoparticles coated with a thin-film SiO2 shell that demonstrate excellent thermal robustness and chemical stability for surface enhanced Raman spectroscopy (SERS) study of solid oxide fuel cell materials under in situ conditions (at ∼400 °C).
Broader contextMinor alteration of surface composition and structure often dramatically affects the activity and stability of solid oxide fuel cell (SOFC) electrodes. For example, surface modification by a trace amount of catalysts or electrocatalysts can significantly enhance the rate of electrode reactions whereas deposition of a minuscule amount of an inactive phase (e.g., coking) may quickly degrade electrode performance. Probing such surface species or incipient phases is critical to understanding the mechanism(s) of electrode processes. Unfortunately, conventional Raman spectroscopy lacks the sensitivity to many surface species. In this contribution, we employ surface enhanced Raman spectroscopy (SERS) to boost the sensitivity to surface species on SOFC electrodes. This was achieved using SiO2-coated Ag nanoparticles as the SERS probe for in situ characterization at high temperatures. The thin SiO2 coating prevented silver oxidation and agglomeration, offering robust thermal stability and chemical inertness while allowing the surface species within the enhancement field of the silver nanoparticles. This SERS probe should find utility in characterizing a wide variety of electrodes and catalysts at high temperatures, including hydrocarbon reforming promoters, three-way catalysts, and gas separation membranes, where a trace amount of surface species plays a crucial role in functionality. |
The surging demand for energy and the ever-increasing concerns regarding greenhouse gas emissions have stimulated intense interest in the development of solid oxide fuel cell (SOFC) technologies, which offer a promising alternative to power generation with high energy efficiency,1–3 excellent fuel flexibility,4–6 and easy capture of CO2 emission.7 To date, SOFC technology is too expensive for commercialization due largely to inadequate performance at low temperatures and insufficient robustness under realistic service conditions.8,9 Rational design of new electrode materials with high catalytic activity and resistance to contaminant poisoning depends critically on a fundamental understanding of the reaction mechanisms on electrode surfaces.10In situ characterization of electrode surfaces under operation conditions is imperative to acquiring information vital to unraveling reaction mechanism(s).
Raman spectroscopy has unique advantages for in situ characterization of SOFC materials. Through “fingerprinting” the vibration modes of the materials, Raman scattering can be used to identify the phase evolution on the electrode surfaces. Unlike electron-based surface analysis techniques such as X-ray photoelectron spectroscopy (XPS), Auger electron spectroscopy (AES) and energy-dispersive X-ray spectroscopy (EDS), Raman spectroscopy does not require vacuum, allowing in situ characterization of a functional electrode exposed to gases of interest at high temperatures.11,12 Raman spectroscopy has been utilized to study a wide variety of SOFC materials under in situ conditions, providing insight into electrochemical reactions on electrode surfaces such as sulfur poisoning of nickel-based anodes and adsorption of oxygen species on CeO2.13–17
The low signal intensity of Raman spectroscopy, however, makes it difficult to detect the surface species present in trace amounts or to track the formation of surface species with short lifetimes. This problem is more severe when studying SOFC materials under realistic operating conditions because many ceramic phases possess weak Raman modes and all Raman peaks broaden at high temperatures.
Surface enhanced Raman scattering (SERS) is a promising solution to this problem. The surface plasmons of the nanosized Au or Ag features resonate with the incident light, amplifying the Raman signal of the molecules in their vicinity.18–20 Our previous study demonstrated the utility of SERS for SOFC-related materials such as deposited carbon, CeO2, La1−xSrxMnO3−δ (LSM) and La1−xSrxCo1−yFeyO3−δ (LSCF) following deposition of Ag nanoparticles on the electrode.12
However, bare metal nanoparticles, the common SERS providers, tend to ripen and lose SERS activity at high tempertures.21 To make in situ SERS possible, robust nanofeatures of Au or Ag need to be created. Recently, the van Duyne group found that Ag nanofeatures with a thin layer of robust capping such as Al2O3 have stable shapes and optical properties at high temperatures.19,22 In the shell-isolated nanoparticle enhanced Raman spectroscopy (SHINERS) technique developed by Tian et al., the Ag and Au nanoparticles with a few nanometers of Al2O3 or SiO2 coating provide an enhancement of the Raman signal of the underlying materials without interfering with the original surface properties.23
In this work, we report the use of SiO2 shell isolated Ag nanoparticles (Ag@SiO2 NPs) for in situ SERS analysis of SOFC materials at high temperatures.
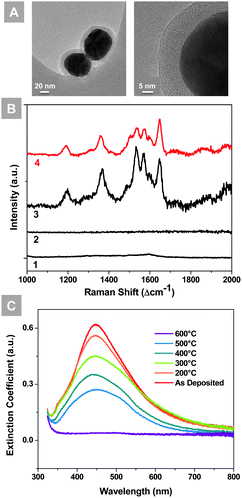
The diameters of the silver nanoparticles used in this study are ∼60 nm, while the thicknesses of SiO2 shells are ∼10 nm, as seen from the TEM images in Fig. 1(A). The SiO2 coating red-shifted the peak position of the localized surface plasmon resonance (LSPR) of the silver nanoparticles and reduced the extinction coefficient, as presented in the UV-vis extinction spectra (Fig. S1†). As the SiO2 shell provides thermal robustness at the cost of the SERS enhancement effect,18 a 10 nm thick SiO2 shell was chosen in this study to ensure adequate stability and a reasonable SERS enhancement.
The intrinsic enhancement factor of the Ag@SiO2 nanoparticles was evaluated using Rhodamine 6G (R6G) loaded on a silicon wafer as shown in Fig. 1(B). The silicon wafer loaded with 0.1 M R6G shows a typical R6G spectrum, while the one loaded with 1 × 10⁻³ M R6G has no observable spectral features. In contrast, the 1 × 10⁻³ M R6G solution mixed with the Ag@SiO2 nanoparticles generated significantly enhanced Raman signals. The enhancement factor is estimated to be 150, according to the calculation method provided in the ESI.†
The thermal and chemical stability of the microstructure and optical absorbance of the Ag@SiO2 nanoparticles are key to the application of high temperature SERS. The localized surface plasmon resonance (LSPR) extinction spectra of the Ag@SiO2 nanoparticles are shown in Fig. 1(C), before and after heat treatment at from 200 °C to 600 °C for 30 min in air. Despite the gradual decrease of intensity, the LSPR peaks of Ag@SiO2 nanoparticles remain around 450 nm from room temperature to 500 °C, and a considerable portion of the resonance remained after heat treatments. The thermally-robust LSPR property results from the stable microstructure of the Ag cores protected by SiO2 shells.22,24 As is evidenced by the SEM images presented in Fig. S2,† the Ag@SiO2 nanoparticles largely retained the original size and structural integrity, although slight shape variation was observed after annealing at 450 °C for 1 h in different gases: air, argon with 10% H2, and argon with 15% C3H8. In addition, the LSPR peak remained stable after the initial drop (Fig. S5†), providing an advantageous time window for the SERS analysis. Clearly, the Ag@SiO2 nanoparticles demonstrated better thermal robustness than the bare Ag nanoparticles. After annealing at 450 °C for 1 h, the bare Ag NPs (created by sputtering) lost all the LSPR resonance, as a result of catastrophic particle ripening (Fig. S6†). The highest temperature that the LSPR peak remains is 500 °C. As the targeted operation temperature of the low-temperature SOFCs is 400 to 600 °C,25–28 these Ag@SiO2 nanoparticles may provide SERS enhancement for the SOFC electrode materials under near operating conditions.
While bare silver is susceptible to coking and oxidation of fuels, potentially introducing artifacts to the SERS study of the electrode processes, the SiO2 shell isolated Ag nanoparticles are chemically inert and stable. Presented in Fig. S3† are some typical Raman spectra of Ag@SiO2 nanoparticles after annealing in air, argon with 10% H2, and argon with 15% C3H8. All samples showed clean backgrounds after the heat treatments, suggesting that the Ag@SiO2 nanoparticles are suited for SERS study of SOFC materials under in situ conditions.
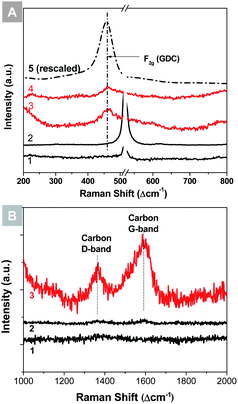
The thermally robust SERS capability of Ag@SiO2 nanoparticles was tested on both anode and cathode materials of SOFCs. Fig. 2(A) presents some typical SERS spectra of gadolinium doped ceria (GDC) thin films. The normal Raman spectrum taken from the GDC thin film on a silicon wafer showed a weak peak at 460 cm−1, corresponding to the F2g mode of doped ceria.29,30 After the Ag@SiO2 nanoparticles were applied to the surface, the F2g mode was enhanced by a factor of ∼15. For comparison, the Ag@SiO2 nanoparticles loaded on a blank silicon wafer were also inspected and showed no significant peaks in that region, indicating that the enhancement of F2g mode was due solely to the SERS effect of Ag@SiO2 nanoparticles. The GDC thin film loaded with Ag@SiO2 nanoparticles was then annealed in air at 400 °C for 30 min. The remaining enhancement of F2g mode amounts to ∼8 times. Fig. 2(B) presents the SERS study of carbon deposition on a nickel surface. A blank nickel foil, a Ag@SiO2 loaded nickel foil, and a Ag@SiO2 loaded silicon wafer control were exposed to a gas mixture containing 15% C3H8 and 85% of argon at 450 °C for 1 h. The Raman spectrum of the SERS-activated nickel foil showed a carbon signal that was ∼10 times higher than that of the blank nickel foil. Again, the Raman spectrum of the Ag@SiO2 loaded silicon wafer control did not show notable carbon peaks, implying that either the Ag@SiO2 NPs or the silicon wafer did not develop coking and the carbon signal shown in the Ag@SiO2–Ni sample must have come from the SERS of carbon deposition on nickel. The calculation of the enhancement factor is provided in the ESI.†
These results demonstrate the feasibility of using Ag@SiO2 NPs for SERS study of SOFC materials under in situ conditions. GDC is a typical electrolyte material of SOFCs, and is also widely used in both cathode and anode,31–33 while carbon deposition on nickel is a typical process that causes deactivation of Ni-based SOFC anodes. Ag@SiO2 NPs enhanced the Raman signals of these phases of low concentration. More importantly, the signal enhancement remained stable after high temperature treatments, making possible in situ SERS analysis.
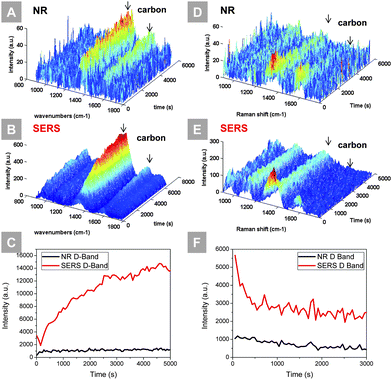
The process of carbon deposition was monitored in situ using Ag@SiO2 nanoparticles as the SERS providers to enhance the sensitivity. Carbon deposition is a major source of degradation of nickel-based anodes when exposed to carbon-containing fuels, which could result in loss of active sites and damage of microstructure. Monitoring the coking kinetics at early stage helps to understand the mechanism and thus guide the design of effective anode modifiers to resist such degradation. Fig. 3(A and B) show the time-resolved normal Raman and SERS study of a polished nickel surface exposed to wet propane at 450 °C, respectively. In both occasions, the carbon D-band and G-band increased over time, but the SERS activated sample showed a much higher intensity and signal-to-noise ratio. The signal strength of both the carbon D-band and G-band is enhanced significantly. In Fig. 3(C), the integrated area under the carbon D-band for both samples was plotted over time. The signal intensity from the SERS activated sample shows a better-resolved trend: carbon quickly deposited on the nickel surface initially and the deposition rate slowed down over time. The coked samples were then exposed to a gas mixture composed of 1% O2, 3% water vapor and 96% Ar. The time-resolved Raman and SERS spectra of this carbon removal experiment, along with the integration of the carbon D-band, are shown in Fig. 3(D–F), respectively. In both cases, carbon peaks decrease with the introduction of oxygen. As evident from the SERS data (of higher sensitivity), most of the deposited carbon was removed within 1000 s.
To validate that the sensitivity towards carbon deposition and removal is a result of SERS of Ag@SiO2 nanoparticles rather than the reaction of Ag@SiO2 with wet propane, a controlled group consisting of Ag@SiO2 NPs loaded on the GDC thin film was exposed to wet propane at 450 °C, as shown in Fig. S10.† Over the 5 h testing period, the enhanced F2g mode of the GDC thin film remained constant while a small amount of carbon was detected. In addition, to validate that SiO2 does not promote coking on the nickel surface, a controlled experiment was performed, as shown in Fig. S11.† When blank Ni, SiO2|Ni, and Ag@SiO2|Ni samples were exposed to wet propane at 450 °C, only the Ag@SiO2|Ni showed a prominent signal of carbon deposition, suggesting that SERS is the key factor for such sensitivity.
The ability of performing in situ SERS at high temperatures allows us to probe the kinetics of coking at its incipient stage. Previous Raman monitoring of carbon deposition was possible only when a large amount of carbon had been accumulated after a long time of coking. Under realistic SOFC operation conditions, coking affects the performance of the anode slowly and does not always leave a detectable Raman signal.34 Ag@SiO2 nanoparticles enhance the Raman cross-section, and the inspection of coking becomes possible at low temperatures and shorter durations. Furthermore, a higher signal intensity enables the use of shorter spectral collection times essential for time-resolved studies.
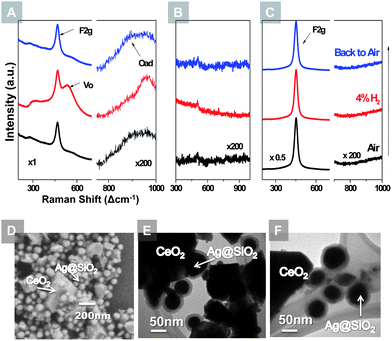
The in situ SERS technique was also applied to probe the oxygen species on CeO2 surfaces in both reducing and oxidizing atmospheres, as illustrated in Fig. 4. CeO2 powders were mixed with Ag@SiO2 nanoparticles and drop-coated onto a silicon substrate which was subsequently heated to 450 °C in a Raman chamber for in situ study. The 465 cm−1 peak is associated with the F2g mode of CeO2.29,30 On the SERS activated CeO2 powders (Fig. 4(A)), a peak at around 540 cm−1 appeared when exposed to argon with 4% H2, and disappeared when exposed to air. This peak can be associated with the oxygen vacancies on the CeO2 surface, which emerges under a reducing atmosphere and diminishes when exposed to an oxidizing gas.29,35 Another notable feature is the weak hump at 800–1000 cm−1 which appears only when the sample is exposed to air. The Raman shift of this hump is consistent with the oxygen absorbed on CeO2 and Au electrode surfaces.30,36 Control groups were tested with the same procedure, as displayed in Fig. 4(B and C). The pure Ag@SiO2 nanoparticles showed no prominent features during the redox cycling; on the blank CeO2 powders, only F2g mode is observable while no oxygen vacancy or adsorbed oxygen peak can be detected.
The core–shell microstructure of the Ag@SiO2 nanoparticles remained unchanged over the prolonged testing period. Shown in Fig. 4(D) is the SEM image of Ag@SiO2 NPs mixed with CeO2 powders after the red–ox testings at 450 °C. The Ag@SiO2 NPs retained the same particle size and geometry. TEM analysis of the Ag@SiO2 NPs after high temperature treatments in both air and argon with 4% H2 also confirmed the stability of the core–shell microstructure, as seen in Fig. 4(E and F).
Observation of the accumulation and depletion of oxygen vacancies on the CeO2 surface at high temperatures revealed the role of CeO2 in the SOFC electrodes. As a catalyst, CeO2 is often used as an electrode modifier to help resist carbon deposition on the nickel-based anode and promote oxygen reduction on the cathode.15,18 It is believed that CeO2 stores and releases oxygen under oxidizing and reducing conditions, respectively, leading to the unique catalytic activity. The cycling of the oxygen vacancy band in response to the change of gas atmosphere supports this mechanism. More importantly, this suggests that the surface species, which were undetectable previously under in situ conditions using ordinary Raman spectroscopy, can now be identified using SERS – a powerful tool for in situ study of materials for fuel cells and catalysis. Currently, we are applying this technique to SOFC materials under well-controlled chemical/electrochemical conditions in order to unravel the mechanisms of electrode processes vital to efficiency and stability of the materials under or near operating conditions.
Conclusions
In summary, we fabricated Ag@SiO2 nanoparticles to provide surface enhanced Raman scattering for the study of SOFC electrode materials under conditions approaching those found in operation. The SiO2 shell helps to maintain the structural stability of Ag cores at high temperatures. The in situ SERS of carbon deposition on and removal from the nickel surface demonstrated a sensitive method to study the kinetics of surface species evolution. The revealing of surface oxygen vacancies and adsorbed oxygen molecules on the CeO2 powders under reducing and oxidizing atmospheres provided a promising route to probe the reaction intermediates that influence the performance and stability of electrodes. The application of SERS techniques in probing SOFC electrode materials exposed to reacting gas mixtures at 400–450 °C represents an important step towards in situ or in operando SERS study of SOFC electrode surfaces. Furthermore, we are optimizing the geometry of Ag@SiO2 nanoparticles to improve the SERS stability and efficiency at even higher temperatures (e.g., 600 °C). Other coating materials such as TiO2 and ZrO2 (ref. 37–40) are also being explored for better thermal stability, although their chemical- and photo-catalytic properties under SOFC operating conditions and laser excitation need to be carefully evaluated before implementation.Acknowledgements
This work was supported by the HeteroFoaM Center, an Energy Frontier Research Center funded by the U.S. DOE, Office of Science, Office of Basic Energy Sciences (BES) under Award Number DE-SC0001061.Notes and references
- B. C. H. Steele and A. Heinzel, Nature, 2001, 414, 345–352 CrossRef CAS PubMed.
- S. M. Haile, Acta Mater., 2003, 51, 5981–6000 CrossRef CAS PubMed.
- A. Atkinson, S. Barnett, R. J. Gorte, J. T. S. Irvine, A. J. McEvoy, M. Mogensen, S. C. Singhal and J. Vohs, Nat. Mater., 2004, 3, 17 CrossRef CAS PubMed.
- L. Yang, Y. Choi, W. Qin, H. Chen, K. Blinn, M. Liu, P. Liu, J. Bai, T. A. Tyson and M. Liu, Nat. Commun., 2011, 2, 357 CrossRef PubMed.
- L. Yang, S. Z. Wang, K. Blinn, M. F. Liu, Z. Liu, Z. Cheng and M. L. Liu, Science, 2009, 326, 126–129 CrossRef CAS PubMed.
- M. Liu, Y. Choi, L. Yang, K. Blinn, W. Qin, P. Liu and M. Liu, Nano Energy, 2012, 1, 448–455 CrossRef CAS PubMed.
- J. W. Dijkstra and D. Jansen, Energy, 2004, 29, 1249–1257 CrossRef CAS PubMed.
- M. E. Lynch, L. Yang, W. Qin, J.-J. Choi, M. Liu, K. Blinn and M. Liu, Energy Environ. Sci., 2011, 4, 2249–2258 CAS.
- L. Yang, Z. Cheng, M. Liu and L. Wilson, Energy Environ. Sci., 2010, 3, 1804–1809 CAS.
- M. L. Liu, M. E. Lynch, K. Blinn, F. M. Alamgir and Y. Choi, Mater. Today, 2011, 14, 534–546 CrossRef CAS.
- Z.-Y. Pu, J.-Q. Lu, M.-F. Luo and Y.-L. Me, J. Phys. Chem. C, 2007, 111, 18695–18702 CAS.
- X. Li, K. Blinn, Y. Fang, M. Liu, M. A. Mahmoud, S. Cheng, L. A. Bottomley, M. El-Sayed and M. Liu, Phys. Chem. Chem. Phys., 2012, 14, 5919–5923 RSC.
- Z. Cheng, J.-H. Wang, Y. Choi, L. Yang, M. C. Lin and M. Liu, Energy Environ. Sci., 2011, 4, 4380–4409 CAS.
- Y. M. Choi, H. Abernathy, H.-T. Chen, M. C. Lin and M. Liu, ChemPhysChem, 2006, 7, 1957–1963 CrossRef CAS PubMed.
- K. S. Blinn, H. Abernathy, X. Li, M. Liu, L. A. Bottomley and M. Liu, Energy Environ. Sci., 2012, 5, 7913–7917 CAS.
- M. B. Pomfret, J. C. Owrutsky and R. A. Walker, J. Phys. Chem. B, 2006, 110, 17305–17308 CrossRef CAS PubMed.
- M. B. Pomfret, J. C. Owrutsky and R. A. Walker, Anal. Chem., 2007, 79, 2367–2372 CrossRef CAS PubMed.
- K. A. Willets and R. P. Van Duyne, in Annual Review of Analytical Chemistry, 2007, vol. 58, pp. 267–297 Search PubMed.
- P. L. Stiles, J. A. Dieringer, N. C. Shah and R. R. Van Duyne, in Annual Review of Analytical Chemistry, 2008, vol. 1, pp. 601–626 Search PubMed.
- Z. Q. Tian, B. Ren, J. F. Li and Z. L. Yang, Chem. Commun., 2007, 3514–3534 RSC.
- K. R. Beavers, N. E. Marotta and L. A. Bottomley, Chem. Mater., 2010, 22, 2184–2189 CrossRef CAS.
- A. V. Whitney, J. W. Elam, P. C. Stair and R. P. Van Duyne, J. Phys. Chem. C, 2007, 111, 16827–16832 CAS.
- J. F. Li, Y. F. Huang, Y. Ding, Z. L. Yang, S. B. Li, X. S. Zhou, F. R. Fan, W. Zhang, Z. Y. Zhou, D. Y. Wu, B. Ren, Z. L. Wang and Z. Q. Tian, Nature, 2010, 464, 392–395 CrossRef CAS PubMed.
- J. M. McLellan, A. Siekkinen, J. Y. Chen and Y. N. Xia, Chem. Phys. Lett., 2006, 427, 122–126 CrossRef CAS PubMed.
- B. C. H. Steele, Solid State Ionics, 2000, 129, 95–110 CrossRef CAS.
- Z. P. Shao and S. M. Haile, Nature, 2004, 431, 170–173 CrossRef CAS PubMed.
- C. Xia, W. Rauch, F. Chen and M. Liu, Solid State Ionics, 2002, 149, 11–19 CrossRef CAS.
- H. Huang, M. Nakamura, P. C. Su, R. Fasching, Y. Saito and F. B. Prinz, J. Electrochem. Soc., 2007, 154, B20–B24 CrossRef CAS PubMed.
- J. R. McBride, K. C. Hass, B. D. Poindexter and W. H. Weber, J. Appl. Phys., 1994, 76, 2435–2441 CrossRef CAS.
- Y. M. Choi, H. Abernathy, H.-T. Chen, M. C. Lin and M. Liu, ChemPhysChem, 2006, 7, 1957–1963 CrossRef CAS PubMed.
- L. F. Nie, M. F. Liu, Y. J. Zhang and M. L. Liu, J. Power Sources, 2010, 195, 4704–4708 CrossRef CAS PubMed.
- H. Takahashi, T. Takeguchi, N. Yamamoto, M. Matsuda, E. Kobayashi and W. Ueda, J. Mol. Catal. A: Chem., 2011, 350, 69–74 CrossRef CAS PubMed.
- H. Kurokawa, T. Z. Sholklapper, C. P. Jacobson, L. C. De Jonghe and S. J. Visco, Electrochem. Solid-State Lett., 2007, 10, B135–B138 CrossRef CAS PubMed.
- M. B. Pomfret, J. Marda, G. S. Jackson, B. W. Eichhorn, A. M. Dean and R. A. Walker, J. Phys. Chem. C, 2008, 112, 5232–5240 CAS.
- A. Mineshige, T. Taji, Y. Muroi, M. Kobune, S. Fujii, N. Nishi, M. Inaba and Z. Ogumi, Solid State Ionics, 2000, 135, 481–485 CrossRef CAS.
- T. Itoh, K. Abe, K. Dokko, M. Mohamedi, I. Uchida and A. Kasuya, J. Electrochem. Soc., 2004, 151, A2042–A2046 CrossRef CAS PubMed.
- X. Zhang, Y. Zhu, X. Yang, S. Wang, J. Shen, B. Lin and C. Li, Nanoscale, 2013, 5, 3359–3366 RSC.
- H. Sakai, T. Kanda, H. Shibata, T. Ohkubo and M. Abe, J. Am. Chem. Soc., 2006, 128, 4944–4945 CrossRef CAS PubMed.
- A. S. Nair, T. Pradeep and I. MacLaren, J. Mater. Chem., 2004, 14, 857–862 RSC.
- V. Eswaranand and T. Pradeep, J. Mater. Chem., 2002, 12, 2421–2425 RSC.
Footnote |
| † Electronic supplementary information (ESI) available: Fig. S1–S12, fabrication and characterization of Ag@SiO2 nanoparticles, the preparation of the SERS samples, the details of the enhancement factor calculation and the apparatus for in situ SERS analysis of nickel coking and CeO2 redox. See DOI: 10.1039/c3ee42462f |
| This journal is © The Royal Society of Chemistry 2014 |


