 Open Access Article
Serum albumin enhances the membrane activity of ZnO nanoparticles†
Adam H.
Churchman
a,
Rachel
Wallace
b,
Steven J.
Milne
b,
Andy P.
Brown
b,
Rik
Brydson
b and
Paul A.
Beales
*a
aCentre for Molecular Nanoscience, School of Chemistry, University of Leeds, Leeds, LS2 9JT, UK. E-mail: p.a.beales@leeds.ac.uk
bInstitute for Materials Research, SPEME, University of Leeds, Leeds, LS2 9JT, UK
First published on 8th January 2013
Abstract
We investigate the effect of serum albumin on the interaction of ZnO nanoparticles with DOPC lipid membranes and show that the size-stabilizing effect of the protein corona enhances their interaction with lipid membranes, which manifests, in part, as an increased ordering in the lipid packing.
Formation of protein coronas around engineered nanoparticles (NPs) has been shown to have a significant impact on how these materials interact with biology.1 This has profound implications for the potential toxicity of nanomaterials and their biomedical applications such as therapeutic delivery and diagnostic imaging.2 For example, protein coronas formed in serum have been shown to reduce cell uptake and toxicity of several classes of NP.3–6 However, serum has been found not to reduce the toxicity of ZnO NPs to an MCF-7 human breast cancer cell line.6 It is becoming clear that understanding the effect of serum proteins within toxicology assays is an important challenge in resolving apparently contradictory reports of nanomaterial toxicity.7
To gain a deeper fundamental understanding of the physical nature of these nano–bio interactions, minimal model systems with a small, known number of constituents need to be employed.8 Such minimal systems offer unique opportunities to isolate and investigate passive interaction mechanisms. Of particular interest is the ability of NPs to cross biological barriers, which in part determines their eventual biodistribution. For example, the interaction of NPs with plasma membranes regulates their access to the interior biomolecular machinery of cells. The structural matrix of a cell membrane consists of a lipid bilayer, which can be reconstituted into model biomembranes in the form of unsupported vesicles for the purpose of fundamental biophysical analysis. Interactions of NPs with lipid membranes reveal rich phenomenology, even within such minimal systems, where interactions are highly dependent upon NP properties such as polarity, charge, shape and size.9,10
Here, we investigate the interaction of ZnO NPs with model biomembranes composed of the common phospholipid dioleoyl phosphocholine (DOPC). ZnO NPs are commonly used in coatings, pigments and sun screens and despite its solubility is generally shown not to be toxic unless inhaled.11,12 When however ZnO NPs do penetrate cells it has recently been reported that they may be carcinogenic as a result of causing DNA damage.13 Therefore work towards understanding the interactions of ZnO NPs at the cell membrane, which may allow them to gain access to the cell interior, will be important in developing particle engineering strategies that passivate these materials against cell uptake (or to optimise uptake for therapeutic purposes, e.g. cancer therapy14,15). To mimic the effects of a primitive protein corona, our studies are conducted with or without the presence of serum albumin (bovine; BSA), by far the most abundant protein in blood serum. ZnO NP samples prepared with BSA were created from an initial stock solution of 10 mg ZnO NPs dispersed within 1 ml of 100 mg ml−1 BSA in water. This concentration of BSA is comparable to the total protein concentration in blood serum, approximately half of which is serum albumin. This stock solution was diluted into experimental samples as required.
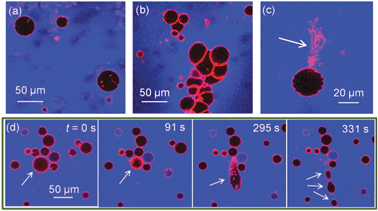
We find that the presence of BSA significantly increases morphological transitions of lipid membranes resulting from addition of ZnO NPs. The primary membrane models we utilise are giant unilamellar vesicles (GUVs), which allow direct optical observation of membrane perturbation by NPs due to their microscale architecture.16–19 DOPC GUVs were formed by electroformation20 and contained a trace component (0.5 mol%) of Rhodamine-labelled lipid (Rh-DOPE). Confocal fluorescence microscopy was used to image morphology changes in GUVs induced by ZnO NPs. Control experiments confirmed no significant impact on GUV morphology is caused by BSA alone or Zn2+ ions (5.6 mM ZnSO4: equivalent to the maximum total Zn concentration in our ZnO NP experiments). Fig. 1a shows GUVs in the presence of 420 μg ml−1 ZnO NPs (no BSA); little change in morphology was observed except for the occasional lipid tubule protruding from/into some GUVs. Conversely when the same concentration of ZnO NPs in the presence of 4.2 mg ml−1 BSA is added to GUVs, several significant morphological responses were seen (Fig. 1b–d). The overall interaction appears to be highly complex with aggregation of GUVs (Fig. 1b), large numbers of lipid nanotubes ejected from the membrane (Fig. 1c) and fission processes into smaller GUVs (Fig. 1d). Despite these dramatic observations, the permeability barrier of the membrane surprisingly remains largely intact. 10 kDa Alexa Fluor 647 dextran (blue; A647-10k) acting as a passive leakage marker in the external environment of the GUVs remains excluded from the interior lumen of >95% of GUVs (Fig. 1). The conservation of the membranes’ barrier properties strongly implies that these NPs do not passively translocate into the interior lumen of the GUVs and thus only directly interact with the outer lipid monolayer of the GUVs. The resultant asymmetry of NPs across the membrane may therefore lead to curvature effects that drive the observed morphological changes, similar to previous reports.16
 | ||
| Fig. 1 Confocal microscopy images of Rh-DOPE labelled GUVs (red) with passive leakage marker A647-10k (blue) in the extravesicular solution. (a) 0.42 mg ml−1 ZnO NPs (no BSA) has minimal impact on GUV morphology; (b–d) 0.42 mg ml−1 ZnO NPs in 4.2 mg ml−1 BSA causes (b) GUV aggregation, (c) ejection of lipid tubules, (d) fission of GUVs shown by time series where GUV initially shrinks in size before elongation and splitting into at least 3 daughter GUVs. Note that few GUVs leak to A647-10k despite dramatic morphological effects. | ||
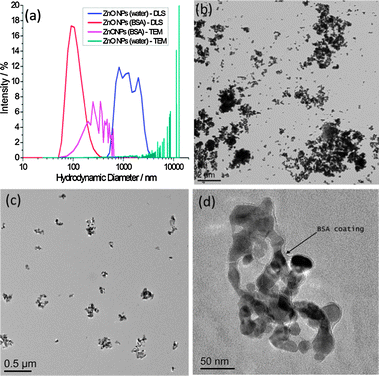
In the absence of BSA, large darker regions were seen to increase in the background of GUV images, which we interpret to be a result of ZnO NP aggregation. This would likely deplete NPs in the suspension, preventing significant interaction with GUV membranes. We investigate the stability of ZnO NP aqueous dispersions with and without BSA by dynamic light scattering (DLS) and transmission electron microscopy (TEM) (Fig. 2). TEM samples were prepared by thin film plunge freezing before sublimation of vitrified water under vacuum, preventing agglomeration of NPs due to sample drying effects.21 Large microscale clusters of ZnO NPs in the absence of BSA are detected by both techniques. However the nanoscale size distribution of ZnO NP dispersions is more stable in the presence of BSA. The nanoscale size distribution is likely preserved by adsorption of proteins onto the NP surface, which lowers the surface free energy, preventing significant aggregation. Evidence for the formation of a corona can be seen in Fig. 2d. The edge of the ZnO NP cluster is encased by a 5–10 nm thick low contrast, amorphous surface layer (assumed to be BSA) as highlighted by the arrow; this is in contrast to the facetted, well defined edges of ZnO NPs imaged after dispersion in water alone.
 | ||
| Fig. 2 (a) Particle size distributions by DLS and TEM for ZnO NPs with and without the presence of BSA; (b–d) TEM images of (b) ZnO NPs (no BSA), (c) ZnO NPs (BSA), (d) higher resolution image of ZnO NPs (BSA) showing evidence of a protein corona, highlighted by the arrow. Scale bars are (b) 2 μm, (c) 0.5 μm and (d) 50 nm. | ||
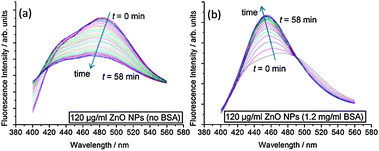
To better understand the impact of ZnO NPs on membrane structure, we use the fluorescence probe Laurdan, which is sensitive to packing and hydration of the lipid bilayer.22 Laurdan has two emission maxima at 440 nm and 490 nm, where an increase in the 440 nm peak with respect to the 490 nm peak indicates that the membrane is in a less hydrated, more ordered state. The change in Laurdan fluorescence with time for an ensemble sample of large unilamellar vesicles (LUVs) in the presence of ZnO NPs is shown in Fig. 3. Clear differences occur between samples with and without BSA. When BSA stabilizes ZnO NP dispersions, the 440 nm peak increases significantly with respect to 490 nm spectral peak, indicating increased ordering of lipids in the membrane. However, without BSA, the intensities at 440 nm and 490 nm both reduce fairly concurrently implying no significant change in lipid ordering but the decrease in overall intensity perhaps relates to adsorption of lipid onto ZnO NP aggregates, removing some of the LUVs from the sample.
 | ||
| Fig. 3 Kinetic evolution of Laurdan spectra after addition of ZnO NP samples. Spectra were taken every 2 min for 1 h. Samples contained 100 μM DOPC LUVs with 0.5 mol% Laurdan in the membranes. (a) 120 μg ml−1 ZnO NPs (no BSA); (b) 120 μg ml−1 ZnO NPs (1.2 mg ml−1 BSA). | ||
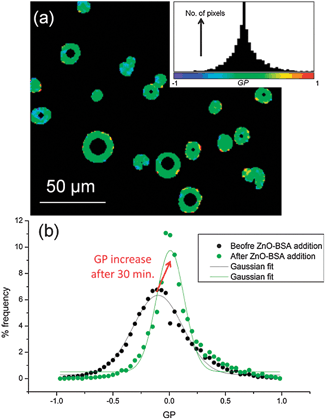
The detected increase in lipid ordering in the presence of BSA-stabilized ZnO NPs is confirmed by multiphoton fluorescence imaging of GUVs containing Laurdan. The normalised ratiometric intensity of the two emission maxima of Laurdan is known as the generalised polarisation function, GP = (I440 − I490)/(I440 + I490) where Ix is the fluorescence intensity at x nm. Higher GP values imply a more ordered, less hydrated lipid membrane. Multiphoton microscopy allows determination of GP with sub-micron spatial resolution.23 GP histograms derived from GUV images (Fig. 4) show an increase in mean GP after 30 min incubation with BSA-stabilised ZnO NPs, implying an increase in lipid ordering. A decrease in GP distribution width is also seen, implying a narrower range of configurations experienced by Laurdan probes. On average, samples with 500 μg ml−1 ZnO NPs and 5 mg ml−1 BSA showed a shift in mean GP value (ΔGP) of +0.12 ± 0.03 and a decrease in distribution width of −0.30 ± 0.10. Neither Laurdan GP maps (Fig. 4a) nor confocal images (Fig. 1) show evidence for phase separation of domains of more ordered lipids within the lipid membranes on optically resolvable length scales, consistent with previous reports of NP-induced lipid ordering in membranes.17,24
 | ||
| Fig. 4 Multiphoton microscopy of Laurdan-labelled GUVs. (a) Example GP image of GUVs with 500 μg ml−1 ZnO NPs in 5 mg ml−1 BSA and the pixel GP histogram and colour map (inset). (b) GP histograms of DOPC GUVs before addition of NPs and after 30 min incubation with 500 μg ml−1 ZnO NPs in 5 mg ml−1 BSA; the histogram shifts to higher mean GP values with a narrower distribution width. | ||
In conclusion, we have shown that BSA stabilizes the nanoscale size distribution of aqueous dispersions of ZnO NPs and that this significantly increases their membrane activity. While the interaction is clearly complex with several different morphology changes observed, we show that these NPs induce an increased ordering of lipids consistent with maintenance of the membrane permeability barrier during the various morphological transitions. This in turn suggests that ZnO NPs do not cross the membrane (as has been reported for MCF-7 cells6) and so an asymmetry of NPs across the lipid bilayer is a likely mechanism that gives rise to curvature driven morphology changes. The smaller size of BSA-ZnO NPs will also create a larger total contact area between NPs and the membrane leading to a greater net impact on membrane properties.25 Ordering, condensation and solidification of lipid membranes are emerging as common themes in NP–biomembrane interactions.17,24 Further work is required to determine if there is a direct link between the ordering of lipids by NPs and the well established efficacy of NPs to cross plasma membranes and access the cell's interior workings. It will also be necessary to improve our understanding of the coupling between particle type, protein corona structure (e.g. exposed functional groups) and the interaction with model biomembranes.
AHC acknowledges the support of Nuffield Foundation Research Bursary URB/39543. PAB thanks the Biomedical and Health Research Centre at the University of Leeds for funding and support. This work is also supported by the ENNSATOX programme funded by EU FP7 under grant agreement no. NMP-229244. The authors thank Dr Claus Svendson from the EU NANOFATE programme for kindly supplying the ZnO nanoparticles. RW and AHC are grateful to Dr Nicole Hondow for help with the TEM plunge freezing. AHC and PAB thank Prof. Christoph Walti for access to and assistance with the multiphoton microscope.
Notes and references
- I. Lynch and K. A. Dawson, Nano Today, 2008, 3, 40 CrossRef CAS.
- A. Nel, T. Xia, L. Madler and N. Li, Science, 2006, 311, 622 CrossRef CAS.
- C. Ge, J. Du, L. Zhao, L. Wang, Y. Liu, D. Li, Y. Yang, R. Zhou, Y. Zhao, Z. Chai and C. Chen, Proc. Natl. Acad. Sci. U. S. A., 2011, 108, 16968 CrossRef CAS.
- W. Hu, C. Peng, M. Lv, X. Li, Y. Zhang, N. Chen, C. Fan and Q. Huang, ACS Nano, 2011, 5, 3693 CrossRef CAS.
- A. Lesniak, F. Fenaroli, M. P. Monopoli, C. Åberg, K. A. Dawson and A. Salvati, ACS Nano, 2012, 6, 5845 CrossRef CAS.
- J. Shi, H. L. Karlsson, K. Johansson, V. Gogvadze, L. Xiao, J. Li, T. Burks, A. Garcia-Bennett, A. Uheida, M. Muhammed, S. Mathur, R. Morgenstern, V. E. Kagan and B. Fadeel, ACS Nano, 2012, 6, 1925 CrossRef CAS.
- S. H. Doak, S. M. Griffiths, B. Manshian, N. Singh, P. M. Williams, A. P. Brown and G. J. S. Jenkins, Mutagenesis, 2009, 24, 285 CrossRef CAS.
- A. E. Nel, L. Maedler, D. Velegol, T. Xia, E. M. V. Hoek, P. Somasundaran, F. Klaessig, V. Castranova and M. Thompson, Nat. Mater., 2009, 8, 543 CrossRef CAS.
- M. Schulz, A. Olubummo and W. H. Binder, Soft Matter, 2012, 8, 4849 RSC.
- H. Noguchi and M. Takasu, Biophys. J., 2002, 83, 299–308 CrossRef CAS.
- R. J. Vandebriel and W. H. De Jong, Nanotechnol., Sci. Appl., 2012, 5, 61 CrossRef CAS.
- P. J. Moos, K. Chung, D. Woessner, M. Honeggar, N. S. Cutler and J. M. Veranth, Chem. Res. Toxicol., 2010, 23, 733 CrossRef CAS.
- K. W. Ng, S. P. K. Khoo, B. C. Heng, M. I. Setyawati, E. C. Tan, X. Zhao, S. Xiong, W. Fang, D. T. Leong and J. S. C. Loo, Biomaterials, 2011, 32, 8218 CrossRef CAS.
- C. Hanley, J. Layne, A. Punnoose, K. M. Reddy, I. Coombs, A. Coombs, K. Feris and D. Wingett, Nanotechnology, 2008, 19, 295103 CrossRef.
- J. W. Rasmussen, E. Martinez, P. Louka and D. G. Wingettt, Expert Opin. Drug Delivery, 2010, 7, 1063 CrossRef CAS.
- Y. Yu and S. Granick, J. Am. Chem. Soc., 2009, 131, 14158 CrossRef CAS.
- S. Zhang, A. Nelson and P. A. Beales, Langmuir, 2012, 28, 12831 CrossRef CAS.
- M. Laurencin, T. Georgelin, B. Malezieux, J.-M. Siaugue and C. Ménager, Langmuir, 2010, 26, 16025 CrossRef CAS.
- P. A. Beales, C. L. Bergstrom, N. Geerts, J. T. Groves and T. K. Vanderlick, Langmuir, 2011, 27, 6107 CrossRef CAS.
- M. I. Angelova and D. S. Dimitrov, Faraday Discuss., 1986, 303 RSC.
- N. Hondow, R. Brydson, P. Wang, M. D. Holton, M. R. Brown, P. Rees, H. D. Summers and A. Brown, J. Nanopart. Res., 2012, 14, 977 CrossRef.
- T. Parasassi, E. K. Krasnowska, L. Bagatolli and E. Gratton, J. Fluoresc., 1998, 8, 365 CrossRef CAS.
- T. Parasassi, E. Gratton, W. M. Yu, P. Wilson and M. Levi, Biophys. J., 1997, 72, 2413 CrossRef CAS.
- B. Wang, L. Zhang, S. C. Bae and S. Granick, Proc. Natl. Acad. Sci. U. S. A., 2008, 105, 18171 CrossRef CAS.
- A. Vakurov, R. Brydson and A. Nelson, Langmuir, 2012, 28, 1246 CrossRef CAS.
Footnote |
| † Electronic supplementary information (ESI) available: Materials and methods. See DOI: 10.1039/c3cc37871c |
| This journal is © The Royal Society of Chemistry 2013 |
