DOI:
10.1039/C3BM60024F
(Paper)
Biomater. Sci., 2013,
1, 633-646
Enhanced endocytosis of acid-sensitive doxorubicin derivatives with intelligent nanogel for improved security and efficacy†
Received
27th January 2013
, Accepted 20th February 2013
First published on 8th April 2013
Abstract
Three derivatives of doxorubicin (DOX) were prepared by modifying DOX with succinic anhydride, cis-aconitic anhydride and 2,3-dimethylmaleic anhydride, generating acid-insensitive succinyl-DOX (SAD), acid-sensitive cis-aconityl-DOX (CAD) and 2,3-dimethylmaleyl-DOX (DAD) respectively. The pH and reduction dual-responsive methoxy poly(ethylene glycol)-poly(L-lysine-co-L-cystine) nanogel was employed to encapsulate the DOX derivatives. In vitro release studies showed that drug release could be accelerated in the intracellular acidic and reductive conditions. Confocal laser scanning microscopy and flow cytometry results demonstrated that an enhanced intracellular drug release was observed in glutathione monoester pretreated HeLa cells (a human cervical cell line). The DOX derivatives exhibited a lower accumulation in the nuclei than DOX. Moreover, the CAD and DAD-loaded nanogels showed a comparable anti-proliferative activity to the DOX-loaded nanogel against HeLa and HepG2 cells (a human hepatoma cell line). As a comparison, the SAD-loaded nanogel almost never inhibited cellular proliferation. The above results suggested that the pH and reduction dual-responsive nanogel can efficiently deliver acid-sensitive DOX derivatives into the nuclei of cancer cells for minimizing the side effects and enhancing the inhibition of cellular proliferation.
1 Introduction
Doxorubicin (DOX) is an anthracycline antibiotic produced by the fungus Streptomyces peucetius, which acts as a DNA intercalator to inhibit topoisomerase II from resealing DNA double helix strands during replication and thereby stopping the reproduction of cells.1 DOX is a widely used antineoplastic agent in the treatment of several paediatric and adult cancers, such as leukemia, lymphomas, breast carcinoma and many other solid tumors.2,3 However, further application of DOX has been hampered by its serious side effects including gastrointestinal disorders, bone marrow toxicity, alopecia, stomatitis, acute and cumulative cardiotoxicity as well as extravasation.4 In order to circumvent these limitations and expand the therapeutic potential of DOX, various approaches have been applied, such as chemical modification5 and loading the drug molecules into nanocarriers including polymeric micelles,6–11 vesicles,12–15 liposomes16,17 and nanogels.18–20
Chemical modification of DOX is an important approach for the development of prodrugs that overcome the side effects.21,22 Chemical modification can modulate the properties of DOX, such as lipophilicity, cellular uptake and prolonged activity.23 An ideal drug should exhibit reduced toxicity to healthy tissue and can be transformed to pharmacologically active agents in the lesion site. Important work has been undertaken to chemically modify DOX with the goal of reducing its systemic toxicity and improving the anti-proliferative activity, which is directly associated with the chemical structure of DOX. The carbohydrate part of DOX is involved in the binding with bases of replicating DNA during the process of anti-proliferation, and the amine group should be freely available for interaction.24–26 Thus, a stimuli-responsively degradable linker was employed to cover the amino group in DOX to minimize the systemic toxicity and enhance the chemotherapy efficacy.
On the other hand, to minimize or eliminate the side effects, various nanocarriers have been developed as vehicles for DOX delivery.27 Especially, the design and preparation of stimuli-responsive nanogels have attracted a great deal of interest. Nanogels have a passive targeting capability due to the enhanced permeability and retention (EPR) effect, resulting from a leaky vasculature and a lack of lymphatic drainage in cancer tissue. Moreover, stimuli-responsive nanogels show a sharp intelligent response to specific external or internal stimuli, such as pH, redox, temperature and enzyme.28–30 Of all the intelligent nanogels, multi-responsive nanogels, especially responding to both pH and reduction, have received great attention for drug delivery.31–33 Both the pH in late endosomes (pH ∼5.5–6.0) and lysosomes (pH ∼5.0), in which drug-loaded nanogels are entrapped through endocytosis, are remarkably lower than the extracellular pH.34 In addition, the disulfide bond is stable at normal physiological conditions, but responds to the presence of glutathione (GSH) or reductases via reversible cleavage into free thiols.35 The intracellular concentration of GSH (∼0.5–10.0 mM) is significantly higher than that outside the cells (∼20.0–40.0 μM). Furthermore, the GSH concentration in some cancer cells (e.g. A549 cells, a human lung adenocarcinoma cell line) has been reported to be several times higher than that in normal cells.36 In view of the dramatic variation of pH and GSH concentration inside and outside cells, the pH and reduction dual-responsive nanogels may hold a vast potential for targeting the intracellular release of anticancer drugs.
Recently, we have prepared a series of pH and reduction dual-responsive disulfide-cross-linked methoxy poly(ethylene glycol) (PEG)-polypeptide nanogels.37In vitro cellular analyses indicated that these pH and reduction dual-responsive nanogels provided a favorable platform to construct excellent drug delivery systems for cancer therapy. To further reduce the side effects and improve the therapeutic efficacies of anticancer drugs, the pH and reduction dual-responsive nanogels can be exploited to deliver chemically modified anticancer drugs.
Herein, acid-insensitive succinyl-DOX (SAD), acid-sensitive cis-aconityl-DOX (CAD) and 2,3-dimethylmaleyl-DOX (DAD) were synthesized through modifying DOX with succinic anhydride (SA), cis-aconitic anhydride (CA) and 2,3-dimethylmaleic anhydride (DA), respectively. CAD and DAD contained an acid-sensitive amide linker, which allowed DOX to be released either in the slightly acidic cancer tissular microenvironment or in the acidic endosomal or lysosomal compartments after cellular uptake. Moreover, a pH and reduction dual-responsive mPEG-poly(L-lysine-co-L-cystine) (mPEG-P(LL-co-LC)) nanogel was employed to load these DOX derivatives. The in vitro drug release behaviors and anti-proliferation profiles of the drug-loaded nanogels were investigated.
2 Materials and methods
2.1 Materials
ε-Benzyloxycarbonyl-L-lysine (ZLL) and L-cystine (LC) were purchased from GL Biochem Co., Ltd. ε-Benzyloxycarbonyl-L-lysine N-carboxyanhydride (ZLL NCA) and L-cystine N-carboxyanhydride (LC NCA) were synthesized as in our previous works.38 mPEG (Mn = 5000) was purchased from Sigma-Aldrich and used without further purification. The amino group terminated mPEG (mPEG-NH2) was synthesized according to a literature procedure.39 GSH, buthionine sulfoximine (BSO), glutathione monoester (GSH-OEt), 3-(4,5-dimethyl-thiazol-2-yl)-2,5-diphenyl tetrazolium bromide (MTT), 4′,6-diamidino-2-phenylindole (DAPI) and Alexa Fluor® 488 phalloidin (Alexa 488) were purchased from Sigma-Aldrich. Doxorubicin hydrochloride (DOX·HCl) was purchased from Zhejiang Hisun Pharmaceutical Co., Ltd. SA, CA and DA were purchased from Sigma-Aldrich. SAD, CAD and DAD were synthesized by decorating DOX with SA, CA and DA according to a previously reported method (Scheme 1).5,40–42 Tetrahydrofuran (THF) and n-hexane were dewatered through refluxation with calcium hydride (CaH2) and subsequent distillation. N,N-Dimethylformamide (DMF) was dried over CaH2 at room temperature for 48 h before vacuum distillation. All the other reagents and solvents were purchased from Sinopharm Chemical Reagent Co., Ltd and used as obtained.
 |
| | Scheme 1 The synthesis pathways for SAD, CAD and DAD. | |
2.2 Preparation of pH and reduction dual-responsive mPEG-P(LL-co-LC) nanogel
As shown in Scheme 2, the mPEG-P(ZLL-co-LC) copolymer was synthesized through a one-step ring-opening polymerization (ROP) of ZLL NCA and LC NCA with mPEG-NH2 as macroinitiator. Typically, ZLL NCA (2.45 g, 8.0 mmol), LC NCA (584.6 mg, 2.0 mmol) and mPEG-NH2 (1.0 g, 0.2 mmol) were dissolved in 50.0 mL dried DMF in a flame-dried flask. The polymerization was performed at 25 °C for 72 h. Then, the solution was precipitated into excess diethyl ether. The obtained product was further washed twice with diethyl ether and dried under vacuum at room temperature for 24 h (yield: 81.9%). 1H NMR (400 MHz, trifluoroacetic acid-d (TFA-d)) δ (ppm): 7.15 (–CH2C6H5, 5H), 5.04 (–CH2C6H5, 2H), 4.51–4.26 (–C(O)CH(CH2CH2–)NH–, 1H and –C(O)CH(CH2S–)NH–, 1H), 3.75 (–CH2CH2O–, 4H), 3.41 (CH3OCH2CH2O–, 3H) and 1.52 (–SCH2–, 2H). The molar ratio of mPEG–ZLL–LC was calculated to be 1![[thin space (1/6-em)]](https://www.rsc.org/images/entities/char_2009.gif) :
:![[thin space (1/6-em)]](https://www.rsc.org/images/entities/char_2009.gif) 36
36![[thin space (1/6-em)]](https://www.rsc.org/images/entities/char_2009.gif) :
:![[thin space (1/6-em)]](https://www.rsc.org/images/entities/char_2009.gif) 9 based on the result of elemental analyses. mPEG-P(LL-co-LC) was synthesized by removing the benzyloxycarbonyl group from mPEG-P(ZLL-co-LC). Briefly, the mPEG-P(ZLL-co-LC) copolymer was dissolved in TFA at a concentration of 100.0 g L−1, and hydrobromic acid–acetic acid (33 wt%) was then added (3.0 mL for 1.0 g copolymer). After stirring for 30 min at 25 °C, the mixture was precipitated into excess diethyl ether. The obtained product was further washed twice with diethyl ether and dried in vacuo at room temperature for 24 h (yield: 86.3%). The molar ratio of mPEG–LL–LC was calculated to be 1
9 based on the result of elemental analyses. mPEG-P(LL-co-LC) was synthesized by removing the benzyloxycarbonyl group from mPEG-P(ZLL-co-LC). Briefly, the mPEG-P(ZLL-co-LC) copolymer was dissolved in TFA at a concentration of 100.0 g L−1, and hydrobromic acid–acetic acid (33 wt%) was then added (3.0 mL for 1.0 g copolymer). After stirring for 30 min at 25 °C, the mixture was precipitated into excess diethyl ether. The obtained product was further washed twice with diethyl ether and dried in vacuo at room temperature for 24 h (yield: 86.3%). The molar ratio of mPEG–LL–LC was calculated to be 1![[thin space (1/6-em)]](https://www.rsc.org/images/entities/char_2009.gif) :
:![[thin space (1/6-em)]](https://www.rsc.org/images/entities/char_2009.gif) 34
34![[thin space (1/6-em)]](https://www.rsc.org/images/entities/char_2009.gif) :
:![[thin space (1/6-em)]](https://www.rsc.org/images/entities/char_2009.gif) 7 based on the result of elemental analyses. The pH and reduction dual-responsive mPEG-P(LL-co-LC) nanogel was prepared by directly dispersing the resultant copolymer in phosphate buffered solution (PBS).
7 based on the result of elemental analyses. The pH and reduction dual-responsive mPEG-P(LL-co-LC) nanogel was prepared by directly dispersing the resultant copolymer in phosphate buffered solution (PBS).
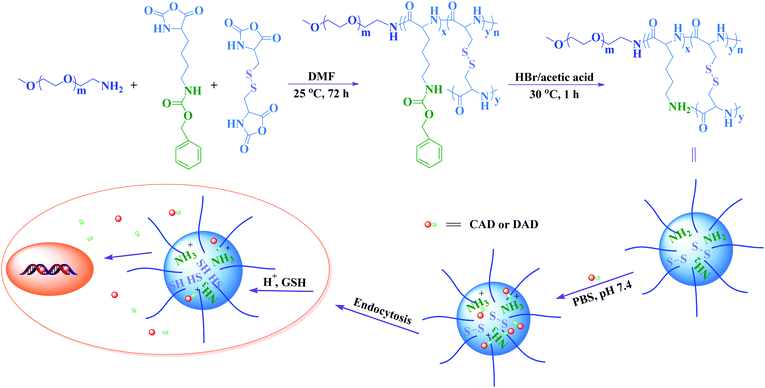 |
| | Scheme 2 Schematic illustration of mPEG-P(LL-co-LC) nanogel preparation, DOX derivatives loading and intracellular release. | |
2.3 Characterizations
The contents of carbon, hydrogen and nitrogen elements of copolymers were estimated by elemental analyses (Vario EL III, Germany). Proton nuclear magnetic resonance (1H NMR) spectra were recorded on a Bruker AV 400 NMR spectrometer in TFA-d. Dynamic laser scattering (DLS) measurements were performed on a WyattQELS instrument with a vertically polarized He–Ne laser (DAWN EOS, Wyatt Technology). The scattering angle was fixed at 90°. Fluorescence experiments were performed on a PTI Fluorescence Master System with software Felix 4.1.0.
Bovine serum albumin (BSA) was used as a model protein to determine the protein adsorption of the mPEG-P(LL-co-LC) nanogel. The nanogel was incubated with a solution of BSA in PBS at pH 7.4, with the final concentrations of the nanogel and BSA at 0.20 and 0.25 g L−1, respectively. After incubation at 37 °C for a determined time, 200.0 μL of each sample was withdrawn, and then centrifuged at 16![[thin space (1/6-em)]](https://www.rsc.org/images/entities/char_2009.gif) 000 rpm for 16 min to precipitate the protein-adsorbed nanogel. The BSA concentration of the supernatant was determined using UV-vis spectroscopy by measuring the maximal absorbance at 280 nm. Then, the amount of BSA adsorbed on the nanogel was calculated against a standard calibration curve. mPEG with a molecular weight of 5000 (mPEG5k) and branched polyethylenimine with a molecular weight of 25
000 rpm for 16 min to precipitate the protein-adsorbed nanogel. The BSA concentration of the supernatant was determined using UV-vis spectroscopy by measuring the maximal absorbance at 280 nm. Then, the amount of BSA adsorbed on the nanogel was calculated against a standard calibration curve. mPEG with a molecular weight of 5000 (mPEG5k) and branched polyethylenimine with a molecular weight of 25![[thin space (1/6-em)]](https://www.rsc.org/images/entities/char_2009.gif) 000 (PEI25k) were used as negative and positive controls, respectively.
000 (PEI25k) were used as negative and positive controls, respectively.
2.5 Hemolysis activity examination
The hemolysis property of the nanogel was examined by spectrophotometry. Rabbit blood stabilized with dipotassium ethylene diamine tetraacetate was obtained from the Experimental Animal Center of Jilin University. To obtain red blood (RB) cells, 5.0 mL rabbit blood sample was added to 10.0 mL physiological saline (PS), and then RB cells were isolated from the serum by centrifugation at 1200 rpm for 8 min. The RB cells were further washed six times with 40.0 mL PS. Following the last wash, the remaining RB cells were dispersed in 30.0 mL PS. The nanogel suspended in 0.4 mL PS at different concentrations was separately mixed with 0.4 mL RB cells suspended in PS. The mixtures were then incubated at 37 °C in a thermostatted water bath for 2 h. Then, RB cells were centrifuged at 3000 rpm for 10 min and 100.0 μL supernatant of each sample was transferred to a 96-well plate. Free hemoglobin in the supernatant was measured with a Bio-Rad 680 microplate reader at 540 nm. PS and Triton X-100 (10 g L−1) were used as negative and positive controls, respectively. All hemolysis experiments were carried out in triplicate. The hemolysis ratio (HR) of the RB cells was calculated with eqn (1):| |  | (1) |
In eqn (1), Asample, Anegative control and Apositive control are denoted as the absorbances of the sample, negative and positive controls, respectively.
2.6 Methyl thiazolyl tetrazolium (MTT) assay
The cytotoxicities of the nanogel to HeLa (a human cervical cell line), HepG2 (a human hepatoma cell line) and L929 cells (a mouse fibroblast cell line, as a model of a normal cell line) were evaluated in vitro by a MTT assay. The cells were seeded in 96-well plates at 7.0 × 10³ cells per well in 200.0 μL complete Dulbecco's modified Eagle's medium (DMEM) containing 10% (v/v) fetal bovine serum, 50 IU mL−1 penicillin and 50 IU mL−1 streptomycin, and incubated at 37 °C in 5% (v/v) carbon dioxide (CO2) atmosphere for 24 h, followed by removing the culture medium and adding nanogel solutions at different concentrations (0–100.0 mg L−1). The cells were subjected to a MTT assay after being incubated for another 72 h. The absorbance of the solution was measured on a Bio-Rad 680 microplate reader at 490 nm. The cell viability was calculated based on eqn (2):| |  | (2) |
In eqn (2), Asample and Acontrol represent the absorbances of the sample and control wells, respectively.
2.7 Lactate dehydrogenase (LDH) assay
The in vitro cytotoxicities of the nanogel to HeLa, HepG2 and L929 cells were also evaluated by a LDH assay. The LDH assay was performed according to a previously recorded approach.43 PBS and 2% (v/v) Triton X-100 were used as negative and positive controls, respectively. The HeLa cells were seeded in 96-well plates at 7.0 × 10³ cells per well in 200.0 μL complete DMEM and incubated at 37 °C in 5% (v/v) CO2 atmosphere for 24 h, followed by removing the culture medium and adding nanogel solutions at different concentrations (0–100.0 mg L−1). Following exposure to the nanogel for 72 h, the culture medium was aspirated and centrifuged at 3000 rpm for 5 min in order to obtain a cell-free supernatant. The activity of LDH in the medium was determined using a commercial LDH kit according to the manufacturer's protocols, and the absorbance of the solution was measured on a Bio-Rad 680 microplate reader at 490 nm. The LDH release was calculated using eqn (3):| |  | (3) |
In eqn (3), Asample, Anegative control and Apositive control are denoted as the absorbances of the sample, negative and positive controls, respectively.
2.8
In vitro drug loading and release
SAD, CAD, DAD and DOX-loaded nanogels were prepared by a simple diffusion and dialysis technique. Typically, the nanogel (20.0 mg) and drug (4.0 mg) were mixed in 3.0 mL PBS at pH 7.4. The mixture was stirred at room temperature for 24 h, and then dialyzed against deionized water for 24 h. The dialysis medium was renewed five times and the whole procedure was performed in the dark. Then, the solution was filtered and lyophilized, yielding drug-loaded nanogels. To determine the drug loading content (DLC) and drug loading efficiency (DLE), the drug-loaded nanogel was dissolved in DMF and analyzed by a fluorescence spectrometer using a standard curve method (λex = 480 nm). The DLC and DLE of the drug-loaded nanogel were calculated according to eqn (4) and (5), respectively:| |  | (4) |
| |  | (5) |
In vitro drug release profiles of drug-loaded nanogels were investigated in PBS at pH 5.3, 6.8 or 7.4 without or with 10.0 mM GSH. The weighed freeze-dried drug-loaded nanogel was suspended in 8.0 mL release medium and transferred into a dialysis bag (MWCO 3500 Da). The release experiment was initiated by placing the end-sealed dialysis bag into 50.0 mL release medium at 37 °C with continuous shaking at 70 rpm. At predetermined intervals, 2.0 mL external release medium was taken out and an equal volume of fresh release medium was replenished. The amount of released drug was determined using fluorescence measurements (λex = 480 nm). The release experiments were conducted in triplicate.
2.9 Cellular uptakes of DOX derivatives
The cellular uptakes of DOX derivatives toward HeLa cells were observed by confocal laser scanning microscopy (CLSM) and flow cytometry.
CLSM.
The cells were seeded in 6-well plates at 2.0 × 10⁵ cells per well in 2.0 mL complete DMEM and cultured at 37 °C in 5% (v/v) CO2 atmosphere for 24 h. The cells were washed with PBS and incubated at 37 °C for an additional 3 h with DOX derivatives at a final drug concentration of 17.2 μM in complete DMEM. Then, the culture medium was removed and the cells were washed with PBS thrice. Thereafter, the cells were fixed with 4% (w/v) paraformaldehyde for 30 min at room temperature. Then, the cells were counterstained with DAPI for cellular nuclei and Alexa 488 for F-actin following the manufacturer's instructions. CLSM images of the cells were determined on a confocal microscope (Olympus FluoView 1000).
Flow cytometry.
The cells were seeded in 6-well plates at 2.0 × 10⁵ cells per well in 2.0 mL complete DMEM and cultured at 37 °C in 5% (v/v) CO2 atmosphere for 24 h. Cells were washed with PBS and incubated at 37 °C for an additional 3 h with DOX derivatives at a final drug concentration of 17.2 μM in complete DMEM. Thereafter, the culture medium was removed. The cells were washed with PBS thrice and treated with trypsin. Then, 2.0 mL PBS was added to each culture well, and the solutions were centrifuged for 5 min at 3000 rpm. After the removal of supernatants, the cells were resuspended in 0.4 mL PBS. Data for 1.0 × 10⁴ gated events were collected, and analysis was performed with flow cytometry (Beckman, California, USA).
2.10 Intracellular drug release
The cellular uptakes and intracellular release behaviors of drug-loaded nanogels toward HeLa cells were observed by CLSM and flow cytometry.
CLSM.
The cells were seeded in 6-well plates at 2.0 × 10⁵ cells per well in 2.0 mL complete DMEM and cultured at 37 °C in 5% (v/v) CO2 atmosphere for 24 h, and then treated with BSO for 12 h or GSH-OEt for 2 h. The cells were washed with PBS and incubated at 37 °C for an additional 3 h with drug-loaded nanogels at a final drug concentration of 17.2 μM in complete DMEM. The cells without pretreatment were used as control. Then, the culture medium was removed and the cells were washed with PBS thrice. Thereafter, the cells were fixed with 4% (w/v) paraformaldehyde for 30 min at room temperature. Then, the cells were counterstained with DAPI for cellular nuclei and Alexa 488 for F-actin following the manufacturer's instructions. CLSM images of the cells were determined on a confocal microscope (Olympus FluoView 1000).
Flow cytometry.
The cells were seeded in 6-well plates at 2 × 10⁵ cells per well in 2.0 mL complete DMEM and cultured at 37 °C in 5% (v/v) CO2 atmosphere for 24 h, and then treated with BSO for 12 h or GSH-OEt for 2 h. The cells were washed with PBS and incubated at 37 °C for an additional 3 h with drug-loaded nanogels at a final drug concentration of 17.2 μM in complete DMEM. The cells without pretreatment were used as control. Thereafter, the culture medium was removed. The cells were washed with PBS thrice and treated with trypsin. Then, 2.0 mL PBS was added to each culture well, and the solutions were centrifuged for 5 min at 3000 rpm. After the removal of supernatants, the cells were resuspended in 0.4 mL PBS. Data for 1.0 × 10⁴ gated events were collected, and analysis was performed with flow cytometry (Beckman, California, USA).
2.11 Cellular proliferation inhibition assays
The cellular proliferation inhibition capabilities of SAD, CAD, DAD and DOX against HeLa and HepG2 cells were evaluated in vitro by a MTT assay. The cells were seeded in 96-well plates at 1.0 × 10⁴ cells per well in 100.0 μL complete DMEM and incubated at 37 °C in 5% (v/v) CO2 atmosphere for 24 h, followed by removing the culture medium and adding drug solutions at different concentrations (0–17.2 μM). The cells were subjected to a MTT assay after being incubated for another 24, 48 or 72 h. The absorbance of the solution was measured on a Bio-Rad 680 microplate reader at 490 nm. The cell viability (%) was calculated based on eqn (2).
The cellular proliferation inhibition capabilities of SAD, CAD, DAD and DOX-loaded nanogels against HeLa and HepG2 cells were also evaluated in vitro by a MTT assay. Cells were seeded into 96-well plates at 1.0 × 10⁴ cells per well in 200.0 μL complete DMEM and incubated at 37 °C in 5% (v/v) CO2 atmosphere for 24 h. Then, cells were treated with 0.5 mM BSO for 12 h or 10.0 mM GSH-OEt for 2 h. The cells without pretreatment were used as control. After washing cells with PBS, drug-loaded nanogels were added with different drug concentrations (0–17.2 μM). The cells were subjected to a MTT assay after being incubated for another 24, 48 or 72 h. The absorbance of the solution was measured on a Bio-Rad 680 microplate reader at 490 nm. The cell viability (%) was calculated based on eqn (2).
3 Results and discussion
3.1 Biocompatibility of mPEG-P(LL-co-LC) nanogel
In this work, the hemocompatibility and cytocompatibility of the mPEG-P(LL-co-LC) nanogel were adequately investigated. The nanogel should keep its long-term stability in the bloodstream, and effectively minimize the interaction with blood components. Here, the protein adsorption of the nanogel was assessed using BSA as a model protein.9,19 As shown in Fig. 1A, for all the incubation time (i.e. 2 and 4 h), the nanogel and mPEG5k showed very limited BSA adsorption, while PEI25k interacted strongly with BSA. Therefore, the nanogel should be a potential delivery system for anticancer drugs because the outside mPEG shell provided a “stealth” character, which could avoid recognition by the reticuloendothelial system and enable a long period of circulation in vivo. In addition, the hemocompatibility of the nanogel was also assessed by a hemolysis assay. An enhanced HR results in a higher level of broken RB cells. As shown in Fig. 1B, the nanogel showed a slight hemolysis toxicity (<10%) to RB cells even at a high concentration of 100.0 mg L−1. Evaluation of the cytocompatibility of the nanogel was also necessary for drug delivery applications. The in vitro cytotoxicities of the nanogel to HeLa, HepG2 and L929 cells were evaluated by MTT and LDH assays. As shown in Fig. 1C, the viabilities of cells treated with the nanogel for 72 h were above 70% at concentrations up to 100.0 mg L−1, revealing the low toxicity of the nanogel to cells in this concentration range. To assess the damage of cell membranes, the extracellular concentration of LDH was quantified. As shown in Fig. 1D, the baseline values of LDH released from the cell was less than 20% in all cell types at concentrations up to 100.0 mg L−1. Less than 20% LDH release was regarded as a low level of toxicity in LDH assays. These results indicated that the nanogel was hemocompatible and cytocompatible, allowing potential application as a drug delivery vehicle.
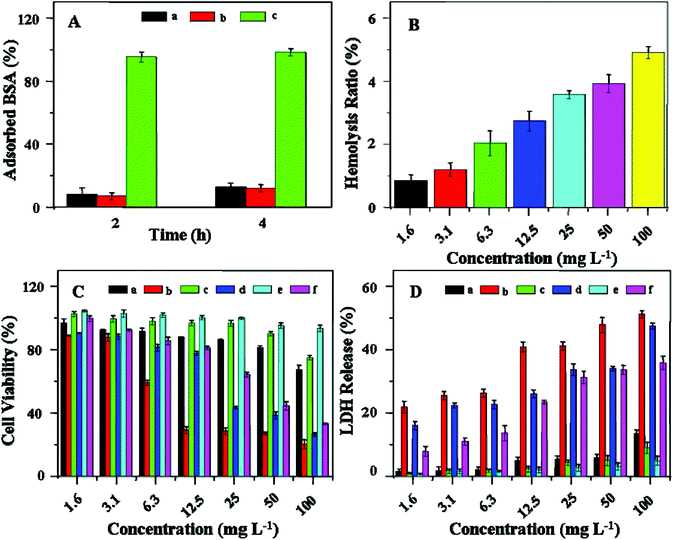 |
| | Fig. 1 BSA adsorption on nanogel (a), mPEG5k (b) and PEI25k (c) after incubation at 37 °C for different periods of time (A). Percentage of RB cell hemolysis incubated with nanogel (B). Cell viabilities of HeLa (a and b), HepG2 (c and d) and L929 cells (e and f) incubated with nanogel (a, c and e) and PEI25k (b, d and f) for 72 h (C). PEI25k was used as a positive control. Data are presented as a mean ± standard deviation (n = 6). LDH release of HeLa (a and b), HepG2 (c and d) and L929 cells (e and f) incubated with nanogel (a, c and e) and PEI25k (b, d and f) for 72 h (D). PEI25k was used as a positive control. Data are presented as a mean ± standard deviation (n = 6). | |
3.2
In vitro drug loading and stimuli enhanced release
In this work, SAD, CAD, DAD or DOX was loaded into the nanogel by mixing separate solutions of drug and nanogel in PBS at pH 7.4 and subsequently dialyzing against deionized water (Scheme 1, S1 and S2, ESI†). As shown in Table 1, the SAD, CAD and DAD-loaded nanogels exhibited a high level of DLE (∼90 wt%), while the DLE of the DOX-loaded nanogel was only 11.34 wt%. It revealed that the electrostatic attraction between the carboxyl group in the DOX derivative and the amino group in the core of the nanogel played an important role in drug loading.37
Table 1 The DLC and DLE of drug-loaded nanogels
| Drug |
R
h (nm) |
DLC (wt%) |
DLE (wt%) |
| SAD |
153 ± 6.2 |
14.56 |
87.36 |
| CAD |
174 ± 3.3 |
15.82 |
94.92 |
| DAD |
164 ± 5.6 |
15.25 |
91.50 |
| DOX |
133 ± 2.1 |
1.89 |
11.34 |
The hydrodynamic radii (Rh) of drug-loaded nanogels were measured by DLS. As shown in Table 1 and Fig. S1, ESI,† the Rh of SAD, CAD, DAD and DOX-loaded nanogels were 174 ± 3.3, 153 ± 6.2, 164 ± 5.6 and 133 ± 2.1 nm, respectively. The suitable sizes of drug-loaded nanogels could be easily accumulated in cancer tissues due to the EPR effect.44
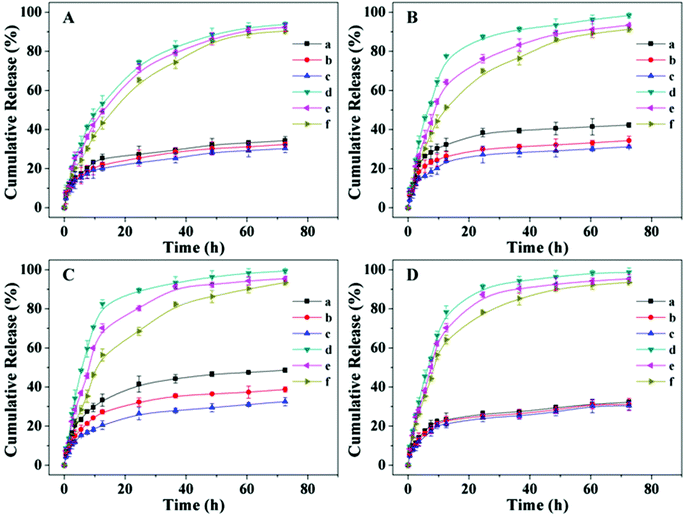
The in vitro drug release behaviors of SAD, CAD, DAD and DOX-loaded nanogels were investigated at pH 5.3, 6.8 or 7.4 without or with 10.0 mM GSH. As shown in Fig. 2A, slow drug release from the SAD-loaded nanogel was observed at all pHs in the absence of GSH. Only about 30% (mol mol−1) loaded drug was released from the SAD-loaded nanogel in the test duration (72.5 h). However, the drug release was accelerated in PBS at all pHs with 10.0 mM GSH, analogous to the intracellular reductive microenvironment. About 90% (mol mol−1) loaded SAD was released in 72.5 h. The fast SAD release from the nanogel in reductive conditions was most likely due to swelling of the nanogel induced by cleavage of the disulfide bond. Similar drug release behaviors of CAD, DAD and DOX-loaded nanogels were shown in Fig. 2B, C and D. Based on the above results, it could be concluded that the release rate of the drug from the drug-loaded nanogel could be adjusted by the presence of GSH.38
 |
| | Fig. 2
In vitro drug release from SAD (A), CAD (B), DAD (C) and DOX-loaded nanogels (D) at pH 5.3 (a), 6.8 (b) or 7.4 (c) without GSH, and pH 5.3 (d), 6.8 (e) or 7.4 (f) with 10.0 mM GSH in PBS at 37 °C. Data are presented as a mean ± standard deviation (n = 3). | |
The in vitro drug release behaviors from all drug-loaded nanogels were pH-dependent. As shown in Fig. 2A and D, the drug release rate from the SAD and DOX-loaded nanogels slightly increased as the pH decreased from 7.4 to 5.3 without or with 10.0 mM GSH. The accelerated SAD and DOX release at acidic pH was probably due to swelling of the nanogel, the reduction of electrostatic attraction between SAD and the nanogel, and the elevation of electrostatic repulsion between the nanogel and DOX. The drug release behaviors of the CAD-loaded nanogel at different pHs without or with GSH were shown in Fig. 2B. More than 70% (mol mol−1) loaded drug was released from the CAD-loaded nanogel during the first 12 h in PBS at pH 5.3 with 10.0 mM GSH, mimicking the intracellular microenvironment. While, less than 50% (mol mol−1) loaded drug was released from the CAD-loaded nanogel at pH 7.4 with 10.0 mM GSH during the same test duration. This obvious pH-dependent release behavior likely resulted from the pH related interaction between the nanogel and drug and the stability of CAD. As the pH decreased from 7.4 to 5.3, the electrostatic attraction between the positively charged nanogel and the negative charged CAD was reduced, and the acid-sensitive amide in CAD was hydrolyzed into the primary amine (Scheme S3, ESI†).5 Under acidic conditions, the amino group (–NH2) in the nanogel core could transform into a protonated amino group (–NH3+), which induced the swelling of the nanogel. These all resulted in the accelerated drug release from the CAD-loaded nanogel in an acidic environment. As shown in Fig. 2C, drug release from the DAD-loaded nanogel was also pH-dependent. The release rate decreased as the pH increased, that is, the release rate was in the order pH 5.3 > pH 6.8 > pH 7.4 without and with GSH. Furthermore, the pH-dependent release sensitivity of the DAD-loaded nanogel was more obvious compared to that of the CAD-loaded nanogel. This superiority was most likely due to the faster hydrolysis rate of acid-sensitive amides in DAD than that in CAD, which lead to the accelerated drug release.45,46 In addition, as shown in Fig. 2A and D, the drug release rate of SAD and DOX-loaded nanogels could be slightly affected by the decreased pH, which further indicated that the acidic condition induced rapid hydrolysis of CAD and DAD, which played a crucial role in improving the drug release rate.47
Based on the above results, it could be concluded that the drug release from the drug-loaded nanogel could be accelerated by reductive and acidic conditions. Swelling of the nanogel induced by cleavage of the disulfide bond and protonation of the amino group could accelerate the drug release. Furthermore, the reduced electrostatic attraction between the positively charged nanogel and negatively charged SAD, CAD and DAD, and rapid hydrolysis of the amide bonds in CAD and DAD could also accelerate the drug release in an acidic environment. These multi-responsive profiles could minimize loss of the drug in the circulation and enhance acceleration of the drug in the lesion site to reduce the side effects and enhance the overall therapeutic efficacy in vivo.
3.3 Cellular uptakes of DOX derivatives
The cellular uptakes of DOX and DOX derivatives were followed by CLSM and flow cytometry toward HeLa cells. As shown in Fig. 3, DOX and DOX derivatives can be efficiently internalized by HeLa cells. Obviously, free DOX mainly localized in the nuclei and showed the greatest fluorescence intensity. The DAD showed higher fluorescence intensity in the nuclei compared with CAD and SAD. Notably, Parang et al. reported that the derivatives of DOX were harder to enter the nuclei than DOX.23 In this work, CAD and DAD could be quickly hydrolyzed into DOX in the acidic intracellular microenvironment. The DOX release from DAD was faster than that from CAD in the cancer cell due to the more acid-sensitive amide linker, and then the released DOX could rapidly accumulate in the nuclei. The weakest fluorescence intensity in the nuclei was observed when cells were treated with SAD, attributed to the stable amide linker in acid-insensitive SAD, which allowed the lowest accumulation of the drug (i.e. SAD and DOX) in the nuclei. The above results were further quantitatively analyzed with flow cytometry. As shown in Fig. 4, the fluorescence intensities of cells incubated with DOX and DOX derivatives were in the following order: DOX > DAD > CAD > SAD, which were compatible with the results of CLSM. These data suggested that the effective cellular internalization and sustained intracellular hydrolysis of DOX derivatives, and rapid nuclear relocalization allowed a prolonged exposure of cancer cells in a high concentration of DOX.
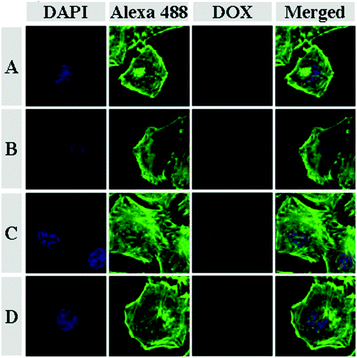 |
| | Fig. 3 CLSM microimages of HeLa cells incubated with SAD (A), CAD (B), DAD (C) and DOX (D) for 3 h. For each panel, the microimages from left to right show cellular nuclei stained by DAPI (blue), F-actin stained by Alexa 488 (green), DOX fluorescence in cells (red) and the overlays of the three microimages. | |
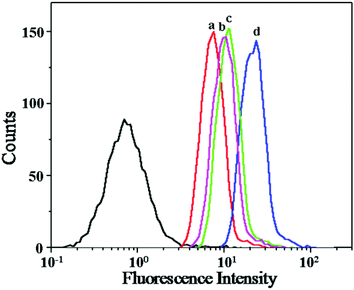 |
| | Fig. 4 Flow cytometric profiles of HeLa cells incubated with SAD (a), CAD (b), DAD (c) and DOX (d) for 3 h. | |
3.4 Intracellular delivery of DOX derivatives
To demonstrate whether the drug could be effectively delivered into cancer cells, the cellular uptakes and intracellular release behaviors of drug-loaded nanogels were followed with CLSM and flow cytometry toward HeLa cells. HeLa cells were first pretreated with 0.5 mM BSO for 12 h or with 10.0 mM GSH-OEt for 2 h, and then incubated with drug-loaded nanogels containing an equivalent amount of drug (17.2 μM) for 3 h. HeLa cells without pretreatment were used as a control. It is documented that BSO is an inhibitor for the intracellular synthesis of GSH, and GSH-OEt can obviously improve the intracellular GSH concentration.48 As expected, the strongest intracellular drug fluorescence intensity was observed in the GSH-OEt pretreated cells after incubation with all drug-loaded nanogels (Fig. 5). In contrast, the weakest fluorescence intensity was shown in the cells incubated with BSO. This enhanced fluorescence intensity in the GSH-OEt pretreated HeLa cells should be the result of improved intracellular drug release caused by the reduction responsive degradation of the nanogel. Similarly with the results of free drugs, the intracellular drug fluorescence intensity of the drug-loaded nanogel was in the order DOX-loaded nanogel > DAD-loaded nanogel > CAD-loaded nanogel > SAD-loaded nanogel. This corresponds to the order of free DOX concentration in the cells incubated with drug-loaded nanogels. A faster rate of drug release and acid-induced hydrolysis into DOX resulted in a higher intracellular drug fluorescence intensity. The intracellular drug release and hydrolysis were further studied by flow cytometric analyses. As shown in Fig. 6, the flow cytometric histograms of GSH-OEt pretreated cells incubating with all drug-loaded nanogels shifted clearly to the direction of high fluorescence intensity compared with that of the control cells. In contrast, the weakest fluorescence intensity was shown in the cells pretreated with BSO. It was worth noting that the fluorescence intensities of cells incubated with the drug-loaded nanogel were in the following order: DOX-loaded nanogel > DAD-loaded nanogel > CAD-loaded nanogel > SAD-loaded nanogel, which confirmed the results of CLSM and the cellular uptakes of free drugs. The above results indicated that the pH and reduction dual-responsive nanogel was effective in intracellular drug delivery.
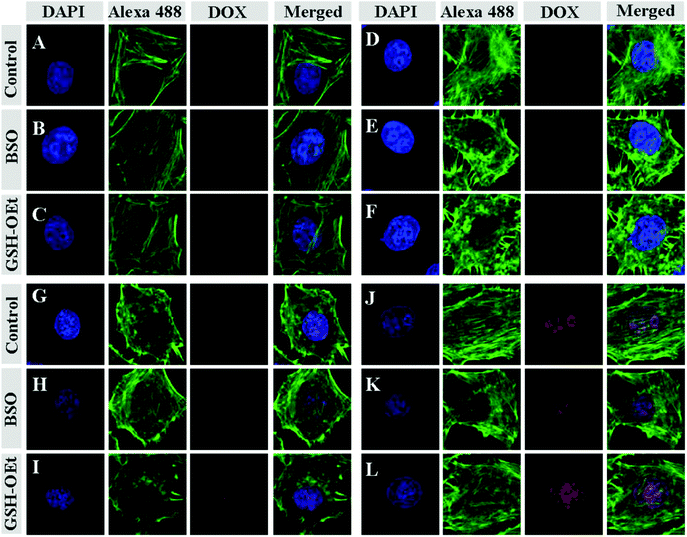 |
| | Fig. 5 CLSM microimages of HeLa cells incubated with SAD (A, B and C), CAD (D, E and F), DAD (G, H and I) and DOX-loaded nanogels (J, K and L): cells without pretreatment (A, D, G and J); cells pretreated with 0.5 mM BSO (B, E, H and K); cells pretreated with 10.0 mM GSH-OEt (C, F, I and L). For each panel, the microimages from left to right show cellular nuclei stained by DAPI (blue), F-actin stained by Alexa 488 (green), DOX fluorescence in cells (red) and the overlays of the three microimages. | |
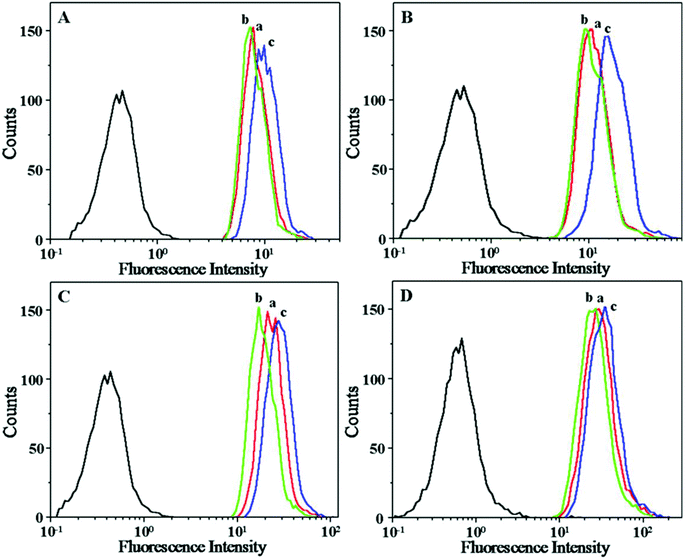 |
| | Fig. 6 Flow cytometric profiles of HeLa cells incubated with SAD (A), CAD (B), DAD (C) and DOX-loaded nanogels (D): cells without pretreatment (a), cells pretreated with 0.5 mM BSO (b) and cells pretreated with 10.0 mM GSH-OEt (c). | |
3.5
In vitro cellular proliferation inhibition of drugs and drug-loaded nanogels
The cytotoxicities of DOX and DOX derivatives to HeLa and HepG2 cells were evaluated using a MTT assay. As shown in Fig. 7, the DOX, and acid-sensitive CAD and DAD could efficiently inhibit cellular proliferation compared to acid-insensitive SAD in all test times (i.e. 24, 48 or 72 h). The abilities of CAD and DAD to inhibit cellular proliferation were found to be time-dependent. The viabilities of both HeLa and HepG2 cells incubated with CAD and DAD were obviously higher than that of DOX at 24 h, while close cellular proliferation efficacies of CAD and DAD to DOX were observed after 48 h. The hydrolysis process of CAD and DAD delayed the cellular proliferation inhibition because SAD, CAD and DAD themselves had low cytotoxicities. In addition, DAD exhibited a better cellular proliferation inhibition efficacy in contrast to CAD, attributed to faster hydrolysis of DAD into DOX. The half maximal inhibitory concentrations (IC50) of SAD, CAD, DAD and DOX are listed in Table S1, ESI.† They quantitatively verified the cellular proliferation inhibition ability of DOX and DOX derivatives.
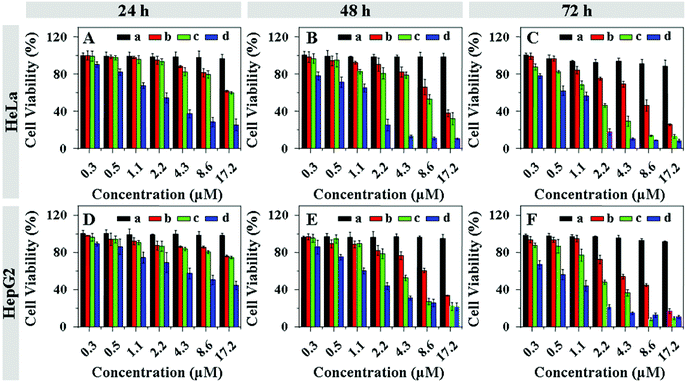 |
| | Fig. 7 Cell viabilities of HeLa (A, B and C) and HepG2 cells (D, E and F) incubated with SAD (a), CAD (b), DAD (c) and DOX (d) for 24 (A and D), 48 (B and E) and 72 h (C and F). Data are presented as a mean ± standard deviation (n = 6). | |
These data suggested that the chemical structure of DOX derivatives could influence its biological activity. DOX, as a DNA intercalator, limits the ability of topoisomerase II to reseal the DNA double helix strands during replication and thereby stops the reproduction of cells.1,25 The carbohydrate portion of DOX is involved in binding with the flanking base pairs of replicating DNA and the amine group should be freely available for interaction.23,24,26 Therefore, SAD, which contained a stable amide bond showed negligible biological activity. However, CAD and DAD exhibited higher biological activities similar to DOX because CAD and DAD could be hydrolyzed into DOX in acidic conditions.
The in vitro cellular proliferation inhibitions of drug-loaded nanogels against HeLa and HepG2 cells were also estimated by a MTT assay. Cells were pretreated with 0.5 mM BSO or 10.0 mM GSH-OEt for 12 and 2 h, respectively, and then incubated with the drug-loaded nanogels for 24, 48 or 72 h. The cells without pretreatment were used as control. It was noted that BSO and GSH-OEt at the used concentrations showed no cytotoxicities to both HeLa and HepG2 cells.37,49 In contrast to the control cells, the HeLa (Fig. 8) and HepG2 (Fig. 9) cells pretreated with BSO and GSH-OEt exhibited the lowest and highest cellular proliferation inhibition efficacies, respectively, after incubating with all drug-loaded nanogels for 24, 48 or 72 h. These results revealed that the faster drug release from drug-loaded nanogel was induced by both higher GSH concentration and lower pH in the cells, which enhanced the inhibition of cellular proliferation. Furthermore, the CAD and DAD-loaded nanogels showed a comparable anti-proliferative activity with DOX-loaded nanogels to both HeLa and HepG2 cells. However, the SAD-loaded nanogel almost could not inhibit the cellular proliferation. Similar to free drugs, the efficacies of CAD and DAD-loaded nanogels on cellular proliferation were also revealed to be time-dependent. After incubation for 24 h, the cellular proliferation inhibitions of CAD and DAD-loaded nanogels were evidently lower than that of DOX-loaded nanogels (Fig. 8 and 9). Nevertheless, the CAD and DAD-loaded nanogels exhibited a higher anti-proliferative activity after incubation for 72 h. Interestingly, CAD and DAD-loaded nanogels showed an improved cellular proliferation inhibition compared with the corresponding free drugs, while free DOX could inhibit the cellular proliferation more effectively than the DOX-loaded nanogel. This was because the presence of the nanogel enhanced the cellular internalization of CAD and DAD, but hindered the endocytosis of DOX. The IC50 of drug-loaded nanogels were listed in Table 2. In contrast to the control cells, the cells pretreated with BSO and GSH-OEt exhibited the highest and lowest IC50, respectively, for all the test durations. CAD and DAD-loaded nanogels exhibited a higher IC50 after incubation for 24 h, while they showed a lower IC50 after incubation for 72 h relative to the DOX-loaded nanogel. In addition, the loaded CAD and DAD exhibited a much lower IC50 than the corresponding free drugs. This quantitatively demonstrated the diversities of cellular proliferation inhibitions toward unpretreated and pretreated cells, confirmed the improved anti-proliferative activity of acid-sensitive DOX derivative-loaded nanogels and indicated the great potential of a combination of acid-sensitive DOX derivatives with pH and reduction dual-responsive nanogel.
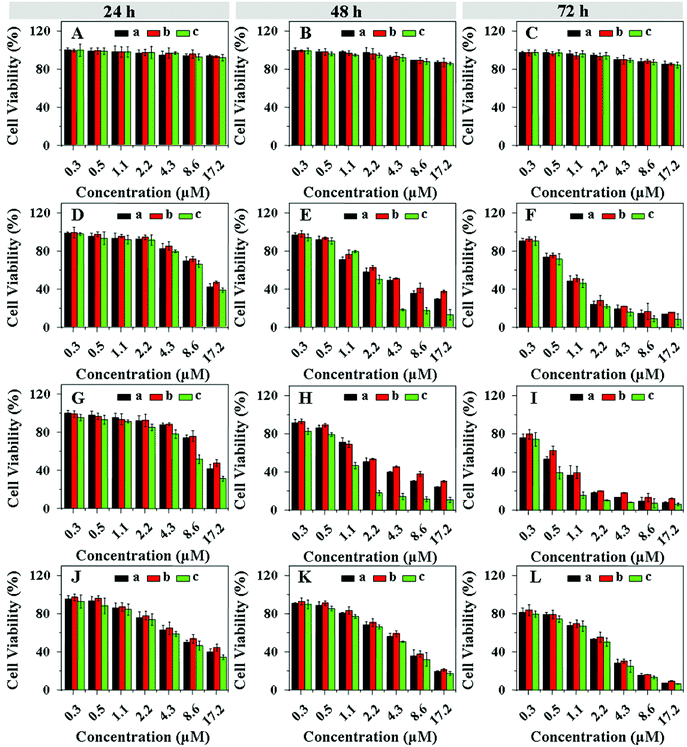 |
| | Fig. 8 Proliferation inhibitions towards HeLa cells incubated with SAD (A, B and C), CAD (D, E and F), DAD (G, H and I) and DOX-loaded nanogels (J, K and L) with various drug concentrations for 24 (A, D, G and J), 48 (B, E, H and K) and 72 (C, F, I and L) h. The cells were pretreated with 0.5 mM BSO (b) or 10.0 mM GSH-OEt (c). The unpretreated cells (a) were used as control. Data are presented as a mean ± standard deviation (n = 6). | |
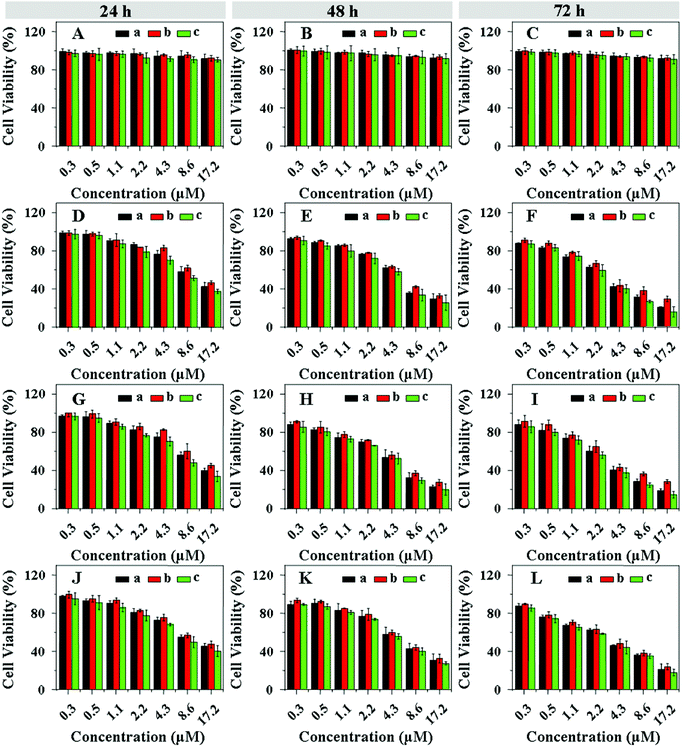 |
| | Fig. 9 Proliferation inhibitions towards HepG2 cells incubated with SAD (A, B and C), CAD (D, E and F), DAD (G, H and I) and DOX-loaded nanogels (J, K and L) with various drug concentrations for 24 (A, D, G and J), 48 (B, E, H and K) and 72 (C, F, I and L) h. The cells were pretreated with 0.5 mM BSO (b) or 10.0 mM GSH-OEt (c). The unpretreated cells (a) were used as control. Data are presented as a mean ± standard deviation (n = 6). | |
Table 2 IC50 values of SAD, CAD, DAD and DOX-loaded nanogels after incubation against unpretreated and pretreated HeLa and HepG2 cells for 24, 48 and 72 h
| Cell |
Drug |
24 h (μM) |
48 h (μM) |
72 h (μM) |
| |
|
Control |
BSO |
GSH-OEt |
Control |
BSO |
GSH-OEt |
Control |
BSO |
GSH-OEt |
| HeLa |
SAD |
— |
— |
— |
— |
— |
— |
— |
— |
— |
|
|
CAD |
14.56 |
16.21 |
13.29 |
2.29 |
4.41 |
2.79 |
1.03 |
1.15 |
0.96 |
|
|
DAD |
14.32 |
15.87 |
8.67 |
2.36 |
3.29 |
1.17 |
0.71 |
0.83 |
0.52 |
|
|
DOX |
8.81 |
11.03 |
7.09 |
4.83 |
5.46 |
4.04 |
2.47 |
2.68 |
2.30 |
| HepG2 |
SAD |
— |
— |
— |
— |
— |
— |
— |
— |
— |
|
|
CAD |
12.36 |
14.56 |
9.58 |
6.41 |
7.34 |
5.72 |
3.74 |
4.15 |
3.24 |
|
|
DAD |
11.13 |
13.51 |
8.64 |
5.45 |
6.17 |
5.05 |
3.29 |
3.93 |
2.77 |
|
|
DOX |
11.34 |
12.88 |
8.71 |
5.29 |
6.31 |
5.22 |
3.89 |
4.29 |
3.38 |
4 Conclusions
Acid-insensitive SAD, and acid-sensitive CAD and DAD were prepared by decorating DOX with SA, CA and DA, respectively. The pH and reduction dual-responsive mPEG-P(LL-co-LC) nanogel was employed to load the DOX derivatives through electrostatic attraction effectively. In vitro drug release from the drug-loaded nanogels could be accelerated in mimicking intracellular acidic and reductive conditions. The chemical structure of the DOX derivative was the decisive factor of its biological activity. Both the cellular internalization and proliferation inhibition efficacy of DOX derivatives were in the order DAD > CAD > SAD. Drug-loaded nanogels exhibit a faster drug release behavior in GSH-OEt pretreated HeLa cells than in unpretreated or BSO pretreated cells. Moreover, the CAD and DAD-loaded nanogels exhibited a higher anti-proliferative activity than DOX-loaded nanogel after incubation for 72 h, while free CAD and DAD showed lower cytotoxicities toward both HeLa and HepG2 cells in contrast to free DOX for all the test duration. Excellent biocompatibility and a smart intracellular microenvironment responsiveness of the nanogel, reduced toxicity and tunable sensitivity of the DOX derivatives, and an improved anticancer efficacy endowed the combination of DOX derivatives and nanogel with a great potential for cancer chemotherapy.
Acknowledgements
This research was financially supported by the National Natural Science Foundation of China (Projects 51233004, 51273196, 51273037, 51203153, 51273080, 51103015, 51021003 and 20904053), Jilin Science and Technology Bureau (International Cooperation Project 20120729) and Jilin Human Resources and Social Security Bureau (201125020).
Notes and references
- L. P. Swift, A. Rephaeli, A. Nudelman, D. R. Phillips and S. M. Cutts, Cancer Res., 2006, 66, 4863–4871 CrossRef CAS.
- B. Vincenzi, A. M. Frezza, D. Santini and G. Tonini, Expert Opin. Emerging Drugs, 2010, 15, 237–248 CrossRef CAS.
- G. N. Hortobágyi, Drugs, 1997, 54(Supplement 4), 1–7 CrossRef.
- Y. Octavia, C. G. Tocchetti, K. L. Gabrielson, S. Janssens, H. J. Crijns and A. L. Moens, J. Mol. Cell. Cardiol., 2012, 52, 1213–1225 CrossRef CAS.
- J. C. Zhang, J. X. Ding, C. S. Xiao, C. L. He, X. L. Zhuang, Y. N. Yang and X. S. Chen, Chem. J. Chin. Univ., 2012, 22, 2809–2815 Search PubMed.
- H. Cui, Z. Chen, S. Zhong, K. L. Wooley and D. J. Pochan, Science, 2007, 317, 647–650 CrossRef CAS.
- K. Wang, G. F. Luo, Y. Liu, C. Li, S. X. Cheng, R. X. Zhuo and X. Z. Zhang, Polym. Chem., 2012, 3, 1084–1090 RSC.
- C. Y. Zhang, Y. Q. Yang, T. X. Huang, B. Zhao, X. D. Guo, J. F. Wang and L. J. Zhang, Biomaterials, 2012, 33, 6273–6283 CrossRef CAS.
- J. Ding, J. Chen, D. Li, C. Xiao, J. Zhang, C. He, X. Zhuang and X. Chen, J. Mater. Chem. B, 2013, 1, 69–81 RSC.
- J. Ding, C. He, C. Xiao, J. Chen, X. Zhuang and X. Chen, Macromol. Res., 2012, 20, 292–301 CrossRef CAS.
- C. Y. Long, M. M. Sheng, B. He, Y. Wu, G. Wang and Z. W. Gu, Chin. J. Polym. Sci., 2012, 30, 387–396 CrossRef CAS.
- S. H. Yuk, K. S. Oh, H. Koo, H. Jeon, K. Kim and I. C. Kwon, Biomaterials, 2011, 32, 7924–7931 CrossRef CAS.
- X. Yang, J. J. Grailer, I. J. Rowland, A. Javadi, S. A. Hurley, V. Z. Matson, D. A. Steeber and S. Gong, ACS Nano, 2010, 4, 6805–6817 CrossRef CAS.
- J. Ding, C. Xiao, C. He, M. Li, D. Li, X. Zhuang and X. Chen, Nanotechnology, 2011, 22, 494012 CrossRef.
- J. Ding, C. Xiao, X. Zhuang, C. He and X. Chen, Mater. Lett., 2012, 73, 17–20 CrossRef CAS.
- Y. Du, W. Chen, M. Zheng, F. Meng and Z. Zhong, Biomaterials, 2012, 33, 7291–7299 CrossRef CAS.
- A. Bochot and E. Fattal, J. Controlled Release, 2012, 161, 628–634 CrossRef CAS.
- R. T. Chacko, J. Ventura, J. Zhuang and S. Thayumanavan, Adv. Drug Delivery Rev., 2012, 64, 836–851 CrossRef CAS.
- Y. Y. Yuan, J. Z. Du, W. J. Song, F. Wang, X. Z. Yang, M. H. Xiong and J. Wang, J. Mater. Chem., 2012, 22, 9322–9329 RSC.
- J. K. Oh, R. Drumright, D. J. Siegwart and K. Matyjaszewski, Prog. Polym. Sci., 2008, 33, 448–477 CrossRef CAS.
- B. S. Chhikara and K. Parang, Expert Opin. Drug Delivery, 2010, 7, 1399–1414 CrossRef CAS.
- S. Ibsen, E. Zahavy, W. Wrasdilo, M. Berns, M. Chan and S. Esener, Pharm. Res., 2010, 27, 1848–1860 CrossRef CAS.
- B. S. Chhikara, D. Mandal and K. Parang, J. Med. Chem., 2012, 55, 1500–1510 CrossRef CAS.
- K. X. Chen, N. Gresh and B. Pullman, Mol. Pharm., 1986, 30, 279–286 CAS.
- D. J. Patel, S. A. Kozlowski and J. A. Rice, Proc. Natl. Acad. Sci. U. S. A., 1981, 78, 3333–3337 CrossRef CAS.
- B. S. Chhikara, N. St. Jean, D. Mandal, A. Kumar and K. Parang, Eur. J. Med. Chem., 2011, 46, 2037–2042 CrossRef CAS.
- J. A. Hubbell and A. Chilkoti, Science, 2012, 337, 303–305 CrossRef.
- L. Zha, B. Banik and F. Alexis, Soft Matter, 2011, 7, 5908–5916 RSC.
- M. M. Yallapu, M. Jaggi and S. C. Chauhan, Drug Discovery Today, 2011, 16, 457–463 CrossRef CAS.
- D. Roy, J. N. Cambre and B. S. Sumerlin, Prog. Polym. Sci., 2010, 35, 278–301 CrossRef CAS.
- H. Wen, C. Dong, H. Dong, A. Shen, W. Xia, X. Cai, Y. Song, X. Li, Y. Li and D. Shi, Small, 2012, 8, 760–769 CrossRef CAS.
- J. Ding, C. Xiao, L. Yan, Z. Tang, X. Zhuang, X. Chen and X. Jing, J. Controlled Release, 2011, 152(Suppl 1), E11–E13 CrossRef CAS.
- Y. J. Pan, Y. Y. Chen, D. R. Wang, C. Wei, J. Guo, D. R. Lu, C. C. Chu and C. C. Wang, Biomaterials, 2012, 33, 6570–6579 CrossRef CAS.
- J. Z. Du, T. M. Sun, W. J. Song, J. Wu and J. Wang, Angew. Chem., Int. Ed., 2010, 49, 3621–3626 CrossRef CAS.
- F. Meng, W. E. Hennink and Z. Zhong, Biomaterials, 2009, 30, 2180–2198 CrossRef CAS.
- A. Russo, W. DeGraff, N. Friedman and J. B. Mitchell, Cancer Res., 1986, 46, 2845–2848 CAS.
- F. Shi, J. Ding, C. Xiao, X. Zhuang, C. He, L. Chen and X. Chen, J. Mater. Chem., 2012, 22, 14168–14179 RSC.
- J. Ding, F. Shi, C. Xiao, L. Lin, L. Chen, C. He, X. Zhuang and X. Chen, Polym. Chem., 2011, 2, 2857–2864 RSC.
- M. S. Thompson, T. P. Vadala, M. L. Vadala, Y. Lin and J. S. Riffle, Polymer, 2008, 49, 345–373 CrossRef CAS.
- S. Zhu, M. Hong, G. Tang, L. Qian, J. Lin, Y. Jiang and Y. Pei, Biomaterials, 2010, 31, 1360–1371 CrossRef CAS.
- P. Chytil, T. Etrych, Č. Koňák, M. Šírová, T. Mrkvan, B. Říhová and K. Ulbrich, J. Controlled Release, 2006, 115, 26–36 CrossRef CAS.
- Y. Luo, N. J. Bernshaw, Z. R. Lu, J. Kopecek and G. D. Prestwich, Pharm. Res., 2002, 19, 396–402 CrossRef CAS.
- D. A. Mbeh, R. Franca, Y. Merhi, X. F. Zhang, T. Veres, E. Sacher and L. Yahia, J. Biomed. Mater. Res., Part A, 2012, 100, 1637–1646 CrossRef CAS.
- H. Maeda, J. Wu, T. Sawa, Y. Matsumura and K. Hori, J. Controlled Release, 2000, 65, 271–284 CrossRef CAS.
- Z. Zhou, Y. Shen, J. Tang, M. Fan, E. A. Van Kirk, W. J. Murdoch and M. Radosz, Adv. Funct. Mater., 2009, 19, 3580–3589 CrossRef CAS.
- Y. Lee, S. Fukushima, Y. Bae, S. Hiki, T. Ishii and K. Kataoka, J. Am. Chem. Soc., 2007, 129, 5362–5363 CrossRef CAS.
- Y. Lee, T. Ishii, H. Cabral, H. J. Kim, J. H. Seo, N. Nishiyama, H. Oshima, K. Osada and K. Kataoka, Angew. Chem., Int. Ed., 2009, 48, 5309–5312 CrossRef CAS.
- L. Y. Tang, Y. C. Wang, Y. Li, J. Z. Du and J. Wang, Bioconjugate Chem., 2009, 20, 1095–1099 CrossRef CAS.
- J. Liu, Y. Pang, W. Huang, Z. Zhu, X. Zhu, Y. Zhou and D. Yan, Biomacromolecules, 2011, 12, 2407–2415 CrossRef CAS.
Footnotes |
| † Electronic supplementary information (ESI) available. See DOI: 10.1039/c3bm60024f |
| ‡ These authors contributed equally to this work. |
|
| This journal is © The Royal Society of Chemistry 2013 |
![[thin space (1/6-em)]](https://www.rsc.org/images/entities/char_2009.gif) :
:![[thin space (1/6-em)]](https://www.rsc.org/images/entities/char_2009.gif) 36
36![[thin space (1/6-em)]](https://www.rsc.org/images/entities/char_2009.gif) :
:![[thin space (1/6-em)]](https://www.rsc.org/images/entities/char_2009.gif) 9 based on the result of elemental analyses. mPEG-P(LL-co-LC) was synthesized by removing the benzyloxycarbonyl group from mPEG-P(ZLL-co-LC). Briefly, the mPEG-P(ZLL-co-LC) copolymer was dissolved in TFA at a concentration of 100.0 g L−1, and hydrobromic acid–acetic acid (33 wt%) was then added (3.0 mL for 1.0 g copolymer). After stirring for 30 min at 25 °C, the mixture was precipitated into excess diethyl ether. The obtained product was further washed twice with diethyl ether and dried in vacuo at room temperature for 24 h (yield: 86.3%). The molar ratio of mPEG–LL–LC was calculated to be 1
9 based on the result of elemental analyses. mPEG-P(LL-co-LC) was synthesized by removing the benzyloxycarbonyl group from mPEG-P(ZLL-co-LC). Briefly, the mPEG-P(ZLL-co-LC) copolymer was dissolved in TFA at a concentration of 100.0 g L−1, and hydrobromic acid–acetic acid (33 wt%) was then added (3.0 mL for 1.0 g copolymer). After stirring for 30 min at 25 °C, the mixture was precipitated into excess diethyl ether. The obtained product was further washed twice with diethyl ether and dried in vacuo at room temperature for 24 h (yield: 86.3%). The molar ratio of mPEG–LL–LC was calculated to be 1![[thin space (1/6-em)]](https://www.rsc.org/images/entities/char_2009.gif) :
:![[thin space (1/6-em)]](https://www.rsc.org/images/entities/char_2009.gif) 34
34![[thin space (1/6-em)]](https://www.rsc.org/images/entities/char_2009.gif) :
:![[thin space (1/6-em)]](https://www.rsc.org/images/entities/char_2009.gif) 7 based on the result of elemental analyses. The pH and reduction dual-responsive mPEG-P(LL-co-LC) nanogel was prepared by directly dispersing the resultant copolymer in phosphate buffered solution (PBS).
7 based on the result of elemental analyses. The pH and reduction dual-responsive mPEG-P(LL-co-LC) nanogel was prepared by directly dispersing the resultant copolymer in phosphate buffered solution (PBS).

![[thin space (1/6-em)]](https://www.rsc.org/images/entities/char_2009.gif) 000 rpm for 16 min to precipitate the protein-adsorbed nanogel. The BSA concentration of the supernatant was determined using UV-vis spectroscopy by measuring the maximal absorbance at 280 nm. Then, the amount of BSA adsorbed on the nanogel was calculated against a standard calibration curve. mPEG with a molecular weight of 5000 (mPEG5k) and branched polyethylenimine with a molecular weight of 25
000 rpm for 16 min to precipitate the protein-adsorbed nanogel. The BSA concentration of the supernatant was determined using UV-vis spectroscopy by measuring the maximal absorbance at 280 nm. Then, the amount of BSA adsorbed on the nanogel was calculated against a standard calibration curve. mPEG with a molecular weight of 5000 (mPEG5k) and branched polyethylenimine with a molecular weight of 25![[thin space (1/6-em)]](https://www.rsc.org/images/entities/char_2009.gif) 000 (PEI25k) were used as negative and positive controls, respectively.
000 (PEI25k) were used as negative and positive controls, respectively.


