First principles high throughput screening of oxynitrides for water-splitting photocatalysts
Yabi
Wu
a,
Predrag
Lazic
a,
Geoffroy
Hautier†
a,
Kristin
Persson
b and
Gerbrand
Ceder
*a
aDepartment of Materials Science and Engineering Massachusetts Institute of Technology, Cambridge, Massachusetts 02139, USA
bLawrence Berkeley National Laboratory, 1 Cyclotron Rd, Berkeley, California 94720, USA
First published on 30th October 2012
Abstract
In this paper, we present a first principles high throughput screening system to search for new water-splitting photocatalysts. We use the approach to screen through nitrides and oxynitrides. Most of the known photocatalytic materials in the screened chemical space are reproduced. In addition, sixteen new materials are suggested by the screening approach as promising photocatalysts, including three binary nitrides, two ternary oxynitrides and eleven quaternary oxynitrides.
Broader contextWater-splitting photocatalysis directly converts the solar energy to chemical energy and is involved in many applications in energy and environmental science. Finding novel photocatalytic materials that are stable, efficient, and capable of being visible light driven is the primary objective in this field. In this paper, we present a recently finished first principles high throughput screening to identify nitride and oxynitride candidate compounds as novel water-splitting photocatalysts. 68 nitrides, 1503 ternary oxynitrides and 1377 quaternary oxynitrides are screened based on their properties of phase stability, band gap and band edge positions. Most of the known photocatalytic materials in the screened chemical space are reproduced. In addition, sixteen new materials, including three binary nitrides, two ternary oxynitrides and eleven quaternary oxynitrides, are identified as promising water-splitting photocatalysts. They are predicted to be synthesizable, suitable for visible light (or UV light) absorption, and energetically favorable to catalyze the water-splitting reaction. Three of these sixteen candidates, Ti3O3N2, La2TiO2N2 and Li5MoO4N, have potentials to exhibit better photocatalytic performance than the best oxynitride photocatalysts known today. |
I Introduction
Since the discovery of the first photocatalytic water splitting system based on TiO2 and Pt in 1972 by Fujishima and Honda,1,2 the photocatalysis of water splitting has become an active research area and a promising way to capture and store energy from the Sun. More than 130 inorganic materials have been demonstrated to exhibit such photocatalytic performance.3 However, the overall efficiency of current water-splitting photocatalytic devices is still well below a commercially viable level.3 The primary objective in the field is to find new materials with higher efficiency.High throughput computational screening whereby one computationally assesses key properties of a large number of compounds for a given application has shown its merit in many fields, such as the design of new battery materials,4–7 thermoelectric materials,8,9 piezoelectric materials,10 and organic photovoltaic materials.11–13 The development of ab initio property prediction methods and their automation make it possible to examine thousands of material candidates for a few desired properties.14,15
In this paper, we screen compounds using high throughput computational methods by focusing on three significant properties of water-splitting photocatalysts: (1) the crystal structure and its thermodynamic phase stability (versus competing solids and gases); (2) the band gap; (3) the conduction band (CB) and valence band (VB) edge positions relative to the H2/H2O and O2/H2O levels in water. For each property, a first principles computational method has been developed which has a low enough computational cost but an adequate accuracy so that it can be used in a high throughput search. By integrating them, we thus design a 3-tier high throughput screening system as follows: (a) a phase stability screening to eliminate candidate compounds which are not stable enough to be synthesizable; (b) a band gap screening to eliminate all candidates with a too large or too small band gap; (c) a screening of band edge position in aqueous environment to eliminate candidates whose CB or VB position is not suitable for water splitting. The details of the screening system are introduced in Section II.
We choose oxynitrides as the major chemical space to implement the screening system in this work. So far, most of the existing photocatalysts are oxides.3 However, the band gaps of oxides are usually too large to absorb visible light.3,16 This is mainly due to a too low VB energy which is derived from the 2p orbitals of the oxygen atoms.16 To solve this problem, non-oxides such as nitrides and sulfides have been proposed, since their VB position is usually higher in energy. Unfortunately, nitrides usually suffer from poor aqueous stability,17 and cannot maintain photocatalytic activity in water over a long period of time. As a result, oxynitrides have been lately proposed16 as a balance between band gap reduction and aqueous stability.
In this paper, we screened 2948 different candidate compounds including 68 binary nitrides, 1503 ternary oxynitrides and 1377 quaternary oxynitrides. Our algorithm picked out most of the known water-splitting photocatalysts and also found 16 new promising candidates. Some new candidates are existing materials from the Inorganic Crystal Structure Database (ICSD)18 but have not been reported as photocatalysts yet. And some candidates are unknown compounds which are predicted by our compound prediction tool.19 The detailed results are shown in Section III.
Very recently, Castelli et al. computationally screened perovskite metal oxides and identified some new candidates for photocatalysts.20 The major differences between theirs and our screening approach are the following: (a) Castelli et al. predicted the CB and VB positions by empirically estimating the middle of the gap using electronegativity of the atoms while we compute them directly from first principles in an aqueous environment; (b) they mainly focused on perovskite metal oxides while we mainly focus on oxynitrides, and we consider a wider range of structures.
II Method
Fig. 1 illustrates the high throughput screening approach presented in this paper. All computations are based on density functional theory (DFT)21,22 and are performed with projector augmented wave (PAW)23 potentials using the plane-wave code Vienna Ab initio Simulation Package (VASP).24,25 For computations in steps 1 and 2 in Fig. 1, we use the Perdew–Burke–Ernzerhof (PBE)26 GGA+U exchange-correlation functional unless specified otherwise, with all parameters as in Jain et al.14 For computations in step 3, we use PBE GGA with all parameters as described in ref. 27.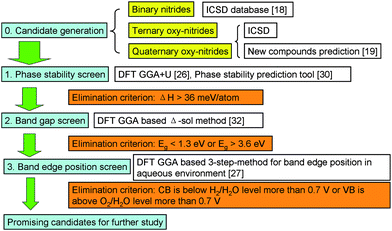 | ||
| Fig. 1 High throughput screening approach for water-splitting photocatalysts. | ||
0 Generation of the candidates
In this step, we generate the candidate compounds for screening. As most known oxide photocatalysts contain d10 or d0 cations,3,16 we target primarily oxynitrides and only consider compounds that contain d10 cations (Ga3+, In3+, Ge4+, Sn4+, Sb5+, and Bi5+) or d0 cations (Ti4+, Zr4+, Hf4+, V5+, Nb5+, Ta5+, Cr6+, Mo6+, W6+, Sc3+, and Y3+).One of the most complete databases of experimentally observed compounds is the ICSD.18 However, there are very few oxynitrides available in the ICSD. For example, there are only 25 ternary oxynitrides and 118 quaternary oxynitrides which contain d10 or d0 cations in the ICSD. Therefore, we use compound and structure prediction tools19 to identify possible novel compounds. Since the oxynitrides space has not been as exhaustively searched with experiments as other chemistries (e.g. oxides), it is likely that there are a large number of novel compounds to be found. We used a previously developed approach based on ionic substitutions to propose new likely ternary and quaternary oxynitrides.19 This approach uses information about the substitution probability of ions – obtained by data-mining all known crystalline compounds – to come up with suggestions for the design of novel compounds.
To generate novel ternary oxynitrides (M–O–N, with M being a d0 or d10 cation), we used the set of all known binary ionic compounds as a starting point. Using the substitution algorithm from ref. 19, we evaluated the likelihood that substituting the cation in each compound by M and the anion in the compound by a mixture of O and N would lead to a new stable compound. For instance, the algorithm suggested that the known Ta3N5 could have its cation Ta5+ substituted by Zr4+ and its anion N3− by a mixture of O2− and N3−.
To generate new quaternary compounds (M1–M2–O–N with M1 or M2 being a d0 or d10 cation), we only considered a list of known ternary oxide photocatalysts in ref. 3 as the structural framework on which to perform the substitutions. For instance, SrTiO3 could lead to a new candidate from substituting Sr2+ by La3+, Ti4+ by Ta5+, and O2− by a mixture of N3− and O2− according to the probabilistic model in ref. 19.
The amount of O and N to be substituted in each compound was determined by balancing the charge of the cations. There is however still a remaining degree of freedom in the exact ordering of O2− and N3− on the anion sites. We enumerated the different O2−–N3− orderings by using an algorithm similar to the one developed by Hart and Forcade28 and selected the ones leading to the smaller cells and the larger number of N–N bonds, as the ordering of oxynitride anions has been recently shown to be driven by this factor.29 For each candidate compound, we computed with DFT all selected orderings and only considered the one with lowest energy. It is worth noting that each possible compound also had to pass the stability screen in its relevant composition space (step 1 in Fig. 1) in order to be considered further.
Besides the oxynitrides, we included all binary nitrides M–N with M being a transition metal or semi-metal cation from the ICSD into the screening as well. Thus, in sum, we prepared 3 batches of candidate compounds, binary nitrides (M–N), ternary oxynitrides (M–O–N) and quaternary oxynitrides (M1–M2–O–N).
1 Phase stability screening
Phase stability is an essential component of high-throughput materials discovery as new proposed candidates need to be stable enough to be synthesizable. To assess if a compound is stable at zero K, we compared its energy versus the energy of other phases or their linear combinations. This can be technically achieved through the convex hull construction.30 Not only does the convex hull construction indicate if a compound is stable versus competing phases but this construction can also be used to assess how unstable a compound is. Therefore, we define the instability energy ΔH, in meV per atom, as the negative of the decomposition reaction energy to the stable phases. Stable compounds have an instability energy ΔH equal to zero and the larger the instability energy ΔH, the less stable the material is.We performed this stability analysis for all compounds considered in this work. The possible competing phases were mainly obtained from the ICSD.18 More details on the parameters used for the computations can be found in Jain et al.14 In addition, we used a recently developed scheme to mix GGA and GGA+U computations31 as computations of oxides and oxynitrides are usually performed with GGA+U while all nitrides have been computed with GGA.
In this screening, we eliminated all compounds with an instability energy ΔH larger than 36 meV per atom. We obtained this threshold energy by doing a brief analysis of the instability energy of compounds in the ICSD. We find that more than 80% of the ICSD compounds have an “instability energy ΔH” less than 36 meV per atom. Since the “ICSD compounds” have, in principle, all been synthesized, we consider this threshold to be reasonable to find compounds that can be made.
2 Band gap screening
In this step, we compute the band gap of the remaining candidates and eliminate those with unsuitable band gaps. Since the band gap computed from Kohn–Sham levels is usually lower than the experimental band gap by 30–100%,32 this approach cannot be used for band gap screening. Alternatively, we use the Δ-sol method32 to determine the gaps. The Δ-sol method, motivated by the dielectric screening properties of the homogeneous electron gas, determines the fundamental gap from DFT total energies of systems with an electron or a hole added within the screening radius of the material. Unreliable Kohn–Sham levels are not involved in the determination of the gap, and gross underestimation of band gaps is avoided. When tested across a large number of compounds with diverse chemistries, the Δ-sol method gave a mean absolute error of 0.2 eV for the gap.32 In addition, the method requires three DFT total energy computations so it is acceptable in terms of computational cost. More detailed information is available in ref. 32.In this screening step, we eliminate all candidates with band gaps lower than 1.3 eV or higher than 3.6 eV. The theoretical lower limit of the band gap for a water-splitting photocatalyst is 1.23 eV,3 but an over-potential of 0.25 eV or more is usually required.33,34 Therefore, the lowest possible band gap in practice is around 1.5 eV. We further take the mean error of the Δ-sol method, around 0.2 eV, into account and finally set the lower threshold to 1.3 eV. The upper threshold is more flexible. For visible light absorption, 2.7 eV could be a good upper limit. However, we extend the upper limit to 3.6 eV to also capture any interesting oxynitride materials that absorb outside the visible light region.
3 Screening of band edge positions in aqueous environment
In this step, we compute the CB and VB band edge positions in aqueous environment and compare them with the H2/H2O and O2/H2O levels in water. We used an earlier developed 3-step method which is reported in ref. 27. In this method, the relevant energy levels (e.g. the CB of the semiconductor and the H2/H2O level in water) at the interface are considered as the corresponding bulk energy levels subjected to the interfacial band bending effect. Ref. 27 demonstrates that, for calculating the relative position between the CB and H2/H2O level at the interface, it is sufficient to separately compute the following three properties: the semiconductor's CB position relative to its Hartree potential; the H2/H2O level relative to water's Hartree potential; and the Hartree potential difference between the semiconductor and water in an aqueous environment. When tested on six typical photocatalysts, the method gave a mean absolute error of 0.19 eV for the band edge positions. More detailed information is available in ref. 27. Once we obtain the CB position relative to the H2/H2O level in water, it is straightforward to obtain the VB position relative to the O2/H2O level since the band gap has been computed in the previous step.The photocatalytic water-splitting process is energetically favorable only if the CB is higher than the H2/H2O level and the VB is lower than the O2/H2O level. (Here and throughout this paper, “higher” always refers to more negative in the Normal Hydrogen Electrode reference while “lower” always refers to more positive in the NHE reference.) If this is not the case, then an external bias voltage is required to shift the bands to the right positions. However, applying an external bias voltage increases the complexity of the device and more importantly requires energy input to the device thus reducing the efficiency. As a result, too large a bias voltage should be avoided. We set the threshold of the allowed bias voltage as 0.7 V and eliminate all candidates whose CB is 0.7 eV lower than the H2/H2O level or whose VB is 0.7 eV higher than the O2/H2O level in water as shown in Fig. 2.
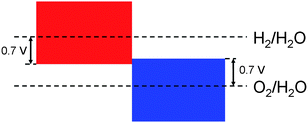 | ||
| Fig. 2 Allowed CB and VB positions. The red shaded area represents the allowed CB positions while the blue shaded area represents the allowed VB positions. | ||
III Results
1 Binary nitrides
We screened 68 different binary nitrides M–N where M consists of all transition metal elements and semi-metal elements. Since all the candidate compounds are obtained from the ICSD, we assume them to be synthesizable, so we do not present the results of their phase stability here. We find that 23 binary nitrides have a gap between 1.3 eV and 3.6 eV. These gaps and some experimental gap data (if available) are shown in Fig. 3. There is generally good agreement between computational band gaps and experimental band gaps.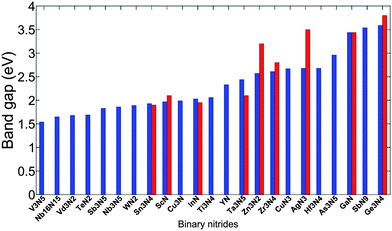 | ||
| Fig. 3 Binary metal nitrides from the ISCD with a calculated band gap between 1.5 eV and 3.6 eV. The blue bars are computational band gaps while the red bars are experimental band gaps (if available). The experimental band gaps are collected from ref. 16 and 35–43. | ||
For the 23 compounds with a suitable band gap, the band edge positions are calculated. All candidates not satisfying the band position criteria indicated in Fig. 2 are eliminated. The remaining candidates and their band levels are shown in Table 1.
| Material | Band gap (eV) | CB vs. H2/H2O (eV) | VB vs. O2/H2O (eV) |
|---|---|---|---|
| a In the column of “CB vs. H2/H2O” and “VB vs. O2/H2O”, the number indicates how much the band edge is higher (more negative in the NHE reference) than the corresponding water level. Therefore, a positive number in the “CB vs. H2/H2O” column and a negative number in the “VB vs. O2/H2O” column is the optimum case as that indicates that the CB and VB are bracketing the water redox levels and no bias voltage is needed. | |||
| GaN | 3.49 | −0.26 | −2.63 |
| Ge3N4 | 3.59 | −0.31 | −2.67 |
| Ta3N5 | 2.37 | 0.66 (0.40 in exp) | −0.49 (−0.37 in exp) |
| Cu3N | 1.99 | −0.31 | −1.06 |
| AgN3 | 2.68 | 0.48 | −0.97 |
| Zr3N4 | 2.61 | −0.58 | −1.96 |
The first three nitrides in Table 1, GaN, Ge3N4 and Ta3N5, are known as water-splitting photocatalysts.17,44,45 Only for Ta3N5 the band edge positions have been experimentally measured,16 and these values are included in Table 1 for comparison. Cu3N, AgN3, and Zr3N4 are known compounds but have not been reported as photocatalysts yet. We plot their band positions relative to the water redox levels in Fig. 4.
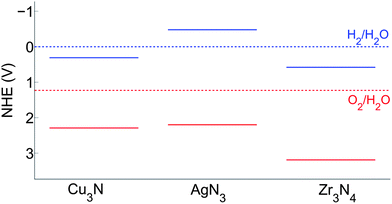 | ||
| Fig. 4 Band edge positions of Cu3N, AgN3, and Zr3N4 in the normal hydrogen electrode (NHE) reference. The solid blue lines indicate the CB levels and the solid red lines indicate the VB levels. | ||
Fig. 4 suggests that AgN3 has its CB and VB bracketing the water redox levels, and thus may achieve water-splitting without an external bias voltage. However, its band gap, predicted to be 2.68 eV and experimentally measured as 3.5 eV, is suitable to absorb only UV light. Cu3N has a VB lower than the O2/H2O level in water but its CB is 0.31 V lower than the H2/H2O level in water too. This indicates that H2 evolution cannot be photo-catalyzed without applying an external bias voltage of at least 0.3 V. However, the band gap of Cu3N, predicted to be 1.99 eV, is relatively small. This may provide enough optimization room to increase the CB while still retaining a reasonable gap. Similar to Cu3N, Zr3N4 also has a too low CB and may need a bias voltage to photo-catalyze H2 evolution. However, unlike Cu3N, the band gap of Zr3N4, predicted to be 2.61 eV, is already relatively large and provides little optimization room to increase the CB. As a result, Zr3N4 is likely to be less efficient as a visible light driven photocatalyst.
Our screening of the binary nitrides reproduced three known binary photocatalysts, Ta3N5, GaN, and Ge3N4. In addition, we identified three known compounds as new candidates: Cu3N, AgN3, and Zr3N4. Cu3N has the potential to be an efficient visible light driven photocatalyst, while AgN3 and Zr3N4 are more likely to work under UV illumination.
2 Ternary oxynitrides
In this section, we screened 1503 different ternary oxynitrides, M–O–N, where M is one of the d0 or d10 cations mentioned in Section II. The calculated phase stability of these compounds is shown in Fig. 5. As most of these compounds are computationally designed, it is not surprising that many of them are not stable as indicated by their large ΔH for decomposition in Fig. 5(a).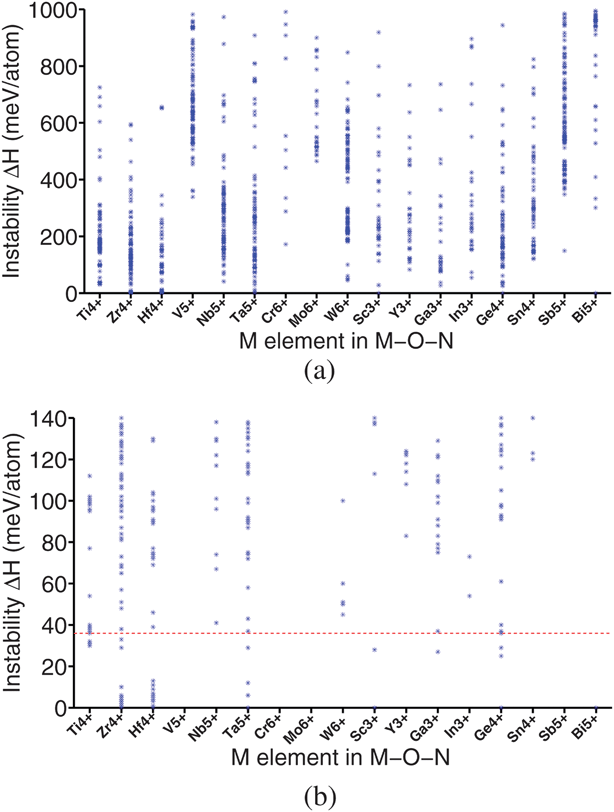 | ||
| Fig. 5 Phase stability of ternary oxynitrides. Each point represents a different compound. The instability energy ΔH is defined in Section II. Larger ΔH indicates a larger instability. (a) All candidate compounds whose ΔH is less than 1000 meV per atom. (b) An enlarged version of (a) focusing on the stable and quasi-stable candidates region. The red dashed line in (b) represents the elimination criterion of this step, 36 meV per atom. All candidates above the red line were eliminated. | ||
Fig. 5 indicates that all ternary oxynitrides consisting of V5+, Cr6+, Mo6+, or Sb5+ are very unstable. This may be explained by the limited oxidation power of nitrogen gas. Support for this interpretation is the fact that there are no stable binary nitrides for V5+, Cr6+, Mo6+, and Sb5+ in the ICSD. Moreover, we will show in Section IV that the required oxidizing power for these four cations is indeed the highest among all cations listed in Fig. 5. Fig. 5 also suggests that the majority of the stable and quasi-stable ternary oxynitrides are obtained with Ti4+, Zr4+, Hf4+, Ta5+, Ga3+, and Ge4+ which are much easier to oxidize.
After further screening of band gap and band edge positions, four ternary oxynitrides, TaON, Zr2ON2, Zr3O3N2, and Ti3O3N2, are identified as photocatalysts as shown in Table 2. Among the four ternary oxynitrides, TaON is a well known water-splitting photocatalyst.16 Its band edge positions have been experimentally measured16 and are given in Table 2 for comparison. Zr2ON2, while not present in the ICSD, has been reported as a promising material for photo-electrochemical water-splitting.46 And the reported bixbyite structure for this compound is the same as our prediction, showing some validity of our structure prediction approach.
| Material | Reported/new | ΔH (meV per atom) | Band gap (eV) | CB vs. H2/H2O (eV) | VB vs. O2/H2O (eV) |
|---|---|---|---|---|---|
| a The numbers in the column of “CB vs. H2/H2O” and “VB vs. O2/H2O” have the same meaning as in Table 1. | |||||
| TaON | Reported | 0 | 2.83 | 0.64 (0.34 in exp) | −0.97 (−0.93 in exp) |
| Zr2ON2 | Reported | 0 | 2.57 | −0.34 | −1.67 |
| Ti3O3N2 | New | 31 | 2.37 | 0.22 | −0.92 |
| Zr3O3N2 | New | 1 | 3.40 | 1.54 | −0.63 |
The remaining two materials, Ti3O3N2 and Zr3O3N2, have not been reported yet and are predicted by this work. Both compounds are generated from the crystal structure of Ta3N5. Their crystal structures are compared in Fig. 6. The instability energy ΔH is 31 meV per atom for Ti3O3N2 and 1 meV per atom for Zr3O3N2. This suggests that both materials are likely to be synthesizable. In fact, Ti3O3N2 is declared to have been synthesized from a website.47
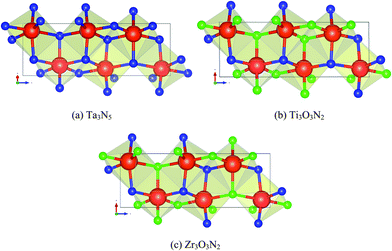 | ||
| Fig. 6 Crystal structures of (a) Ta3N5, (b) Ti3O3N2, and (c) Zr3O3N2. Blue atoms are N, green atoms are O and red atoms are (a) Ta, (b) Ti, and (c) Zr. Structures (b) and (c) are generated by substituting all Ta atoms in (a) with Ti atoms and Zr atoms respectively and substituting 3/5 of the N atoms in (a) with O atoms. However, note that the positions of the O atoms in (b) and (c) are not identical. | ||
The band edge position shown in Fig. 7 suggests that Ti3O3N2 is particularly interesting as its CB and VB bracket the water redox levels and its band gap, predicted to be 2.37 eV, is small enough for visible light absorption. Comparing the band properties of Ti3O3N2 with TaON, the best oxynitride photocatalyst reported so far,16 we find that both of them have their CB and VB bracketing the water redox levels, but the band gap of Ti3O3N2 is expected to be smaller than the band gap of TaON (2.83 eV in our computation and 2.4 eV in experiment). Therefore, Ti3O3N2 has a potential to exhibit better photocatalytic performance than TaON. Zr3O3N2 also has its CB and VB bracketing the water redox levels, but its predicted band gap is large (3.40 eV). However, Fig. 7 suggests that the large band gap of Zr3O3N2 is mainly due to its too high CB level. Shifting the CB downwards is a relatively easy band engineering problem which can be achieved with cation doping. If its CB can be shifted to be slightly higher than the H2/H2O level while retaining its VB position, the band gap will be reduced to 2.0 eV, making it a promising candidate for visible light driven photocatalysts.
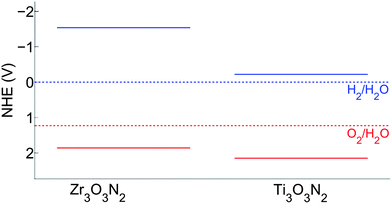 | ||
| Fig. 7 Band edge position of Ti3O3N2 and Zr3O3N2 in the normal hydrogen electrode (NHE) reference. The solid blue lines indicate the CB levels and the solid red lines indicate the VB levels. | ||
In this section, we identified four materials, TaON, Zr2ON2, Ti3O3N2, and Zr3O3N2, as promising candidates for photocatalysts. TaON and Zr2ON2 are known photocatalysts and reproducing them from our screening system shows the validity of the approach. More importantly, we identified two new materials, Ti3O3N2 and Zr3O3N2. Ti3O3N2 shows a very promising band gap and band edge positions, and has a potential to be a better visible-light driven photocatalyst than TaON. Zr3O3N2 is predicted to be a good photocatalyst under UV illumination, and may also be visible light driven with some CB engineering. In addition, both Zr3O3N2 and Ti3O3N2 have the Ta3N5 structure, and thus solid solutions of these three materials are likely to be synthesizable, creating a large chemical space in which these materials can be optimized.
3 Quaternary oxynitrides
In this section, we screened 1377 quaternary oxynitrides, M1–M2–O–N, where M1 or M2 is a d0 or d10 metal cation as described in Section II. Fig. 8 shows the combination of M1–M2 elements for which we find compounds with ΔH less than 0.2 eV per atom. We mentioned in Fig. 5 that some d0 or d10 cations such as V5+, Cr6+, Mo6+, and Sb5+ do not have stable corresponding ternary oxynitrides. In Fig. 8, we found that Cr6+, Mo6+, and Sb5+ do have some stable corresponding quaternary oxynitrides. This suggests that the required oxidizing power for these cations may decrease by adding a second metal cation into the system. It may also be noted that, for some d0 or d10 cations which have stable corresponding ternary oxynitrides in Fig. 5, such as Zr4+ and Ga3+, we have not found any corresponding quaternary oxynitrides in Fig. 8. This is because that, as we mentioned in Section II.0, our sampling in quaternary oxynitrides is not exhaustive but only based on a limited prototype of ternary oxides listed in ref. 3. It is possible that stable Zr4+ and Ga3+ quaternary oxynitrides exist but they cannot be derived from the prototypes we considered in this work. Another consequence of the limited sampling in quaternary oxynitrides is that some known quaternary oxynitride photocatalysts (SrNbO2N48 for instance) were not reproduced by our screening since they could not be derived from the prototypes we considered.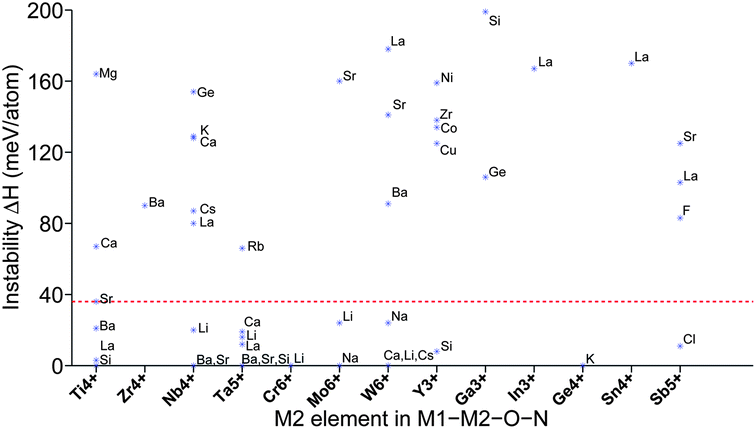 | ||
| Fig. 8 Phase stability of quaternary oxynitrides. Each point represents the lowest energy compound containing the two specified cations (i.e. a d0 or d10 cation with another metal cation). We only show those pairs of cations which have at least one compound with ΔH less than 0.2 eV per atom. All candidates above the red dashed line (36 meV per atom) were eliminated. | ||
After screening for band gap and band edge positions, seventeen compounds are identified as promising candidates for photocatalysts as shown in Table 3. Six of these compounds, CaTaO2N,49 SrTaO2N,49 BaTaO2N,49 LaTaO2N,50 LaTiO2N,51 and BaNbO2N,52 have been reported as water-splitting photocatalysts. Experimentally measured band gaps for CaTaO2N, SrTaO2N, and BaTaO2N are reported as 2.4 eV, 2.1 eV, and 1.8 eV respectively and our calculated band gaps for these three compounds, 2.53 eV, 2.26 eV and 1.90 eV respectively, agree well with them. Moreover, the calculated band edge positions of these three compounds suggest that their VB is actually higher than the O2/H2O level. Therefore, they are unsuitable for photo-catalyzing the O2 evolution reaction without an external bias voltage. This result may explain the experimental observation that only H2 evolution reaction is photo-catalyzed by CaTaO2N, SrTaO2N, and BaTaO2N in ref. 49.
| Material | Reported/new | ΔH (meV per atom) | Band gap (eV) | CB vs. H2/H2O (eV) | VB vs. O2/H2O (eV) |
|---|---|---|---|---|---|
| a The numbers in the column of “CB vs. H2/H2O” and “VB vs. O2/H2O” have the same meaning as in Table 1. | |||||
| CaTaO2N | Reported | 19 | 2.53 | 1.50 | 0.20 |
| SrTaO2N | Reported | 0 | 2.26 | 1.34 | 0.31 |
| BaTaO2N | Reported | 0 | 1.90 | 0.97 | 0.30 |
| LaTaO2N | Reported | 0 | 1.83 | 0.55 | −0.05 |
| LaTiO2N | Reported | 3 | 2.41 | 0.09 | −1.09 |
| BaNbO2N | Reported | 0 | 2.03 | 0.59 | −0.21 |
| Ba3Ta2O5N2 | New | 33 | 2.34 | −0.64 | −1.75 |
| Ba2TaO3N | New | 13 | 2.81 | −0.37 | −1.95 |
| Sr2NbO3N | New | 0 | 3.15 | −0.33 | −2.25 |
| Li14Cr2ON8 | New | 0 | 2.43 | −0.18 | −1.38 |
| Sr2Ti6O11N2 | New | 36 | 2.86 | −0.15 | −1.78 |
| Ba2Ti6O11N2 | New | 21 | 2.77 | −0.11 | −1.65 |
| La2TiO2N2 | New | 3 | 2.46 | 0.02 | −1.21 |
| Na5MoO4N | New | 0 | 3.19 | 0.43 | −1.53 |
| Na4WO2N2 | New | 0 | 2.95 | 0.78 | −0.94 |
| Li5MoO4N | New | 24 | 2.61 | 1.08 | −0.30 |
| Ca5WO2N4 | New | 0 | 3.26 | 1.71 | −0.32 |
The remaining eleven materials, Ba3Ta2O5N2, Ba2TaO3N, Sr2NbO3N, Li14Cr2ON8, Sr2Ti6O11N2, Ba2Ti6O11N2, La2TiO2N2, Na5MoO4N, Na4WO2N2, Li5MoO4N, and Ca5WO2N4, have not been reported as water-splitting photocatalysts yet. Li14Cr2ON8, Na5MoO4N, Na4WO2N2, and Ca5WO2N4 can be found in the ICSD with a known crystal structure. Ba2TaO3N and Sr2NbO3N are not in the ICSD but have been synthesized in ref. 53. Both their structures are declared as a K2NiF4 structure. This agrees with our computation as we derived both materials from a Sr2SnO4 structure prototype, which is closely related to K2NiF4. The other five candidates, Ba3Ta2O5N2, Sr2Ti6O11N2, Ba2Ti6O11N2, La2TiO2N2, and Li5MoO4N, are predicted by us. Ba3Ta2O5N2 is derived from Sr3Ti2O7. Sr2Ti6O11N2 and Ba2Ti6O11N2 are derived from K2Ti6O13. La2TiO2N2 is derived from Sr2SnO4. Li5MoO4N comes from a substitution of Na with Li in Na5MoO4N. We compared their crystal structures in Fig. 9–12 respectively. The instability energy ΔH for Ba3Ta2O5N2, Sr2Ti6O11N2, Ba2Ti6O11N2, La2TiO2N2, and Li5MoO4N is 33 meV per atom, 35 meV per atom, 21 meV per atom, 3 meV per atom and 24 meV per atom respectively.
 | ||
| Fig. 9 Crystal structures of (a) Sr3Ti2O7 and (b) Ba3Ta2O5N2. Blue atoms are N, green atoms are O, red atoms are (a) Ti and (b) Ta, and yellow atoms are (a) Sr and (b) Ba. Structure (b) is generated by substitution of all Sr atoms in (a) with Ba atoms, all Ti atoms in (a) with Ta atoms, and 2/7 of the O atoms in (a) with N atoms. | ||
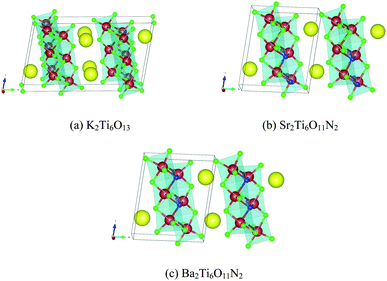 | ||
| Fig. 10 Crystal structures of (a) K2Ti6O13, (b) Sr2Ti6O11N2, and (c) Ba2Ti6O11N2. Blue atoms are N, green atoms are O, red atoms are Ti, and yellow atoms are (a) K, (b) Sr, and (c) Ba. Structures (b) and (c) are generated by substitution of all K atoms in (a) with Sr atoms and Ba atoms respectively, and 2/13 of the O atoms in (a) with N atoms. | ||
 | ||
| Fig. 11 Crystal structures of (a) Sr2SnO4 and (b) La2TiO2N2. Blue atoms are N, green atoms are O, red atoms are (a) Sn and (b) Ti, and yellow atoms are (a) Sr and (b) La. Structure (b) is generated by substitution of all Sr atoms in (a) with La atoms, all Sn atoms in (a) with Ti atoms, and 1/2 of the O atoms in (a) with N atoms. | ||
 | ||
| Fig. 12 Crystal structures of (a) Na5MoO4N and (b) Li5MoO4N. Blue atoms are N, green atoms are O, red atoms are Mo, and yellow atoms are (a) Na and (b) Li. Structure (b) is generated by substitution of all Na atoms in (a) with Li atoms. | ||
The band edge positions of these eleven interesting quaternary compounds are shown in Fig. 13, which suggests that, among them, La2TiO2N2 and Li5MoO4N have the best band properties for a visible light driven photocatalyst. For both, the CB and VB are bracketing the water redox levels, and their band gap is predicted to be 2.46 eV and 2.61 eV respectively. The CB and VB of Na4WO2N2 and Ca5WO2N4 also bracket the water redox level, but their band gaps are too large for visible light absorption. However, similar to Zr3O3N2, their large band gaps are mainly due to a too high CB level. Hence, if their CB levels can be shifted downwards by cation doping or solid solution, they may still become promising for visible-light driven photocatalysis. In contrast, Ba3Ta2O5N2 and Li14Cr2ON8 have small enough band gaps for visible light absorption, but their CB levels are lower than the H2/H2O level, indicating that either an external bias voltage or CB engineering is needed to achieve water-splitting. It is worth noting that the CB level of Li14Cr2ON8 is only 0.18 V lower than the H2/H2O level, indicating that the bias voltage required is small. The remaining five materials, Ba2TaO3N, Sr2NbO3N, Sr2Ti6O11N2, Ba2Ti6O11N2, and Na5MoO4N, are promising candidates for photocatalysts under UV illumination.
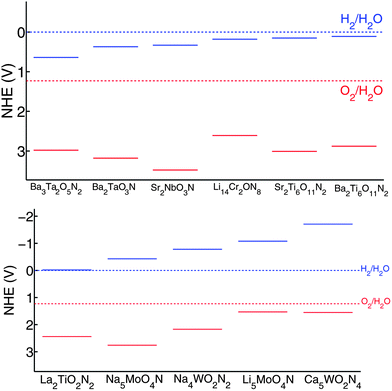 | ||
| Fig. 13 Band edge positions of Ba3Ta2O5N2, Ba2TaO3N, Sr2NbO3N, Li14Cr2ON8, Sr2Ti6O11N2, Ba2Ti6O11N2, La2TiO2N2, Na5MoO4N, Na4WO2N2, Li5MoO4N, and Ca5WO2N4 in the normal hydrogen electrode (NHE) reference. The solid blue lines indicate the CB levels and the solid red lines indicate the VB levels. | ||
In this section, we identified seventeen materials, listed in Table 3, as promising candidates for photocatalysts. CaTaO2N, SrTaO2N, BaTaO2N, LaTaO2N, LaTiO2N, and BaNaO2N have been reported as water splitting photocatalysts while the other eleven materials, Ba3Ta2O5N2, Ba2TaO3N, Sr2NbO3N, Li14Cr2ON8, Sr2Ti6O11N2, Ba2Ti6O11N2, La2TiO2N2, Na5MoO4N, Na4WO2N2, Li5MoO4N, and Ca5WO2N4, are newly identified in this paper. Among these eleven materials, La2TiO2N2 and Li5MoO4N have the most promising band gap and band edge positions. Similar to Ti3O3N2, they have the potential to be better water splitting photocatalysts than TaON. Na4WO2N2 and Ca5WO2N4 have a band gap too large for visible light absorption and can work under UV light illumination. However, with some CB engineering, they may still be promising visible light driven photocatalysts. Ba3Ta2O5N2 and Li14Cr2ON8 have a good band gap for visible light absorption, but they need an external bias voltage to photo-catalyze the H2 evolution reaction. In addition, Ba2TaO3N, Sr2NbO3N and La2TiO2N2 have the same crystal structure (Sr2SnO4 structure). Therefore, the solid solutions of these three materials are also likely to be synthesizable and are likely to be promising candidates for water-splitting photocatalysts as well.
IV Discussion
We demonstrated in this paper a high throughput computational screening for the design of novel water-splitting photocatalysts. Compounds are screened based on their phase stability, band gap, and band edge positions in aqueous environment. Eleven known photocatalysts are reproduced and sixteen new candidate photocatalysts are proposed by our screening, indicating the validity of the approach. However, it is worth noting that there are other important properties not considered in our screening. The aqueous stability of a material is important for the commercial exploitation of a photocatalyst. The standard tool to estimate it is the Pourbaix diagram.54 However, Pourbaix diagrams have only been determined for elements in equilibrium with water. To assess the stability of more complex materials in water, one could use a recently developed method which enables the construction of Pourbaix diagrams almost entirely from first principles.55 The method treats the Pourbaix diagram as a phase stability diagram for a material in equilibrium with various aqueous species.Our screening does not consider kinetic properties either, but they also affect the performance of photocatalysts. For instance, one major issue for hematite Fe2O3, a promising visible light driven photocatalyst, is its poor charge carrier diffusion.56 Defect related properties are also not considered in this paper. Defect formation energy and defect concentration are closely related to the charge carrier recombination rate and lifetime, thus having an effect on the efficiency of the device. Dopability suggests to which extent the material can be engineered for a given dopant and also indicates how strong the innate P–N junction field could be designed to help the electron–hole separation. For these properties, the ab initio predictions are often too expensive to be included in a high throughput screening system, but they could be investigated specifically for the new candidates. Another limitation is that, in this paper, the properties are predicted under dark conditions. However, a photocatalyst works in an illuminated environment, and thus some of its properties such as band edge positions may change accordingly.
As we mentioned in Section III.2, Fig. 5 suggests that V5+, Cr6+, Mo6+, and Sb5+ do not form any stable ternary oxynitrides. We believe that this is because the required oxidizing power for these cations is too large to achieve with nitrogen. Fig. 14 illustrates this. For each cation in Fig. 14, we analyzed the thermodynamic phase stability of the binary oxide with the cation under different oxygen chemical potentials and thus evaluated the minimum oxygen chemical potential required to form a stable binary oxide with the cation. A higher minimum chemical potential indicates a larger oxidizing power required for the cation. While equivalent data for nitrides are not available, the oxide data in Fig. 14 should be representative of the relative oxidation strength needed. Fig. 14 shows that V5+, Cr6+, Mo6+, and Sb5+ require the largest oxidizing power among these cations. Moreover, these four cations do not have corresponding binary nitrides in the ICSD, supporting the observation we made in Fig. 5. It is worth noting that we found stable quaternary oxynitrides with Cr6+, Mo6+, and Sb5+ in Fig. 8, indicating that adding a second cation may reduce the oxidation power required.
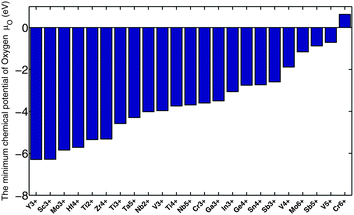 | ||
| Fig. 14 Estimate of the oxidizing power required to create certain cations. | ||
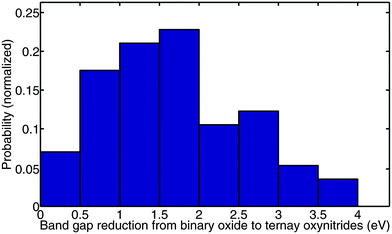
The reason to use nitrogen instead of oxygen as the anion was to increase the valence band energy and lower the band gap. It is therefore interesting to investigate the extent of the band gap reduction as one goes from oxide to oxynitride. To study this question, we take the lowest energy structure for each ternary oxynitride that we generated in Section III.2, and compare its computed band gap to the experimentally measured gap of the binary oxide with the same cation. We collected the experimental gaps from ref. 3, 16 and 57–69. For example, for Ta5+, we compared the band gap of TaON, Ta3O6N, Ta4O7N2, Ta4ON6, and Ta8O11N6 to the experimentally measured band gap of Ta2O5. The reasons for using experimentally measured gaps but not computed band gaps as the binary oxide references are that (1) binary oxides are generally well studied in experiment, and thus their measured gaps are accessible and reliable; (2) we used the GGA+U based Δ-sol method32 for computing the band gaps, and the U value is typically different between oxynitrides and oxides, so even if we compare the computed gaps of oxynitrides to the computed gaps of binary oxides, the comparison would not be consistent as it is based on different U parameters. A histogram of the band gap reduction for all generated ternary oxynitride compounds is shown in Fig. 15. Note that we only generated ternary oxynitride containing d0 or d10 cations. The mean band gap reduction is around 1.8 eV. This verifies that by introducing N into an oxide, the band gap can be significantly reduced. It is worth noting that the range of the band gap reduction is fairly large, from 0 eV to 4 eV. This large range could be due to two reasons. The first reason may be that the effect depends substantially on the cation. The second reason may be that, even for the same cation, introducing different amounts of nitrogen into the system may lead to different band gap reductions. To better demonstrate these two factors, we plot the band gap reduction for each cation in Fig. 16. We see clearly that the mean band gap reduction is generally different for different cations, and this difference is on the order of 1 eV. In the meantime, the standard deviation of the band gap reduction for a given cation is sometimes also on the order of 1 eV. This observation indicates that the two facts mentioned above both influence the band gap reduction.
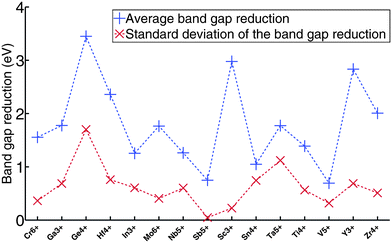 | ||
| Fig. 16 The blue line is the band gap reduction for each cation. The red line is the standard deviation of the band gap reduction for each cation. | ||
We look further into the effect of the amount of nitrogen on the band gap reduction. It is possible that a change of the N/O ratio gives a different O2p and N2p weight in the valence band, thus leading to a different band gap reduction. Alternatively, a different amount of nitrogen may lead to different crystal structures and thus to a different band gap reduction. Fig. 17 shows the average band gap reduction and its standard deviation as a function of the N/O ratio. We observe that the average band gap reduction does not change much with the N/O ratio. From a very small ratio of N/O (left end of the blue line in Fig. 17) to a very large ratio of N/O (right end of the blue line in Fig. 17), the average band gap reduction changes about 0.4 eV. The rest of the difference in band gap reduction, which is on the order of 1 eV, comes from the crystal structure change. As an extension of this observation, we would like to point out that adding more nitrogen into an oxide system does not necessarily lead to a larger band gap reduction as one might assume, because this statement does not consider the effect of the possible crystal structure change. For instance, our computation suggests that the band gap of Nb4O7N2 is less than that of Nb4ON6 (1.52 eV vs. 1.85 eV).
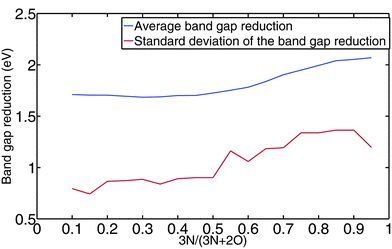 | ||
| Fig. 17 The blue line is the average band gap reduction as a function of the N/O ratio. The red line is the standard deviation of the band gap reduction at a given N/O ratio. | ||
V Conclusion
In this paper, we presented a high throughput first principle approach to search for new water-splitting photocatalysts, and applied it to oxynitrides and some nitrides. Most of the known photocatalytic materials in the screened chemical space are reproduced, proving the validity of the approach. In addition, sixteen new materials are suggested as promising photocatalysts, including three binary nitrides, two ternary oxynitrides and eleven quaternary oxynitrides. They have been either synthesized experimentally or predicted, by our approach, to be synthesizable. Because of their predicted band gap and band edge positions, Ti3O3N2, La2TiO2N2 and Li5MoO4N are particularly promising as visible light driven photocatalysts. In addition, with some further CB engineering or a small bias voltage, Cu3N, Zr3O3N2, Ba3Ta2O5N2, Li14Cr2ON8, Na4WO2N2, and Ca5WO2N4 also have the potential to be good visible light driven photocatalysts. The remaining seven materials, AgN3, Zr3N4, Ba2TaO3N, Sr2NbO3N, Sr2Ti6O11N2, Ba2Ti6O11N2, and Na5MoO4N, are candidates for photocatalysts that may work under UV illumination. In addition, based on our screening result, the solid solutions of Ti3O3N2, Zr3O3N2, and Ta3N5 and the solid solutions of Ba2TaO3N, Sr2NbO3N and La2TiO2N2 may be synthesizable and may be promising candidates for photocatalysts too.Acknowledgements
This work was supported by Eni S.p.A. under the Eni-MIT Alliance Solar Frontiers Program, and the National Science Foundation through TeraGrid resources provided by the Pittsburgh Supercomputing Center and Texas Advanced Computing Center under grant number TG-DMR970008S. Some methodological work has been supported by the Department of Energy under contract DE-FG02-96ER4557.References
- A. Fujishima and K. Honda, Nature, 1972, 238(5358), 37 CrossRef CAS.
- A. Fujishima and K. Honda, Bull. Chem. Soc. Jpn., 1971, 44(4), 1148 CrossRef CAS.
- F. E. Osterloh, Chem. Mater., 2008, 20, 35–54 CrossRef CAS.
- G. Hautier, A. Jain, S. P. Ong, B. Kang, C. Moore, R. Doe and G. Ceder, Chem. Mater., 2011, 23, 3495–3508 CrossRef CAS.
- A. Jain, G. Hautier, C. Moore, B. Kang, J. Lee, H. Chen, N. Twu and G. Ceder, J. Electrochem. Soc., 2012, 159(5), A622–A633 CrossRef CAS.
- H. Chen, G. Hautier, A. Jain, C. Moore, B. Kang, R. Doe, L. Wu, Y. Zhu, Y. Tang and G. Ceder, Chem. Mater., 2012, 24(11), 2009–2016 CrossRef CAS.
- G. Hautier, A. Jain, H. Chen, C. Moore, S. P. Ong and G. Ceder, J. Mater. Chem., 2011, 21, 17147–17153 RSC.
- S. Wang, Z. Wang, W. Setyawan, N. Mingo and S. Curtarolo, Phys. Rev. X, 2011, 1, 021012 CrossRef.
- G. K. H. Madsen, J. Am. Chem. Soc., 2006, 128, 12140–12146 CrossRef CAS.
- R. Armiento, B. Kozinsky, M. Fornari and G. Ceder, Phys. Rev. B: Condens. Matter Mater. Phys., 2011, 84, 014103 CrossRef.
- J. Hachmann, R. Olivares-Amaya, S. Atahan-Evrenk, C. Amador-Bedolla, R. S. Sanchez-Carrera, A. Gold-Parker, L. Vogt, A. M. Brockway and A. Aspuru-Guzik, J. Phys. Chem. Lett., 2011, 2, 2241–2251 CrossRef CAS.
- A. N. Sokolov, S. Atahan-Evrenk, R. Mondal1, H. B. Akkerman, R. S. Sánchez-Carrera, S. Granados-Focil, J. Schrier, S. C. B. Mannsfeld, A. P. Zoombelt, Z. Bao and A. Aspuru-Guzik, Nat. Commun., 2011, 2, 432 CrossRef.
- N. M. O'Boyle, C. M. Campbell and G. R. Hutchison, J. Phys. Chem. C, 2011, 115, 16200–16210 CAS.
- A. Jain, G. Hautier, C. J. Moore, S. P. Ong, C. C. Fischer, T. Mueller, K. A. Persson and G. Ceder, Comput. Mater. Sci., 2011, 50, 2295–2310 CrossRef CAS.
- G. Ceder, G. Hautier, A. Jain and S. P. Ong, MRS Bull., 2011, 36(3), 185–191 CAS.
- K. Maeda and K. Domen, J. Phys. Chem. C, 2007, 111, 22 Search PubMed.
- D. Yokoyama, H. Hashiguchi, K. Maeda, T. Minegishi, T. Takata, R. Abe, J. Kubota and K. Domen, Thin Solid Films, 2011, 519, 2087–2092 CrossRef CAS.
- Inorganic Crystal Structure Database, http://icsd.fiz-karlsruhe.de/icsd/.
- G. Hautier, C. Fischer, V. Ehrlacher, A. Jain and G. Ceder, Inorg. Chem., 2011, 50, 656–663 CrossRef CAS.
- I. E. Castelli, T. Olsen, S. Datta, D. D. Landis, S. Dahl, K. S. Thygesena and K. W. Jacobsen, Energy Environ. Sci., 2012, 5, 5814 CAS.
- P. Hohenberg and W. Kohn, Phys. Rev., 1964, 136(21), B864 CrossRef.
- W. Kohn and L. J. Sham, Phys. Rev., 1965, 140, A1133 CrossRef.
- P. E. Blöchl, Phys. Rev. B: Condens. Matter Mater. Phys., 1994, 50, 17953–17979 CrossRef.
- G. Kresse and J. Furthmuller, Phys. Rev. B: Condens. Matter Mater. Phys., 1996, 54(11), 169 Search PubMed.
- G. Kresse and D. Joubert, Phys. Rev., 1999, 59, 1758 CAS.
- J. P. Perdew, K. Burke and M. Ernzerhof, Phys. Rev. Lett., 1996, 77, 3865 CrossRef CAS.
- Y. Wu, M. K. Y. Chan and G. Ceder, Phys. Rev. B: Condens. Matter Mater. Phys., 2011, 83, 235301 CrossRef.
- G. L. W. Hart and R. W. Forcade, Phys. Rev. B: Condens. Matter Mater. Phys., 2008, 77(22), 1–12 CrossRef.
- M. Yang, J. Oró-Solé, J. A. Rodgers, A. B. Jorge, A. Fuertes and J. P. Attfield, Nat. Chem., 2011, 3(1), 47–52 CrossRef CAS.
- G. Hautier, S. P. Ong, A. Jain, C. J. Moore and G. Ceder, Phys. Rev. B: Condens. Matter Mater. Phys., 2012, 85, 155208 CrossRef.
- A. Jain, G. Hautier, S. P. Ong, C. J. Moore, C. C. Fischer, K. A. Persson and G. Ceder, Phys. Rev. B: Condens. Matter Mater. Phys., 2011, 84, 045115 CrossRef.
- M. K. Y. Chan and G. Ceder, Phys. Rev. Lett., 2010, 105, 196403 CrossRef CAS.
- M. S. Wrighton, D. S. Ginley, P. T. Wolczanski, A. B. Ellis, D. L. Morse and A. Linz, Proc. Natl. Acad. Sci. U. S. A., 1976, 72(4), 1518 CrossRef.
- M. G. Walter, E. L. Warren, J. R. McKone, S. W. Boettcher, Q. Mi, E. A. Santori and N. S. Lewis, Chem. Rev., 2010, 110, 6446–6473 CrossRef CAS.
- T. Lindgren, M. Larsson, S. E. Lindquist, Proc. 14th Int. Workshop on Quantum Solar Energy Conversion, 2002 Search PubMed.
- H. A. Al-Brithen, A. R. Smith and D. Gall, J. Appl. Phys., 2001, 90, 4 Search PubMed.
- L. Bergman, X. B. Chen, D. McIlroy and R. F. Davis, Appl. Phys. Lett., 2002, 81, 22 CrossRef.
- M. Hara, G. Hitoki, T. Takata, J. N. Kondo, H. Kobayashi and K. Domen, Catal. Today, 2003, 78, 555–560 CrossRef CAS.
- M. Bär, K. S. Ahn, S. Shet, Y. Yan, L. Weinhardt, O. Fuchs, M. Blum, S. Pookpanratana, K. George, W. Yang, J. D. Denlinger, M. Al-Jassim and C. Heske, Appl. Phys. Lett., 2009, 94, 012110 CrossRef.
- J. S. Becker, E. Kim and R. G. Gordon, Chem. Mater., 2004, 16, 3497–3501 CrossRef CAS.
- C. S. Rees and M. M. Chaudhri, J. Phys. C: Solid State Phys., 1987, 20, 4097–4104 CrossRef CAS.
- P. Kroll, Phys. Rev. Lett., 2003, 90(12), 125501 CrossRef.
- J. J. Chen, B. P. Gila, M. Hlad, A. Gerger, F. Ren, C. R. Abernathy and S. J. Peartona, Appl. Phys. Lett., 2006, 88, 042113 CrossRef.
- K. Maeda, T. Takata, M. Hara, N. Saito, Y. Inoue, H. Kobayashi and K. Domen, J. Am. Chem. Soc., 2005, 127, 8286–8287 CrossRef CAS.
- J. Sato, N. Saito, Y. Yamada, K. Maeda, T. Takata, J. N. Kondo, M. Hara, H. Kobayashi, K. Domen and Y. Inoue, J. Am. Chem. Soc., 2005, 127, 4150–4151 CrossRef CAS.
- T. Mishima, M. Matsuda and M. Miyake, Appl. Catal., A, 2007, 324, 77–82 CrossRef CAS.
- http://www.titandioxide.ru/titan_s/sc3/0176.php .
- K. Maeda, M. Higashi, B. Siritanaratkul, R. Abe and K. Domen, J. Am. Chem. Soc., 2011, 133, 12334–12337 CrossRef CAS.
- D. Yamasita, T. Takata, M. Hara, J. N. Kondo and K. Domen, Solid State Ionics, 2004, 172, 591 CrossRef CAS.
- G. Hitoki, T. Takata, J. N. Kondo, M. Hara, H. Kobayashi and K. Domen, Electrochemistry, 2002, 70, 463 CAS.
- A. Kasahara, K. Nukumizu, G. Hitoki, T. Takata, J. N. Kondo, M. Hara, H. Kobayashi and K. Domen, J. Phys. Chem. A, 2002, 106, 6750 CrossRef CAS.
- B. Siritanaratkul, K. Maeda, T. Hisatomi and K. Domen, ChemSusChem, 2011, 4, 74–78 CrossRef CAS.
- G. Tobías, D. Beltrán-Porter, O. I. Lebedev, G. Van Tendeloo, J. Rodríguez-Carvajal and A. Fuertes, Inorg. Chem., 2004, 43(25), 8011 CrossRef.
- M. Pourbaix, Atlas of Electrochemical Equilibria in Aqueous Solutions, National Association of Corrosion Engineers, Houston, Texas, 1974 Search PubMed.
- K. A. Persson, B. Waldwick, P. Lazic and G. Ceder, Phys. Rev. B: Condens. Matter Mater. Phys., 2012, 85, 235438 CrossRef.
- M. P. Dare-Edwards, J. P. Goodnough, A. Hamnett and P. R. Trevellick, J. Chem. Soc., Faraday Trans., 1983, 79, 2027–2041 RSC.
- H. J. Zhai, S. Li, D. A. Dixon and L. S. Wang, J. Am. Chem. Soc., 2008, 9(130), 15 Search PubMed.
- M. Higashiwaki, K. Sasaki, A. Kuramata, T. Masui and S. Yamakoshi, Appl. Phys. Lett., 2012, 100, 013504 CrossRef.
- A. S. Zyubin, A. M. Mebel and S. H. Lin, J. Phys. Chem. A, 2007, 111, 38 CrossRef.
- W. J. Zhu, T. Tamagawa, M. Gibson, T. Furukawa and T. P. Ma, IEEE Electron Device Lett., 2002, 23, 11 Search PubMed.
- L. F. J. Piper, A. DeMasi, S. W. Cho, K. E. Smith, F. Fuchs, F. Bechstedt, C. Körber, A. Klein, D. J. Payne and R. G. Egdell, Appl. Phys. Lett., 2009, 94, 022105 CrossRef.
- L. Mai, B. Hu, W. Chen, Y. Qi, C. Lao, R. Yang, Y. Dai and Z. L. Wang, Adv. Mater., 2007, 19, 3712–3716 CrossRef CAS.
- E. Z. Kurmaev, A. Moewes, O. G. Bureev, I. A. Nekrasov, V. M. Cherkashenko, M. A. Korotin and D. L. Ederer, J. Alloys Compd., 2002, 347, 213–218 CrossRef CAS.
- A. Nainani, Y. Sun, T. Irisawa, Z. Yuan, M. Kobayashi, P. Pianetta, B. R. Bennett, J. B. Boos and K. C. Saraswat, J. Appl. Phys., 2011, 109, 114908 CrossRef.
- A. V. Emeline, E. V. Lobyntseva, V. K. Ryabchuk and N. Serpone, J. Phys. Chem. B, 1999, 103, 1325–1331 CrossRef CAS.
- Ç. Kılıç and A. Zunger, Phys. Rev. Lett., 2002, 88, 095501 CrossRef.
- A. Chakrabarti, K. Hermann, R. Druzinic, M. Witko, F. Wagner and M. Petersen, Phys. Rev. B: Condens. Matter Mater. Phys., 1999, 59, 16 CrossRef.
- D. Jia., X. Wang and W. M. Yen, Phys. Rev. B: Condens. Matter Mater. Phys., 2004, 69, 235113 CrossRef.
- A. Emeline, G. V. Kataeva, A. S. Litke, A. V. Rudakova, V. K. Ryabchuk and N. Serpone, Langmuir, 1998, 14, 5011–5022 CrossRef CAS.
Footnote |
| † Current address: Institut de la matière condensée et des nanosciences (IMCN), European Theoretical Spectroscopy Facility (ETSF), Université Catholique de Louvain, Chemin des étoiles 8, bte L7.03.01, 1348 Louvain-la-Neuve, Belgium |
| This journal is © The Royal Society of Chemistry 2013 |

