Can only rheology be used to determine the phase separation mechanism in dynamically asymmetric polymer blends (PS/PVME)?
Jafar
Khademzadeh Yeganeh
a,
Fatemeh
Goharpey
*a and
Reza
Foudazi
*b
aDepartment of Polymer Engineering, Amirkabir University of Technology, Tehran, Iran. E-mail: Goharpey@aut.ac.ir; Fax: +98-21-66469162; Tel: +98-21-64542437
bDepartment of Macromolecular Science and Engineering, Case Western Reserve University, Cleveland, Ohio 44106, USA. E-mail: reza.foudazi@case.edu
First published on 3rd August 2012
Abstract
We investigated theoretically and experimentally the correlation between the time evolution of different phase-separating morphologies and corresponding linear and transient rheological behaviors for the dynamically asymmetric PS/PVME (polystyrene/polyvinyl methyl ether) blend in which there is a large difference between the glass transition temperatures of the pure components (about 125 °C). The sensitivity of different rheological analyses was examined to distinguish different phase separation mechanisms from each other, including nucleation and growth (NG), spinodal decomposition (SD), and viscoelastic phase separation (VPS). We found that a combination of experimental and theoretical studies of the linear and nonlinear rheology could provide satisfactory criteria to distinguish effectively samples phase separating by different mechanisms. Furthermore, the variation of fractal behavior by phase separation time was investigated for interconnected and percolated network structures induced by SD and VPS, respectively, which suggested that both network structures are controlled by a diffusion-limited cluster aggregation (DLCA) mechanism.
1. Introduction
The phase separation behavior of polymer blends has attracted great interest from both scientific and industrial viewpoints.1,2 The phase behavior of dynamically asymmetric mixtures that consist of components with two strongly pronounced different relaxation times has attracted increasing attention.3,4 Dynamic asymmetry can be induced by great differences in the molecular weight or Tg (glass transition temperature) of the components.5,6 Recently, Tanaka found a new type of phase separation in dynamically asymmetric mixtures that is called viscoelastic phase separation (VPS).7,8 The main feature of VPS is the buildup of self-generated stresses in the more elastic phase during phase separation. This leads to the induction of a percolating network of the more elastic phase even if it is the minor phase. This percolated network structure coarsens in time via a volume shrinking process and eventually breaks into disconnected domains that can be considered as a kind of disintegration or phase inversion, as mentioned by Tanaka. The induction of the network structure, volume shrinking process and disintegration behavior are characteristic features of VPS that cannot be observed in normal phase separation mechanisms (NPS), i.e. spinodal decomposition (SD) and nucleation and growth (NG).7–9There have been increasing numbers of studies on VPS, which mainly focus on morphological development including percolating network formation, volume shrinking processes and disintegration,9 the effect of shear on VPS,10 extending the classical phase separation models for dynamically asymmetric blends6,11 and the universality of viscoelastic phase separation in dynamically asymmetric mixtures.8,12 However, such works are limited to numerical simulations and optical microscopy observations and rheological measurements supporting the arguments and the nature of the network structure induced by VPS are rarely studied.13
Rheology is a sensitive tool to assess morphological changes and has been used to study the correlation between resultant phase-separated morphologies and the corresponding rheological behavior,13–18 which involves complex combinations of kinetics, thermodynamics and viscoelasticity. For samples phase separating by an NG mechanism, the presence of a dispersed droplet phase leads to a shoulder in the storage modulus versus frequency curve with terminal behavior. In the metastable region, the storage modulus at low frequencies increases with phase separation, which is attributed to the higher deformability of larger droplets.16,17 In the unstable region, samples exhibit an enhanced storage modulus at low frequencies with a large deviation from terminal behavior.17,18 In this region, the storage modulus at low frequencies decreases with the phase separation time. The enhanced storage modulus in the early stages of phase separation is due to the formation of a highly interconnected network, and the subsequent decrease was considered as a result of interconnectivity weakening during phase separation. The aforementioned studies14–18 investigated only SD and NG mechanisms in polymer blends. In our previous work, we investigated the rheological behavior of phase-separating blends under different mechanisms: VPS, SD and NG.13 It was shown that the sample phase separating by NG could also exhibit non-terminal behavior in addition to the terminal behavior. We observed non-terminal solid-like behavior in the early stages of phase separation for samples phase separating by VPS due to the induced percolated network structure. However, the rheological behavior of the morphology induced by VPS and its differences with the NG and SD mechanisms are not well understood and need further investigation.
Recently, great effort has been devoted to developing rheo-optical techniques based on small angle light scattering (SALS) and dichroism measurements to characterize the in situ and real-time evolution of the microstructure during flow.19–21 However, the challenge is to couple the optical patterns to the rheological response of the mixture under both small and large deformation flows.19,20 Moreover, separating the influence of polydispersity and the shape of the dispersed phase in two-phase blends under flow involves a level of ambiguity in the results and limits their general acceptance.20 It has been shown that SALS data alone are insufficient to distinguish between SD and NG mechanisms and is restricted to relatively thin and transparent films.21 Phase separated PS/PVME blends become optically turbid and opaque, for which light scattering may not be informative.
Complex structures can be efficiently quantified and characterized by their fractal dimension corresponding to the degree of irregularity and complexity of the space filling object. A smaller fractal dimension indicates a more open and porous structure and a less compact network. The fractal nature of particle aggregates has been studied extensively, both experimentally and theoretically.22,23 However, a quantitative description of the phase morphology of polymer blends,24 particularly phase-separating ones,25 has not been well studied by means of the fractal theory.
In this work, PS/PVME blends, which exhibit a lower critical solution temperature (LCST) within the experimental temperature window,13 were chosen for morphological and rheological studies. Both polymers are fully amorphous and due to the large difference in the glass transition temperature between PS and PVME (about 125 °C), VPS can be induced in their mixtures.8,13 Many studies have been done on PS/PVME blends such as the kinetics of phase separation,26 phase separation morphology,27 segmental mobility,28 the effect of molecular weight on the phase behavior29 and shear-induced mixing (SIM) and demixing (SID).30 However, the modeling of the rheological behavior of these blends in different phase separation regions, particularly VPS, has not been reported yet.
The main objective of this work is to correlate the evolution of different phase-separating morphologies (NG, SD, and VPS) with the corresponding rheological behavior for PS/PVME blends. We will also try to examine the sensitivity of different rheological measurements to distinguish between different phase separation mechanisms. In other words, this paper tries to answer the question of whether we can distinguish different phase separation mechanisms of a polymer blend from the evolution of its rheological behavior. The rheological model developed by Yziquel et al.,31 which was proposed for concentrated suspensions, is used to describe the experimental data of stress growth response upon start-up of shear flow for samples phase separating by SD and VPS mechanisms. Furthermore, for the first time the variation of fractal behavior versus phase separation time was investigated for interconnected and percolated network structures induced by SD and VPS, respectively.
2. Experimental
2.1. Materials
A commercial grade of PS (polystyrene) supplied by Tabriz Petrochemical Co. (GPPS grade 1160), and PVME (polyvinyl methyl ether), Lutonal M40, supplied by BASF Co., were used in this study. The basic characteristics of the polymers are listed in Table 1. Considering the chemical sensitivity of PVME, utmost care was taken to prevent its oxidation. This can also be ensured by a simple visual observation of the blend; the sample should look transparent with a slight yellowish color.32 Thermal gravimetric analysis (TGA) was also performed on PVME using a Perkin-Elmer Pyris1 TGA system to be sure about its thermal stability during morphological and rheological analyses. It was found that the employed PVME is stable up to 190 °C in temperature sweep mode with a 10 °C min−1 ramp, and more than 5 h in time sweep mode at 105 °C (the temperature at which rheological measurements have been done in this study).| M w (g mol−1) | M n (g mol−1) | T g (°C) | Supplier | |
|---|---|---|---|---|
| PS | 248 K | 87 K | 93.5 | Tabriz Petrochemical |
| PVME | 110 K | 64 K | −32 | BASF |
2.2. Sample preparation
The PS/PVME blends were prepared by continuous mechanical mixing of the components in toluene. The solvent was evaporated slowly at room temperature for 1 week. Then, the samples were put in a vacuum oven for 4 days at 45 °C. The vacuum was applied slowly to prevent any possible bubble formation. Finally, full vacuum was applied at 70 °C for 24 h in order to remove the residual solvent remaining in the samples.32,33 Weighting the samples and checking the value to match asymptotically with the total weight of the components ensured the complete evaporation of the solvent.2.3. Methods
In order to study the linear viscoelastic properties, isothermal dynamic frequency sweep experiments were carried out at a temperature of 105 °C and a strain of 1%, which is in the linear viscoelastic region, as was verified by preliminary amplitude sweep tests. To study the stress growth behavior of the PS/PVME blends, start-up of simple shear flow was applied on samples at a shear rate of 0.2 s−1 and a temperature of 105 °C. For samples in the two-phase region, measurements were performed after various pre-heat times at 105 °C to achieve the desired phase-separated morphologies. It should be noted that due to the small strain and very low shear rate exerted on the sample in the small amplitude oscillatory flow, it can be assumed that the flow does not interfere with the thermodynamics and kinetics of the phase separation.13–18
3. Results and discussion
3.1. Morphological observations
Fig. 1 shows the phase diagram of PS/PVME blends obtained in our previous works,13,33 which exhibited a lower critical solution temperature (LCST) with the critical point located at a temperature of about 94 °C and a blend composition of PS/PVME 30/70. The binodal temperatures were obtained by dynamic temperature sweep, scanning calorimetry (DSC), turbidity measurements and Flory–Huggins theory. The spinodal temperatures were obtained by Ajji and Choplin's approach35 to the Fredrickson–Larson theory36 and Flory–Huggins theory.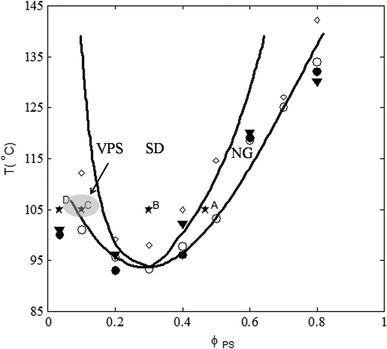 | ||
| Fig. 1 Phase diagram of PS/PVME blends determined from: (i) rheological measurement: binodal temperature by dynamic temperature sweep (○) spinodal temperature by Ajji and Choplin's approach of Fredrickson–Larson theory (◊); (ii) Flory–Huggins theory: binodal curve (—); spinodal curve (– –); (iii) binodal temperature from DSC (▼) and turbidity measurements (●). Selected PS/PVME blends for morphological and rheological investigations are shown with (★) symbol with the weight compositions of A: 46/54, B: 30/70, C: 10/90 and D: 3.5/96.5. The hatched region shows the asymptotic region of VPS in our experiments at 105 °C. | ||
In order to have a deeper insight into the morphology development, we carried out optical microscopy observations during the phase separation of PS/PVME blends with weight compositions of 46/54, 30/70, 10/90, 5/95 and 3.5/96.5, which are located at different regions of the phase diagram (★ symbols in Fig. 1). All the morphological observations were performed at a constant temperature of 105 °C.
Fig. 2a shows the morphology development of the PS/PVME 46/54 blend, which is located in the PS-rich metastable region of the phase diagram at the measuring temperature. The nucleation and growth mechanism led to the formation of spherical PVME-rich domains for this composition, the size of the domains increased over time.
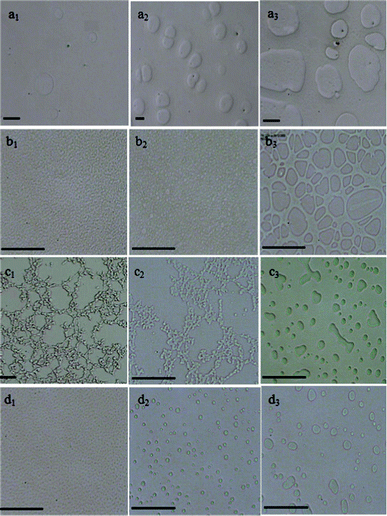 | ||
| Fig. 2 Optical micrographs indicating the time evolution of the phase-separating morphologies for PS/PVME blends with different compositions: (a) 46/54 annealed at 105 °C for a1) 4 h a2) 5 h a3) 7 h (b) 30/70 annealed at 105 °C for b1) 30 min b2) 50 min b3) 140 min (c) 10/90 annealed at 105 °C for c1) 150 min c2) 3 h c3) 5 h (d) 3.5/96.5 annealed at 105 °C for d1) 15 min d2) 2 h d3) 4 h. All the black scale bars correspond to 30 μm. | ||
For the 30/70 blend, located in the unstable region, a highly interconnected structure was developed at the early stages of phase separation as a characteristic of spinodal decomposition (Fig. 2b). Due to the presence of a highly curved interface between the two phases in the co-continuous morphology, a considerable free energy is stored at the interface, which is not in thermodynamic equilibrium and will break up into droplet-matrix morphology at later stages. For the 30/70 blend sample after about 50 min, the interconnected structure broke up into PVME-rich droplets in a PS-rich continuous phase. At longer times, the droplets grew dramatically and a broad size distribution of the droplets was observed. Fig. 2c shows the optical micrographs of the PS/PVME 10/90 blend at different phase separation times. As seen, the PS-rich minor phase formed a continuous network structure. The domain size increased over time and at longer times, phase inversion occurred, leading to the break-up of the PS-rich network into disconnected domains in a PVME-rich matrix. This behavior is characteristic of viscoelastic phase separation, which takes place in mixtures having largely different viscoelastic properties known as dynamically asymmetric mixtures.8 In dynamically asymmetric mixtures, at the initial stage, usual growth of concentration fluctuations occurs. The enhancement of the concentration fluctuations makes the PS-rich phase much more elastic than the PVME-rich one, which increases the dynamic asymmetry.
When the volume deformation rate induced by the phase separation becomes faster than the stress relaxation rate, the elastic stresses in the PS-rich phase (the more elastic phase) is built up. The elastic stresses prevent the rapid growth of composition fluctuations, leading to the formation of a network of PS molecules (transient gel). This stage is called a frozen period, which is a unique feature of viscoelastic phase separation.7–9 In dynamically asymmetric mixtures, domain growth induces elastic stresses in the higher viscoelastic component during phase separation, thereby preserving the continuity of the more viscoelastic phase, even when it is in the minority. This could be due to the hindering effect of induced stresses on the break-up of thin polymer strands.37,38 In the late stages of VPS the volume of each phase approaches the final equilibrium in accordance with the phase diagram and the domain growth slows down, which leads to a weakening of the resulting stress fields. In this stage, the interfacial force starts to play a dominant role, competing with the elastic forces. Hence, the network structure becomes unstable in the reduced stress fields, and the interconnectivity of the minor phase with a higher viscoelasticity breaks into a droplet-matrix morphology, which is the thermodynamically favorable phase state due to its lower interfacial energy.
Similar VPS behavior was also observed for the PS/PVME 5/95 blend where the PS-rich minor phase formed a network structure (data not shown). When the weight fraction of PS was further decreased to 3.5%, the NG mechanism of phase separation was observed (Fig. 2d). The NG mechanism led to the formation of spherical PS-rich domains, which grew up with time. At low concentrations of PS where percolation of the network structure cannot be reached, a transient gel may not be formed, leading to disappearance of VPS. The formation of a transient gel at an early stage of the phase separation is crucial in VPS, and in its absence, thermodynamics controls the phase behavior.
As seen, there is a region between NG and SD where the VPS mechanism occurs. Classical theories such as the Flory–Huggins and Fredrickson–Larson theories fairly distinguish the NG mechanism from the SD one, although these theories do not consider the VPS mechanism for dynamically asymmetric blends at all. For example, these theories predict NG mechanism for 10/90 blend, while VPS was observed experimentally. Therefore, studying the phase behavior of dynamically asymmetric phase separating polymer blends is an open-ended scientific challenge that involves complex combinations of thermodynamics and viscoelasticity. Whether phase separation takes place in a VPS or normal phase separation manner (NG and SD), it strongly depends upon the quenching conditions, the composition and the characteristics of the individual components.9,12,13
3.2. Linear viscoelastic behavior
In our previous work,13 investigations of dynamic frequency sweep experiments of phase-separating PS/PVME blends showed that the terminal behavior (G′∝ω2, G′′∝ω) is a characteristic rheological response of a sample phase separating by NG. However, this criterion can only be used if the minimum practical range of accessible frequency includes the terminal behavior. Therefore, the NG mechanism of phase separation cannot be easily distinguished from the SD and VPS ones. In other words, a sample phase separating by the NG mechanism could also exhibit power law behavior (G′∝ωn, G′′∝ωm) similar to samples phase separating by the SD and VPS mechanisms. We also observed that the tan![[thin space (1/6-em)]](https://www.rsc.org/images/entities/i_char_2009.gif) δ versus ω behavior is strongly dependant on the morphology of the blend.13 Those samples phase separating by NG exhibited a liquid-like behavior during the phase separation, while samples phase separating by SD and VPS both exhibited a transition from a solid-like behavior in the early stages of phase separation to a liquid-like one in the later stages of phase separation. Thus, this rheological plot gives a satisfactory criterion to differentiate samples phase separating by the NG mechanism from samples phase separating by the SD and VPS mechanisms. However, the SD and VPS mechanisms cannot be differentiated straightforwardly. In the following section, the linear viscoelastic behavior of phase-separating PS/PVME blends under different mechanisms was further studied by other rheological analysis in order to find a suitable approach for distinguishing between different phase separating mechanisms.
δ versus ω behavior is strongly dependant on the morphology of the blend.13 Those samples phase separating by NG exhibited a liquid-like behavior during the phase separation, while samples phase separating by SD and VPS both exhibited a transition from a solid-like behavior in the early stages of phase separation to a liquid-like one in the later stages of phase separation. Thus, this rheological plot gives a satisfactory criterion to differentiate samples phase separating by the NG mechanism from samples phase separating by the SD and VPS mechanisms. However, the SD and VPS mechanisms cannot be differentiated straightforwardly. In the following section, the linear viscoelastic behavior of phase-separating PS/PVME blends under different mechanisms was further studied by other rheological analysis in order to find a suitable approach for distinguishing between different phase separating mechanisms.
Fig. 3 shows Cole–Cole plots for the PS/PVME blends at 105 °C for different phase separation times. Two semicircular arcs are observed for the 3.5/96.5 blend, while the 46/54 blend exhibited only one smooth semicircular arc. In other words, the samples phase separating by NG, regardless of the matrix phase (PS-rich and PVME-rich), exhibited liquid-like behavior. This result also confirms that the number of arcs cannot be considered as an indication of the miscibility of phases in a blend system.
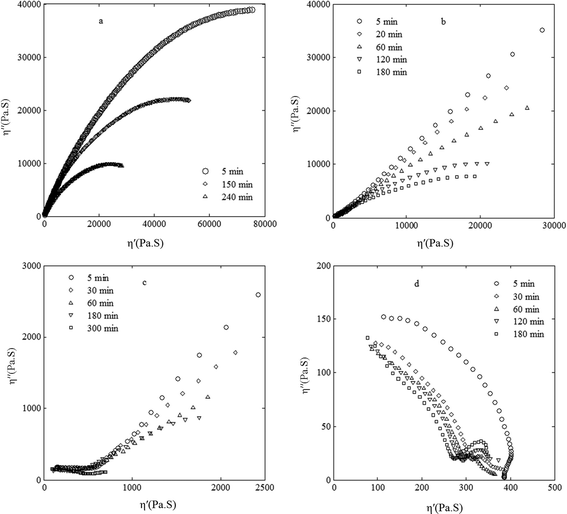 | ||
| Fig. 3 Cole–Cole plots for the PS/PVME blends at different phase separation times at 105 °C with the compositions (a) 46/54, (b) 30/70, (c) 10/90 and (d) 3.5/96.5. | ||
The Cole–Cole plots for the samples phase separating by the SD mechanism in the early stages of phase separation deviated from the semicircular shape, and went straight upward at high viscosities, indicating solid-like behavior. This can be attributed to the interconnections of strands of coexisting phases that behave as strong anchor points to hinder the flow. In the later stages, the Cole–Cole plot shapes became semicircular, indicating liquid-like behavior due to the break-up of the co-continuous structure into a droplet-matrix morphology. For the 10/90 blend in the early stages of phase separation, the Cole–Cole plots indicated solid-like behavior. This is related to the self-generated stresses, which lead to the formation of a space-spanning network structure for the PS-rich phase. Tanaka8 argued that in addition to the initial diffusive and final hydrodynamic regimes, which are known for usual phase separation, there is an intermediate elastic regime where the elastic energy dominates the phase separation and the system behaves thermodynamically and morphologically like an elastic gel. Our results showed that during the VPS in such an intermediate elastic regime, the blend behaves rheologically like an elastic gel as well. The Cole–Cole curves became semicircular after 3 h for the VPS system, indicating that the system approached its final equilibrium state where the deformation rate of domains slowed down and led to a weakening of the resulting stress fields. Thus, the PS-rich phase behaves like a liquid and the system approaches the break-up state of the PS-rich network and forms disconnected domains. The critical time for network disintegration is in good agreement with the one obtained by optical microscopy.
As mentioned earlier, there is a huge elasticity contrast between the PS and PVME polymers (G′PS/G′PVME = 4500 at 105 °C and at 105 °C ω = 0.1 rad s−1) owing to the large difference between their Tg's (about 125 °C). The PS polymer exhibits rheologically solid-like behavior at 105 °C, which is near its Tg. Thus, it is expected that higher PS contents in samples will induce more elastic blends. The PS content of the 46/54 blend is 4.6 times more than the 10/90 sample. However, the former exhibited liquid-like behavior and the latter solid-like behavior. This demonstrates the significance of morphology and interfacial energy in the rheological behavior of blends. Therefore, this rheological analysis provides suitable criteria to differentiate samples phase separating by the NG mechanism from the ones phase separating by the SD and VPS mechanisms. However, samples phase separating by SD and VPS cannot be distinguished from each other.
A lower value of δ at low values of G* implies the formation of a more elastic system. Fig. 4 shows vGP plots for the PS/PVME blends at different phase separation times. For samples phase separating by NG, the change in δ over time at low values of G* was small. The phase angles were about 80° for the 3.5/96.5 blend and 70° for the 46/54 blend. The high values of δ for these blends indicate a liquid-like behavior. A significant change in the phase angle occurred for the samples phase separating by SD and VPS during the phase separation, suggesting a rheological solid–liquid transition. In the early stages of the phase separation, δ was about 40° at low values of G*. This low value of the phase angle indicates an elastic percolated network. However, after the break-up of the co-continuous structure or disintegration of the network structure, the phase angle suddenly increases, indicating a solid–liquid transition. The vGP plot can provide a suitable criterion to distinguish between samples phase separating by the NG mechanism from those phase separating by SD and VPS. However, samples phase separating by SD and VPS cannot be differentiated by this method due to their similar behavior: the transition of solid-like behavior in the early stages of phase separation to liquid-like behavior in the later stages of phase separation.
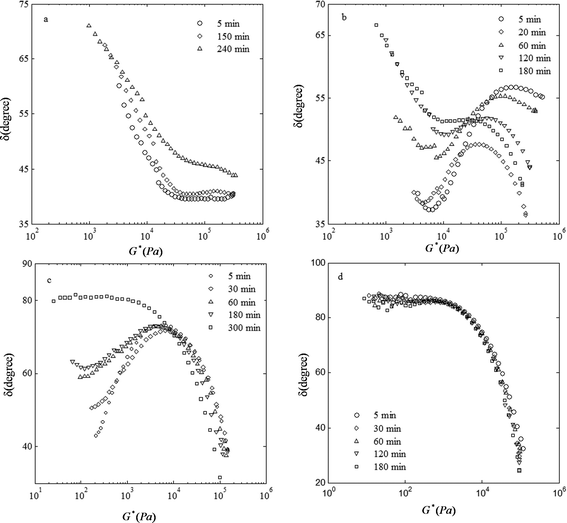 | ||
| Fig. 4 van Gurp–Palmen plots for the PS/PVME blends at different phase separation times at 105 °C with the compositions (a) 46/54, (b) 30/70, (c) 10/90, and (d) 3.5/96.5. | ||
3.3. Modeling linear viscoelastic behavior
The purpose of this section is to investigate and compare theoretically the linear viscoelastic behavior of the phase-separating PS/PVME blends under different mechanisms (NG, SD, and VPS). Thus, we used Coran's model46 which is a phenomenological model for the viscoelastic behavior of heterogeneous systems regardless of morphology. Coran and Patel showed that this semi-empirical model works well for different systems: polymer blends, block copolymers, composites and interpenetrating polymer networks. It should be noted that Palierne's emulsion model47 has been widely used to quantify the linear viscoelastic behavior of polymer blends. However, this model is limited to blends with a droplet-matrix morphology. According to Coran's model, the complex modulus of a mixture lies between the parallel model corresponding to the upper bound behavior, G*par, and the series model corresponding to the lower bound behavior, G*ser, given by following equations:| G* = fG*par + (1 − f)G*ser | (1) |
 | (2) |
| G*par = φ1G*1 + φ2G*2 | (3) |
where the subscript i = 1, 2 represents the properties of component i; G*i and φi are the complex modulus and the volume fraction of phase i, respectively; and the factor f is the only fitting parameter related to the degree of series-parallel coupling, which varies between zero and unity. Generally, when the softer phase is dispersed, the material will be stiff and substantially exhibit upper bound behavior. In contrast, when the soft phase is continuous, a lower bound situation prevails.
To incorporate Coran's model for phase separating blends, we need to estimate the volume fraction of the phases. Since a phase-separating blend with composition ϕ consists of PS-rich and PVME-rich domains, the composition of each domain (ϕ′ and ϕ′′) was determined by the tie line of the phase diagram at 105 °C. Then, the volume fraction of the phase 1, φ1, was calculated by a conservation equation as follows:48
| ϕ = φ1ϕ′ + (1 − φ1)ϕ′′ | (4) |
This equation can be rearranged to estimate the volume fraction of phase 1 at each time as follows:
 | (5) |
The volume fraction of phase 2 would be φ2 = 1 − φ1. Fig. 5 presents the experimental results and Coran's model predictions of the storage modulus as a function of the frequency for different phase-separating PS/PVME blends at 105 °C. The corresponding values of parameter f versus the phase-separation times are shown in Fig. 6. It is clear that this model provides a reasonable fitting of the rheological behavior for all the morphologies developed during NG, SD and VPS.
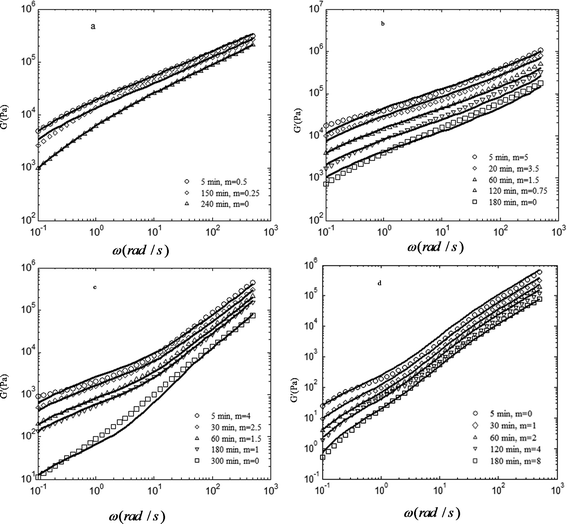 | ||
| Fig. 5 Comparison between experimental storage moduli (symbols) and predictions of Coran's model (continuous lines) for the PS/PVME blends at two phase-separation times for different compositions: (a) 46/54, (b) 30/70, (c) 10/90 and (d) 3.5/96.5.The curves are shifted vertically with the factor of m to avoid overlapping. | ||
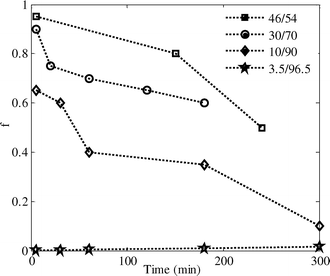 | ||
| Fig. 6 Adjusting parameter f of Coran's model, used to describe the variation of G′ as a function of frequency, versus phase separation time. | ||
The magnitude of f for the PS/PVME 46/54 blend is about unity at the early stage of phase separation, indicating isostrain behavior, which gives the upper bound modulus. The upper bound behavior for the 46/54 blend in the early stages can be due to (i) the continuity of the PS-rich phase (the phase with a higher modulus), and (ii) the smaller size and higher interfacial area of the PVME-rich droplets. The interfacial area decreases over time, inducing a decrease in the storage modulus and the value of f, which means the contribution of the isostress response increases.
The magnitude of f for the 30/70 blend is about 0.9 at the early stage of phase separation, indicating isostrain behavior. The upper bound behavior for the sample in the early stages of phase separation can be attributed to the dominance of the PS-rich phase behavior, highly interconnected structure and high interfacial area induced by the spinodal decomposition. According to the Doi–Ohta theory,49 the elastic modulus is proportional to the interfacial area for co-continuous morphology,50 so the high interfacial area induced in the early stages of SD led to a large increase in the elastic modulus. In addition, interconnectivity in a network structure produces an increase in the elastic modulus according to the rubber elasticity theory. f decreases with phase separation time, demonstrating that the contribution of the isostress behavior increases as the elastic modulus decreases. During the coarsening process, the number of interconnections decreased and consequently the contribution of co-continuity to G′ decreased. In addition, coarsening of the structure led to a decrease in the interfacial area and thus the storage modulus. These arguments explain why the coarsening process during SD results in a decrease in the storage modulus. For the 10/90 blend the magnitude of f is about 0.7 at the beginning of the phase separation, which demonstrates that the contribution of isostrain behavior to the viscoelastic properties is lower compared to the 46/54 and 30/70 compositions, but still higher than the isostress one. This could be due to the three-dimensional network structure of the PS-rich phase that spanned over the blend while the fraction of PS in the blend is much lower than PVME. This leads to a lower value of f for this sample in comparison to the 30/70 blend. Self-generated stresses due to VPS led to volume shrinking of the PS-rich phase over time and hence, the interconnectivity of the PS-rich network structure decreased until breaking up into disconnected domains. The loss of network interconnectivity induced a higher isostratin contribution, and thus a decrease in the storage modulus and the parameter f. The magnitude of f for the 3.5/96.5 blend is very low at the early stage of phase separation, indicating isostress behavior, because the PVME-rich phase is the matrix phase. For the 3.5/96.5 blend the magnitude of f increases with the phase separation time. It means that the deformability of the droplets, which increases with increasing droplet size,51 controls the rheological behavior of this sample. Although the variation of f versus phase separation time sheds light on the isostrain/isostress rheological response of the transient structures, it is naive to use it for differentiating NG, SD and VPS phase separation mechanism from each other.
3.4. Transient shear flow behavior
It is known that shear flow can induce mixing or demixing, depending on the magnitude of the imposed shear rate.30 However, the stress overshoot in most of the start-up experiments in this work occurred within the first 20 s of the measurements and the selected shear rate, 0.2 s−1, was too low to affect the phase diagram.27 At such low strains, the effect of phase separation on morphology is insignificant (mixing/demixing process is negligible), and it has been shown that the observed nonlinear behavior is mainly due to the initial induced morphology.10,52
Fig. 7 shows the results of normalized transient shear stress in start-up shear flow experiments for the PS/PVME blends at different phase separation times. For the 46/54 blend, a stress overshoot typical of nonlinear viscoelastic behavior was observed at small strains, followed by a steady state region (Fig. 7a). The stress overshoot was due to the deformation of PVME-rich droplets into an ellipsoidal shape with the major axis oriented with an angle θ with respect to the flow direction. For small deformations, θ is close to 45°, while for large deformations, θ becomes smaller than 45° and the deformed droplet becomes more oriented in the flow direction.53
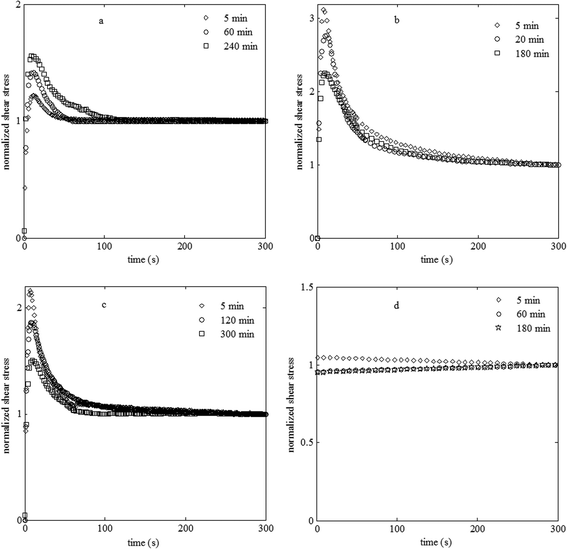 | ||
| Fig. 7 Normalized stress growth at a shear rate of 0.2 s−1 for the PS/PVME blends at different phase separation times at 105 °C with the compositions (a) 46/54, (b) 30/70, (c) 10/90 and (d) 3.5/96.5. | ||
With increasing phase separation time for the 46/54 blend, which corresponds to an increase in droplet size, the magnitude of the stress overshoot increased. This is due to the tendency of larger droplets to be more deformed and then be oriented toward the flow direction.13
The 30/70 blend sample, located in an unstable region, exhibited a strong stress overshoot in the early stages of phase separation and in contrast to the 46/54 blend sample, the stress overshoot decreased with phase separation time (Fig. 7b). For this sample having co-continuous morphology, the stress overshoot can be attributed to the stretching and/or orientation of the co-continuous domains.52 The strong overshoot in the early stages of phase separation can be attributed to the highly interconnective structure with a large interfacial area. According to the Doi–Ohta49 theory, a higher interfacial area induces a larger stress overshoot. Moreover, interconnectivity in a structure leads to stress overshoot.10 Therefore, the decrease in the stress overshoot for samples with longer annealing in the spinodal decomposition regime can be explained by the decrease in the interconnectivity and interfacial area due to the coarsening process.
The 10/90 blend exhibited a strong overshoot in the early stages of phase separation, which decreased with phase separation time (Fig. 7c). The pronounced stress is due to the percolated network structure of the viscoelastic phase-separating sample. According to the dynamic equations derived based on the time dependent Ginzberg–Landau model,10 for a percolated network induced during VPS, the strong overshoot is mainly due to the network deformation under shear, indicating that the PS-rich phase behaved like a percolated gel and mainly supported the applied stress. The volume shrinking of the PS-rich phase during the VPS over time led to a decrease in the interconnectivity and thus the stress overshoot magnitude. In the case of the 3.5/96.5 blend, for which the morphology was PS-rich droplets in a PVME-rich matrix, no stress overshoot can be observed at different phase separation times (Fig. 7d). This could be due to the very low volume fraction of the dispersed phase as well as the high viscosity of the dispersed phase that cannot be deformed.
These results demonstrated that the stress growth behavior upon start-up of shear flow, similar to the linear viscoelastic one, is strongly dependant on the morphology of the sample and correlates well with the evolution of the phase-separating morphologies. In other words, by employing this experiment, the sample phase separating by NG can be distinguished from the SD and VPS ones. However, the stress growth behavior of samples phase separating by SD and VPS are apparently similar. These trends resemble the ones observed by the linear rheology.
To predict the nonlinear behavior of the co-continuous and network structures induced by the SD and VPS mechanisms, respectively, we employed the model proposed by Yziquel et al.31 for concentrated suspensions with solid-like behavior at small strains. In this model, the stress is described by a modified upper-convected Jeffrey's model with a modulus and viscosity parameter taken to be functions of a structural parameter. For steady shear flow, Yziquel's model31 can be written as follows:
 | (6) |
 | (7) |
where σ is the stress, ![[small gamma, Greek, dot above]](https://www.rsc.org/images/entities/i_char_e0a2.gif) is the shear rate and:
is the shear rate and:
| G(ξ) = G0ξ + G∞ | (8) |
 | (9) |
where ξ is the structure parameter, varying between 0 (unstructured system) and 1 (structured network); G∞ and η∞ are the elastic modulus and viscosity of the “destroyed” structure, respectively; G0 + G∞ is the elastic modulus of the structured material at equilibrium (G when ξ = 1); η0 is a characteristic viscosity; η(ξ) is the structured viscosity; f(ξ) is an empirical structure function and ∂ξ/∂t (kinetic equation) gives the evolution of the structure parameter ξ. Depending on the mode of the structure evolution under flow, three possible kinetic equations with the corresponding structure functions have been proposed.
i) Rate-dependant model: this criterion assumes that the structure changes are due to the rate of strain, which is assumed to be proportional to the second invariant of the rate-of-strain tensor:
 | (10) |
 | (11) |
ii) Stress-dependant model: it associates the evolution with the stored elastic energy, which is assumed to be proportional to the first invariant of the stress tensor:
 | (12) |
 | (13) |
iii) Energy-dependant model: this model is related to the rate of energy dissipated, which is related to the double dot product of the stress and the rate-of-deformation tensors:
 | (14) |
 | (15) |
In the above equations, k1 and k2 are kinetic constants for build-up of microstructure and shear induced breakdown, respectively, and n is an empirical power-law coefficient. λ0 is a characteristic relaxation time, assumed to be constant, given by:
 | (16) |
Fig. 8 presents the results of shear start-up experiments for the samples after 5 min annealing from the onset of phase separation by the SD and VPS mechanisms with the prediction of Yziquel's model by different kinetic equations. We obtained G0 + G∞ and η0 from low frequency data of G′ and η′, respectively, for the samples in the early stage of phase separation (completely structured network), while G∞ and η∞ were calculated from low frequency data for the samples phase separating by the VPS and SD mechanisms after disintegration of the network structure and break-up of the co-continuous morphology (destroyed structure), respectively. The parameters k1, k2 and n were adjusted to obtain the best approximate fit.
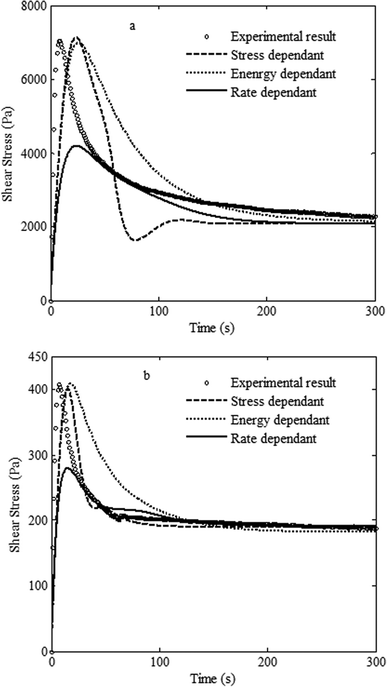 | ||
| Fig. 8 Comparison between the predictions of Yziquel's model by using different kinetic equations with experimental stress growth results of the PS/PVME blends with the compositions of (a) 30/70 and (b) 10/90, after 5 min phase separation at 105 °C. | ||
None of the three different kinetic equations could reasonably predict the experimental results for sample phase separating by SD. The energy-dependent model predicted a broad overshoot. The rate-dependent model largely underestimated the magnitude of undershoot. The stress-dependent model predicted an extra undershoot which did not exist in the experimental result. This is reasonable since the co-continuous structure induced by SD is quite different from the percolated network of concentrated suspensions for which the model is developed.
The stress-dependent model appeared to be the best one for describing the evolution of stress growth behavior of the sample phase separating by VPS. However, the energy-dependent model predicted a relatively broad overshoot, and the rate dependent model largely underestimated the magnitude of the overshoot. Since self-generated stresses control the viscoelastic phase separation, the stress dependence of the structure evolution under flow seems to be rational. This could be a good platform to differentiate SD and VPS mechanisms. In other words, the transient response of structures originated by VPS is very similar to the percolated structures of suspensions and can be predicted by models developed for such systems, while similar efforts fail for the co-continuous structure induced by SD phase separation. Therefore, modeling non-linear viscoelastic behavior, which is very sensitive to microstructure, is the way to distinguish VPS from SD.
3.5. Fractal behavior analysis
It is of particular interest to study the topological characteristics of network structures by using their fractal dimension, df, which demonstrates the degree of irregularity and complexity of the space filling capacity of a fractal object. The smaller the df, the more porous and less compact the structure will be.54 Values of df can be experimentally obtained either by image analysis,25 light-scattering experiments23 or indirectly by rheology.55 The estimation of the fractal dimension of phase separating samples by rheology requires storage modulus measurements at different volume fractions.55 It is clear that by changing the volume fraction, the morphology and phase separation mechanism also change. Thus, rheological methods cannot be used to estimate df of phase separating polymer blends.In this work, fractal dimensions were estimated based on image analysis of the OM micrographs, using a software developed by Sasaki et al.56 as was used in the literature.57,58 We characterized the morphological textures of optical micrographs (Fig. 2b and 2c) in terms of df for interconnected and percolated network structures induced by SD and VPS, respectively, at different phase separation times. The obtained fractal dimensions versus phase separation times are shown in Fig. 9. These results show that VPS has a higher fractal dimension than SD. Moreover, df decreased linearly with phase separation time for both samples phase separating by SD and NG, which demonstrates a loss of structure compactness, as observed by optical images and confirmed by rheological measurements. The compactness of the percolated network (fractal dimension) decreases linearly with phase separation time, df∼t, while the phase-separating domains grows as R∼t3/2 during the VPS.8,13 However, for samples phase separating by SD for which df∼t, domain growth scaling is also linear R∼t.
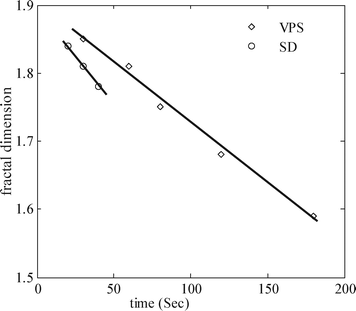 | ||
| Fig. 9 Fractal dimension versus phase separation time for the network structure induced by VPS for the PS/PVME 10/90 blend at 105 °C (symbols) with a linear polynomial fit (continuous line). | ||
The pattern evolution of interconnected and percolated network structures induced by SD and VPS, respectively, can be compared with the proposed theories for colloidal suspensions as was shown in the transient shear flow behavior section. The fractal nature of the colloidal clusters and interconnected network universally displays two types of particle/cluster aggregation behavior (phase separation):23 (i) diffusion-limited cluster aggregation (DLCA), which results in a fast gelation with rather open network structure (df < 2); (ii) reaction-limited cluster aggregation (RLCA), which yields slow aggregation with a more compact and dense structure (df > 2). The obtained df values for interconnected and percolated network structures induced by SD and VPS, respectively, are similar to the ones induced in suspensions by the DLCA mechanism. This sheds light on another aspect of percolated network structure induced by the VPS mechanism and increases our knowledge about this new-found phase separation mechanism.
4. Conclusion
In this work, we studied the correlation between the evolutions of different phase-separating morphologies and corresponding linear rheological behaviors as well as the stress growth response upon start-up of shear flow for PS/PVME blends both experimentally and theoretically. We observed that combinations of experimental and theoretical studies of linear and nonlinear rheology could provide satisfactory criteria to distinguish effectively samples phase separating by different mechanisms (NG, SD and VPS). Comparing the prediction of Coran's model and experimental results indicates that isostrain behavior controls the linear viscoelastic properties of the interconnected structure induced by SD, while the contribution of isostrain behavior in the linear viscoelastic behavior of VPS is much lower. By employing Yziquel's model, we could show that the transient shear flow behavior of the network induced by VPS is stress-dependant and is similar to a percolated structure of suspensions. However, this model cannot predict the transient response of the co-continuous structure originating from SD phase separation. In other words, it was found that the NG mechanism could be differentiated from SD and VPS by linear viscoelastic behavior. However, the trends observed in the rheological behavior of samples phase separating by SD and VPS, which seemed to be similar, can be distinguished by modeling non-linear viscoelastic behavior.Investigating the fractal behavior of interconnected and percolated network structures induced by SD and VPS, respectively, at different phase separation times suggested the similarity of phase separated morphologies to those induced in suspensions by the diffusion limited cluster aggregation (DLCA) mechanism.
Acknowledgements
We thank Mrs. Tahereh Samaee Yekta for her assistance in carrying out the morphological observations of this work.References
- S. Koizumi, Soft Matter, 2011, 7, 3984–3992 RSC.
- J. A. Patel, T. J. Rappl, N. P. Balsara and N. P, Phys. Rev. Lett., 2011, 106 DOI:10.1103/PhysRevLett.106.035702.
- S. Koizumi and T. Inoue, Soft Matter, 2011, 7, 9248–9258 RSC.
- X. Zhong, Y. Liu, H. Su, G. Zhan, Y. Yu and W. Gan, Soft Matter, 2011, 7, 3642–3650 RSC.
- J. Colmenero and A. Arbe, Soft Matter, 2007, 3, 1474–1485 RSC.
- H. Tanaka, Phys. Rev. E: Stat. Phys., Plasmas, Fluids, Relat. Interdiscip. Top., 1997, 56, 4451–4462 CrossRef CAS.
- H. Tanaka, Phys. Rev. Lett., 1993, 71, 3158–3161 CrossRef CAS.
- H. Tanaka, Phys. Rev. Lett., 1996, 76, 787–790 CrossRef CAS.
- T. Koyama and H. Tanaka, Europhys. Lett., 2007, 80, 68002–6 CrossRef.
- T. Imaeda, A. Furukawa and A. Onuki, Phys. Rev. E., 2004, 56, 4451–4462 Search PubMed.
- J. Zhang, Z. Zhang, H. Zhang and Y. Yang, Phys. Rev. E., 2001, 64, 1–10 Search PubMed.
- H. Tanaka and Y. Nishikawa, Phys. Rev. Lett., 2005, 95 DOI:10.1103/PhysRevLett.95.078103.
- J. K. Yeganeh, F. Goharpey and R. Foudazi, Macromolecules, 2010, 43, 8670–8685 CrossRef.
- J. K. Kim, H. W. Son, Y. Lee and J. Kim, J. Polym. Sci., Part B: Polym. Phys., 1999, 37, 889–906 CrossRef CAS.
- Y. H. Niu and Z. G. Wang, Macromolecules, 2006, 39, 4175–4183 CrossRef CAS.
- I. Vinckier and H. M. Laun, Rheol. Acta, 1999, 38, 274–286 CrossRef CAS.
- Z. L. Zhang, H. D. Zhang, Y. L. Yang, I. Vinckier and H. M. Laun, Macromolecules, 2001, 34, 1416–1429 CrossRef CAS.
- I. S. Polios, M. Soliman, C. Lee, S. P. Gido, S. K. Roher and H. H. Winter, Macromolecules, 1997, 30, 4470–4480 CrossRef CAS.
- Y. Deyrail, M. A. Huneault and M. Bousmina, J. Polym. Sci., Part B: Polym. Phys., 2009, 47(15), 1467–1480 CrossRef CAS.
- J. Mewis, H. Yang, P. V. Puyvelde, P. Moldenaers and L. M. Walker, Chem. Eng. Sci., 1998, 53(12), 2231–2239 CrossRef CAS.
- G. H. Koenderink, D. G. A. L. Aarts, V. W. A. de Villeneuve, A. P. Philipse, R. Tuinier and N. W. L Henk, Biomacromolecules, 2003, 4, 129–136 CrossRef CAS.
- G. Pranami, M. H. Lamm and R. D. Vigil, Phys. Rev. E: Stat., Nonlinear, Soft Matter Phys., 2010, 82 DOI:10.1103/PhysRevE.82.051402.
- M. Y. Lin, M. H. Lindsay, D. A. Weitz, R. C. Ball, R. Klein and P. Meakin, Nature, 1989, 339, 360–362 CrossRef CAS.
- H. S. Kim, K. Hyun, T. S. Moon, T. Mitsumata, J. S. Hong, K. H. Ahn and S. J. Lee, Polymer, 2005, 46, 7156–7163 CrossRef.
- M. Song, Y. Huang, Z. Sun and B. Jiang, Polym. Bull., 1991, 25, 515–520 CrossRef CAS.
- K. E. Mabrouk and M. Bousmina, Rheol. Acta, 2006, 45, 877–889 CrossRef CAS.
- T. Nishi, T. T. Wang and T. K. Kwei, Macromolecules, 1975, 8(2), 227–234 CrossRef CAS.
- P. L. Rinaldi, T. Wagler, C. D. Han and H. Chun, Macromolecules, 2000, 33, 1778–1789 CrossRef.
- K. E. Mabrouk and M. Bousmina, Rheol. Acta, 2006, 45, 959–969 CrossRef.
- K. E. Mabrouk and M. Bousmina, Polymer, 2005, 46, 9005–9014 CrossRef.
- F. Yziquel, P. J. Carreau, M. Moan and P. A. Tanguy, J. Non-Newtonian Fluid Mech., 1999, 86, 133–155 CrossRef CAS.
- M. Kapnistos, D. Vlassopoulos, S. H. Anastasiadis, A. Stammer and B. A. Wolf, Macromolecules, 1996, 29, 7155–7163 CrossRef CAS.
- A. Gharachorlou and F. Goharpey, Macromolecules, 2008, 41, 3276–3283 CrossRef CAS.
- S. Reich and Y. J. Cohen, J. Polym. Sci., Polym. Phys. Ed., 1981, 19, 1255–1267 CrossRef CAS.
- A. Ajji and L. Choplin, Macromolecules, 1991, 24, 5221–5223 CrossRef CAS.
- G. H. Fredrickson and R. G. Larson, J. Chem. Phys., 1987, 86, 1553–1560 CrossRef CAS.
- D. W. Bousfield, R. Keunings, G. Marrucci and M. M. Denn, J. Non-Newtonian Fluid Mech., 1986, 21, 79–97 CrossRef CAS.
- R. G. Larson, Rheol. Acta, 1992, 31, 213–263 CrossRef CAS.
- A. Ajji, L. Choplin and R. E. Prud'Homme, J. Polym. Sci., Part B: Polym. Phys., 1988, 26, 2279–2289 CrossRef.
- D. Chopra, M. kontopoulou, D. Vlassopoulos and S. G. Hatzikiriakos, Rheol. Acta, 2002, 41, 10–24 CrossRef CAS.
- R. M. Li, W. Yu and C. X. Zhou, J. Macromol. Sci., Part B: Phys., 2006, 45, 889–898 CrossRef CAS.
- L. A. Utracki and P. Sammut, Polym. Eng. Sci., 1990, 30(17), 1027–1040 CAS.
- W. Gleinser, H. Braun, C. Friedrich and H. J. Cantow, Polymer, 1994, 35(1), 128–135 CrossRef CAS.
- M. Joshi, B. S. Butola, G. Simon and N. Kukaleva, Macromolecules, 2006, 39, 1839–1849 CrossRef CAS.
- D. Wu, Y. Zhang, M. Zhang and M. Yu, Biomacromolecules, 2009, 10, 417–424 CrossRef CAS.
- A. Y. Coran and R. J. Patel, J. Appl. Polym. Sci., 1976, 20, 3005 CrossRef CAS.
- J. F. Palierne, Rheol. Acta, 1990, 29, 204–214 CrossRef CAS.
- J. T. Cabral, J. S. Higgins, N. A. Yerina and S. N. Magonov, Macromolecules, 2002, 35, 1941–1950 CrossRef CAS.
- M. Doi and T. Ohta, J. Chem. Phys., 1991, 95, 1242–1248 CrossRef CAS.
- I. Vinckier and H. M. Laun, J. Rheol., 2001, 45(6), 1373–1385 CrossRef CAS.
- C. Lacroix, M. Grmela and P. J. Carreau, J. Rheol., 1998, 42(1), 41–62 CrossRef CAS.
- K. Krishnan, W. R. Burghardt, T. P. Lodge and F. S. Bates, Langmuir, 2002, 18, 9676–9686 CrossRef CAS.
- P. H. P. Macaubas, N. R. Demarquette and J. M. Dealy, Rheol. Acta, 2004, 44, 295–312 CrossRef.
- R. G. Larson, The Structure and Rheology of Complex Fluids; Oxford University Press: New York, 1999 Search PubMed.
- J. M. Piau, M. Dorget and J. F. Palierne, J. Rheol., 1999, 43, 305–314 CrossRef CAS.
- H. Sasaki, S. Shibata and T. Hatanaka, Bull. Natl. Grassl. Res. Inst, 1994, 49, 17–24 Search PubMed.
- M. Bailly, M. Kontopoulou and K. L. Mabrouk, Polymer, 2010, 51, 5506–5515 CAS.
- F. Zhou and Y. M. Huang, Appl. Surf. Sci., 2007, 253(10), 4507–4511 CrossRef CAS.
| This journal is © The Royal Society of Chemistry 2012 |
