Functionalization of graphene by tetraphenylethylene using nitrene chemistry†
Xiujuan
Xu
a,
Wei
Lv
b,
Jing
Huang
a,
Jijun
Li
c,
Runli
Tang
a,
Jiawei
Yan
c,
Quanhong
Yang
b,
Jingui
Qin
a and
Zhen
Li
*a
aDepartment of Chemistry, Hubei Key Laboratory on Organic and Polymeric Optoelectronic Materials, Wuhan University, Wuhan, 430072, China. E-mail: lizhen@whu.edu.cn; lichemlab@163.com; Fax: +86-27-6875-6757; Tel: +86-27-6225-4108
bKey Laboratory for Green Chemical Technology of Ministry of Education, School of Chemical Engineering and Technology, Tianjin University, Tianjin 300072, China
cState Key Laboratory for Physical Chemistry of Solid Surfaces and Department of Chemistry, College of Chemistry and Chemical Engineering, Xiamen University, Xiamen, Fujian 361005, China
First published on 13th June 2012
Abstract
We have demonstrated that via nitrene addition, graphene was covalently functionalized by tetraphenylethylene, which is a typical aggregation-induced emission (AIE) molecule with a twisted conformation. The obtained new nanocomposite TPE–C4N3–G–S was characterized by transmission electron microscopy (TEM), fourier transform infrared (IR) spectroscopy, fluorescence spectroscopy, UV-vis, thermo-gravimetric analysis (TGA), and 13C NMR. The twisted conformation of TPE–C4N3 was effective in improving the solubility and dispersion stability of graphene, and the resulting composite was totally soluble in organic solvents. The resulting product was determined to have one functional group per 48 carbons. In addition, this new type of molecule may open up a new avenue for the synthesis of graphene-based materials and nanodevice fabrications.
Introduction
Graphene is a single layer of carbon atoms in a closely packed honeycomb two-dimensional lattice. Since its discovery by K. S. Novoselov and A. K. Geim in 2004,1 it has been a rising star due to its unique properties, such as high surface area, excellent thermal and electrical conductivity, and strong mechanical strength.2 This new nanomaterial has attracted increasing attention from various research fields for their potential applications in many technological areas, such as supercapacitors,3 solar cells,4 field effect transistors,5 biosensors,6 and so on. Despite its great promises, one of the major obstacles to these applications is the insolubility of graphene, since the strong π–π interaction allows it to form agglomerates easily.In order to improve its solubility to meet the requirements of various applications, great efforts have been made by scientists. Till now, the surface modification of graphene has been achieved by electrostatic stabilization, covalent modification and non-covalent functionalization,7 and the covalent modification plays an important role in improving the solubility of graphene. Because of the inert surface of graphene, many reports of covalent functionalization were based on graphene oxide (GO), e.g., the isocyanate-modified GO,8 or the covalent modification by amidation of the carboxylic groups with octadecylamine,9 amine-terminated ionic liquid10 or porphyrin,11 and so on.12 However, the drawback was that GO contains some oxygen functional groups, which disrupt the π-conjugation, and thus lose the conductivity. Recently, a series of methods have been utilized for the direct functionalization of graphene, such as aryne cycloaddition,13 diazonium coupling,14 1,3-dipolar cycloaddition,15 and nitrene addition.16 Fortunately, the solubility of graphene has been improved to a certain extent.
In our previous work, graphene could be functionalized via nitrene addition, which was generated in situ by thermal decomposition of azido starting materials, to realize the functionalization of graphene through polyacetylenes.17 Owing to the good solubility of polyacetylenes, the polymer wrapped graphene became soluble in organic solvents with enhanced emission. Although polymers have good solubility and wrapping ability towards graphene, the preparation of polymers often uses catalysts based on various transition-metal species, which are environmentally unfriendly, need careful preservation, and are difficult to obtain. On the other hand, the polymerization conditions are often strict. So we were wondering if small molecules can be used instead of polyacetylenes to efficiently improve the solubility of graphene, because the synthesis is easy, in comparison with polymers.
As reported in the literatures, molecules bearing π-electron-rich frameworks could efficiently improve the dispersion stability of graphene through nondestructive π–π interactions, for example, pyrene units were widely used in non-covalent functionalizations.7a,7b Perhaps pyrene derivates having azido groups could be used for the covalent functionalization of graphene through nitrene chemistry. Therefore, we synthesized compound PB–N3 (Fig. S1, ESI†), but unfortunately, the reaction system of PB–N3 and graphene was stable for only one week (Fig. S2, ESI†). And when the mixture was filtrated, the filtration showed a yellow color, just as PB–N3 itself, demonstrating that no soluble PB–G was obtained. Considering this result, we supposed that besides π-electron-rich frameworks, there should be another important factor to successfully improve the solubility of graphene. As we know, the π–π stacking interactions between layers makes graphene sheets easily aggregate to form multi-layers, and therefore losing the unique properties of graphene. So forces should be made to detach two layers from each other, in other words, steric hindrance should be introduced to overcome the large interlayer cohesive energies. Combining these two factors, large steric hindrance and rich π-electron frameworks, in this article we present the design and synthesis of a tetraphenylethylene derivative for the functionalization of graphene (Scheme 1).
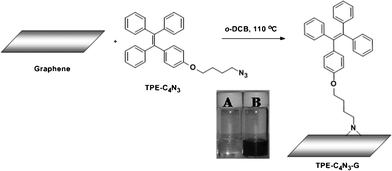 | ||
| Scheme 1 The synthetic route of TPE–C4N3–G, inset: photographs of TPE–C4N3 (A) and TPE–C4N3–G–S (B) in o-dichlorobenzene. | ||
Experimental
Materials and instrumentations
Tetrahydrofuran (THF) was dried over and distilled from a K–Na alloy under an atmosphere of dry argon. Dichloromethane (CH2Cl2) was dried over CaH2 and distilled under normal pressure before use. All the other reagents were used as received.1H and 13C NMR spectra were measured on a Varian Mercury 300 using tetramethylsilane (TMS; δ = 0 ppm) as the internal standard. Elemental analyses were performed by a CARLOERBA-1106 micro-elemental analyzer. Raman spectroscopy was performed on the LabRAM HR 800UV (Horiba Jobin Yvon Company) using 632.8 nm laser excitation. Scans were taken on an extended range (150–3400 cm−1) and the exposure time was 50 s. The samples were viewed under a maximum magnification of ×10. Transmission electron microscopy (TEM) was performed on the JEM-2010-FEF at an accelerating voltage of 200 kV. The TEM samples were prepared by drying a droplet of the suspension on a lacy carbon grid. Atomic force microscopy (AFM) images were obtained from an Agilent 5500 using the tapping mode. IR spectra (400–4000 cm−1) were measured using a Nicolet 380 FT-IR with pure KBr as the background. The X-ray powder diffraction (XRD) analyses were performed on a Bruker D8 Advanced X-ray diffractometer with Cu-Kα radiation (λ = 1.5418 Å). The diffraction data was recorded for 2θ angles from 5 to 60°. UV-vis spectra between 200 and 850 nm were measured on a Shimadzu UV-3600 Spectrophotometer. Photoluminescence (PL) spectra were taken on a Hitachi F-4500 Fluorescence Spectrophotometer. Thermal analysis was performed on NETZSCH STA449C thermal analyzer at a heating rate of 10 °C min−1 in nitrogen at a flow rate of 50 cm3 min−1 (TGA).
Synthesis of compound 3
Into a 100 mL Schlenk tube were added 2 (1.81 g, 5 mM),18 and CH2Cl2 (40 mL). The tube was evacuated under vacuum and then flushed with argon three times through the sidearm. The tube was placed into a reactor at −78 °C, after stirring for 20 min, boron tribromide (5 mM) was carefully added to the mixture. The resultant mixture was stirred for 4 h, and then warmed to room temperature and stirred overnight. The reaction was hydrolyzed by shaking with H2O (20 mL), the organic phase was separated and concentrated by a rotary evaporator. The crude product was purified by recystallization using THF and methanol (1.65 g, 97% yield). 1H NMR (CDCl3, 300 MHz), δ (TMS, ppm): 7.10–6.98 (m, 15H, Ar–H), 6.89 (m, 2H, Ar–H), 6.56 (m, 2H, Ar–H), 4.73 (s, 1H, –OH).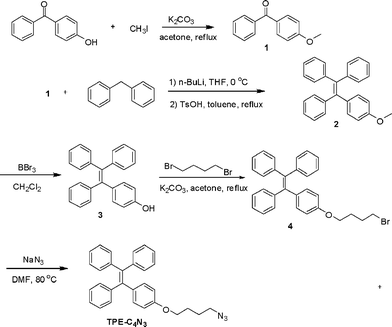 | ||
| Chart 1 The synthetic routes of TPE–C4N3. | ||
Synthesis of compound 4
Into a 100 mL flask were added 3 (1.5 g, 4.3 mM), potassium carbonate (771 mg, 1.7 mM), 1,4-dibromobutane (0.6 mL, 5 mM) and acetone (50 mL); the mixture was refluxed overnight. After the reaction, the mixture was cooled to room temperature and concentrated by a rotary evaporator, and then the crude product was purified by a silica gel column using chloroform/petroleum ether (1/5, v/v) as eluent to afford a white solid (1.66 g, 80% yield). 1H NMR (CDCl3, 300 MHz), δ (TMS, ppm): 7.15–6.99 (m, 15H, Ar–H), 6.93 (m, 2H, Ar–H), 6.62 (m, 2H, Ar–H), 3.91 (t, J = 9.3 Hz, 2H, –O–CH2–), 3.47 (t, J = 9.9 Hz, 2H, –CH2–Br), 2.04 (m, 2H, –CH2–), 1.89 (m, 2H, –CH2–).Synthesis of TPE–C4N3
Into a 50 mL Schlenk tube were added 4 (1.45 g, 3 mM), sodium azide (390 mg, 6 mM), and DMF (3 mL); the mixture was stirred at 80 °C overnight. After the reaction, the mixture was cooled down to room temperature and poured into water, the solid was filtrated and the crude product was purified by a silica gel column using chloroform/petroleum ether (1/5, v/v) as eluent to afford a yellow solid (1.2 g, 90% yield). 1H NMR (CDCl3, 300 MHz), δ (TMS, ppm): 7.07–7.02 (m, 15H, Ar–H), 6.93 (m, 2H, Ar–H), 6.62 (m, 2H, Ar–H), 3.91 (t, 2H, –O–CH2–), 3.34 (t, 2H, –CH2–N3), 1.85 (m, 2H, –CH2–), 1.79 (m, 2H, –CH2–). 13C NMR (CDCl3, 75 MHz), δ (TMS, ppm): 157.9, 144.57, 144.48, 141.06, 140.62, 136.64, 133.09, 131.86, 128.28, 128.17, 126.91, 126.80, 114.12, 67.35, 51.56, 26.97, 26.23. Anal. Calcd for C30H27N3O: C, 80.87; H, 6.11; N, 9.43. Found: C, 80.90; H, 6.10; N, 9.05.Functionalization of graphene by TPE–C4N3
Into a baked 100 mL Schlenk tube with a stopcock in the sidearm were added graphene (10 mg), and o-dichlorobenzene (10 mL). The tube was evacuated under vacuum and then flushed with argon three times through the sidearm. After being sonicated for 20 min at room temperature, TPE–C4N3 (250 mg) was added, and the black suspension was heated to 110 °C under argon protection and stirred for 3 days. When the reaction was finished, it was cooled to room temperature, the insoluble dark solid was filtered out, which was further washed with THF for several times, and named as TPE–C4N3–G–In; the soluble part was purified by a silica gel column using chloroform/petroleum ether (1/5, v/v) to remove excess TPE–C4N3. The one left was named as TPE–C4N3–G–S. Finally, TPE–C4N3–G–In (6 mg) and TPE–C4N3–G–S (103 mg) were yielded after drying under vacuum at 40 °C.Results and discussion
Graphene was synthesized via the chemical reduction of graphene oxide at a low-temperature (exfoliation temperature as low as 200 °C) under a negative pressure environment.19 TPE–C4N3 was synthesized as shown in Chart 1. The preparation of graphene functionalized by TPE–C4N3 was depicted in Scheme 1. After the reaction was completed, the mixture was filtrated and the solution exhibited a dark color (TPE–C4N3–G–S, B in Scheme 1), indicating the presence of graphene, and it was stable for at least two months. TPE–C4N3–G–S was soluble in common organic solvents, such as THF, DMF, CHCl3 and acetone, but insoluble in ethanol, methanol and water, similar to TPE–C4N3. Besides, TPE–C4N3–G–In also showed good dispersion stability. As shown in Fig. S3, ESI† after sonication, the dispersion of graphene sheets in THF could stay for only 5 min, and 30 min later, graphene was nearly totally precipitated at the bottom of bottle, but TPE–C4N3–G–In was stable with no sediment. The dispersibility of TPE–C4N3–G–In in other solvents, including polar and nonpolar solvents (toluene, DMF, CHCl3, ethanol and acetone) were also tested in detail (Fig. S4–S5, ESI†). With the aid of covalent functionalization by TPE–C4N3, the solubility was much improved. Stable dispersions of TPE–C4N3–G–In were formed just by shaking without sonication. After standing for 15 min, except for acetone and toluene, no precipitate was found. For comparison, the dispersion stability of graphene was also studied, though some reports demonstrated that graphene itself had certain solubility in organic solvents,20 and our results displayed limited solubility, which might be related to its dimensions. As shown in Fig. S4, ESI† the graphene dispersion in DMF was stable, but in all the other solvents formed clear solutions 15 min later. In addition, we also studied the dispersibility with a mild sonication for 5 min (Fig. S5, ESI†). In contrast with graphene, TPE–C4N3–G–In displayed good dispersion stability in both polar and nonpolar solvents. Taking the low boiling point solvent CHCl3 for example, the solubility of TPE–C4N3–G–In was about 0.3 mg mL−1, while the control experiment showed that graphene could not form a stable dispersion. It is known that graphene is unstable in nonpolar solvents (e.g., toluene). The TPE–C4N3–G–In dispersion in toluene also displayed improved dispersion stability even after standing for 1 h when compared to graphene. These results demonstrate that our methods are effective in improving the solubility or dispersibility of graphene.The successful grafting of TPE–C4N3 onto graphene could be partially proved by their IR spectra (Fig. 1). Comparing with TPE–C4N3, the apparent peak centered at ~2100 cm−1, assigned to the stretching vibration of the azido groups, disappeared in the IR spectrum of TPE–C4N3–G–S, which is attributed to its reaction with graphene. Besides, almost all the typical bands of TPE–C4N3 could be found in TPE–C4N3–G–S: the bands at 1600, 1572 and 1514 cm−1 should be ascribed to the stretching vibration of the skeleton of the aromatic rings, 1450 and 1370 cm−1 are the scissor vibrations of the methylene groups, with the asymmetrical and symmetrical C–H stretching vibration of the methylene groups at 2929 and 2875 cm−1, and in the fingerprint region, the bands at 761 and 699 cm−1 demonstrated the monosubstituted phenyl. In addition, a new peak at 1700 cm−1 appeared, which could be ascribed to the C![[double bond, length as m-dash]](https://www.rsc.org/images/entities/char_e001.gif) O stretching vibration of graphene, due to the incomplete reduction process. These results indicated that TPE–C4N3 was covalently grafted to graphene.
O stretching vibration of graphene, due to the incomplete reduction process. These results indicated that TPE–C4N3 was covalently grafted to graphene.
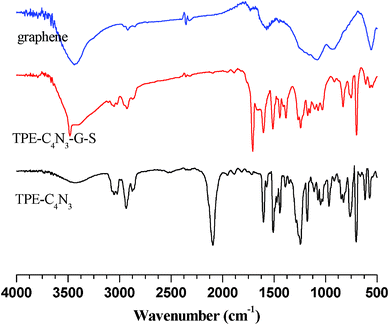 | ||
| Fig. 1 IR spectra of TPE–C4N3, graphene and TPE–C4N3–G–S. | ||
Raman spectra of the samples were taken using 633 nm laser excitation. Unfortunately, only those of graphene and TPE–C4N3–G–In were obtained (Fig. S6, ESI†), and we failed to get the Raman spectrum of TPE–C4N3–G–S. The possible reason is the presence of TPE–C4N3, whose fluorescence signal is higher than the Raman signal under the same conditions. The intensity ratio of the D and G bands (ID/IG) is often used as an indicator for the level of chemical modification. The Raman spectrum of TPE–C4N3–G–In showed a disorder mode with a ratio of 1.1, a little higher than that of graphene (1.0), possibly due to the distribution of the functional groups on the surface or an effect of the size of the sheets. The G band of TPE–C4N3–G–In shifted from 1590 to 1593 cm−1, this blue shift was ascribed to the influence of defects or isolated double bonds.21 XRD patterns of TPE–C4N3, TPE–C4N3–G–S and graphene were also studied (Fig. S7, ESI†). Graphene displayed a typical peak at 2θ = 25.32° with an inter-planar spacing of 3.5 Å, while, after modification, TPE–C4N3–G–S showed a broaden band at 20.68°, and the d-spacing increased to 4.3 Å, which should be ascribed to the covalent modification by TPE–C4N3.
The presence of graphene could be detected by HRTEM (Fig. 2). The morphology of TPE–C4N3–G–S exhibited a large graphene sheet with many wrinkles, with a dimension ranging from 500 nm to micrometers. We also used TPE–C4N3 for comparison (Fig. S8, ESI†), because the small molecule could not endure the irradiation of the powerful electron beam, coffee-ring-like photographs were taken. Combining these two images, the grafting of TPE–C4N3 to graphene could be further confirmed. For the measurement of AFM, we failed to get the result of graphene itself, perhaps because of its bad processablity. Fortunately, we got the result of TPE–C4N3–G–In easily (Fig. 3). The average thickness of TPE–C4N3–G–In was about 4–5 nm, the height of single layer graphene sheet was about 1 nm, thus, this increase suggested that the molecules were covalently attached to both sides of the graphene, which was in good accordance with the reported literature.15b,16d In principle, there was another possibility that bi-layer or multi-layer structures of graphene were obtained.
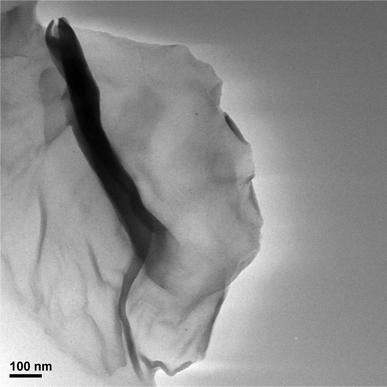 | ||
| Fig. 2 TEM image of TPE–C4N3–G–S. | ||
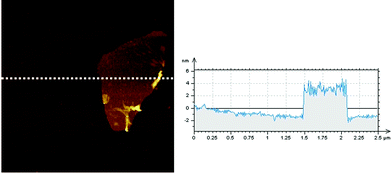 | ||
| Fig. 3 AFM image of TPE–C4N3–G–In, scan size:2 μm×2 μm. | ||
Because TPE–C4N3–G–S was totally soluble in organic solvents, we also tested its photochemical properties. TPE–C4N3 is a well-known type of aggregation-induced emission (AIE) molecule with a special character: it is nonluminescent in solutions, but highly emissive in the aggregation state or in the solid state.22 Examination of the AIE properties was carried out in a mixture of water-tetrahydrofuran under different water fractions (Fig. S9–S10, ESI†). TPE–C4N3 was insoluble in water, so increasing the water fraction could change the existing form from solution to the aggregated state, and the non-emissive TPE–C4N3 became highly emissive as a result of the restriction of its phenyl rotors in the aggregation state. The fluorescence (FL) intensity of TPE–C4N3 was significantly enhanced when the water fraction exceeded 90%, and at the fraction of 99%, the FL intensity increased 20 fold, but for TPE–C–4N3–G–S, no obvious change occured. The FL intensity of TPE–C4N3–G–S was quenched (about 80%) by the presence of graphene (Fig. 4), indicating the strong electronic interaction between TPE–C4N3 and graphene. UV-vis absorption spectra of TPE–C4N3 and TPE–C4N3–G–S were measured (Fig. S11, ESI†) and the spectrum of TPE–C4N3–G–S showed its absorption peak at 315 nm, which is similar to that of TPE–C4N3 and gave no changes after modification.
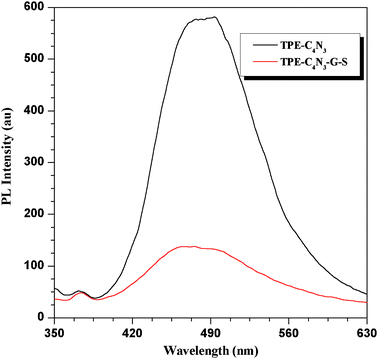 | ||
| Fig. 4 Fluorescence spectra of TPE–C4N3 and TPE–C4N3–G–S in a H2O/THF mixture with 99% of water (v/v). | ||
We also used 13C and 1H NMR spectra to characterize TPE–C4N3 and TPE–C4N3–G–S (Fig. S12–S15, ESI†), the peak at 51.56 ppm disappeared, which was the carbon atoms linked to the azido group, demonstrating that azido was thermally generated and reacted with graphene. In the preparation process of graphene, the oxygen functional groups of GO could not be totally reduced; generally, some oxygen-containing groups were left even under strict reaction conditions, such as CO-type oxygen and epoxy (1, 2-ether) groups. In the 13C NMR spectrum of TPE–C4N3–G–S, resonances at 178.34, 68.87 and 108.14 ppm appeared, and these could be possibly assigned to the ketones, epoxy (1,2-ether) groups and graphitic carbons in graphene, respectively.23
For the sake of determining the extent of TPE–C4N3 grafting, thermo-gravimetric analysis (TGA) of TPE–C4N3–G–S was performed over the temperature range of 20–600 °C in an argon atmosphere. Fig. 5 displays the thermograms of graphene, TPE–C4N3 and TPE–C4N3–G–S. The overall weight loss of graphene was 15%, showing its good thermal stability, while TPE–C4N3 showed poor stability with respect to graphene, with a total weight loss of about 95%. In the temperature range of 320–495 °C, the weight loss of TPE–C4N3–G–S could be attributed to the decomposition of TPE–C4N3 with a weight loss of 44%, indicating the degree of functionalization was one functional group per 48 carbons, and a moderate grafting efficiency was achieved according to the reported literature.15 Additionally, in order to explain the different solubility of TPE–C4N3–G–S and TPE–C4N3–G–In, the TGA curve for TPE–C4N3–G–In was also collected (Fig. S16, ESI†). It displayed a total weight loss of 22%, which is similar to that of graphene. In the temperature range of 320 to 495 °C, the weight loss of graphene, TPE–C4N3 and TPE–C4N3–G–In was 4.49%, 68.93% and 7.9%, respectively, and the content of the TPE–C4N3 moieties in TPE–C4N3–G–In was calculated to be only 5.3%, which was much lower than TPE–C4N3–G–S. Therefore, the different functional efficiency accounted for their different solubilities.
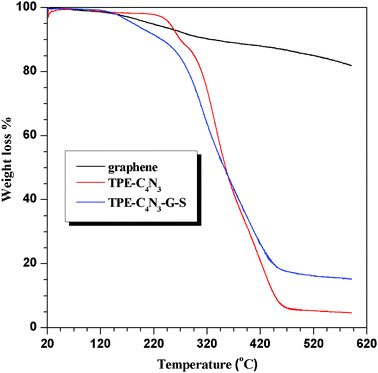 | ||
| Fig. 5 Thermo-gravimetric analysis of graphene, TPE–C4N3 and TPE–C4N3–G–S. | ||
In order to confirm our concept, we used PB–N3 and TPP–C4N3 for comparison, and a weak dispersion stability was observed for both of them (Fig. S17, ESI†). The reaction solutions of PB–N3 and TPP–C4N3 could stay for no more than one week, while TPE–C4N3 lasted for at least two months. Although the pyrene moiety has been reported to have a strong affinity with graphene via π-stacking, the small stereospecific blockade could not overcome the large interlayer cohesive energies: for TPP–C4N3 the stereospecific blockade is larger than PB–N3, but the π-interactions are weaker. TPE–C4N3 has the merits of both PB–N3 and TPP–C4N3, and thus has the best activity towards graphene. At the same time, the experiment in our article actually demonstrated that TPE–C4N3 effectively improved the solubility or dispersibility of graphene. In order to confirm that large steric hindrance was important to improve the solubility of graphene, we also performed molecular calculations on their energy levels based on DFT/B3LYP/6-31G(d): the optimized configurations of TPE–C4N3, PB–N3 and TPP–C4N3 are shown in Fig. 6. PB–N3 was totally flat, but TPE–C4N3 and TPP–C4N3 had twisted conformations and the dihedral angles between CC and each of the phenyl rings of TPE–C4N3 were in the range from 48 to 68°, larger than TPP–C4N3, which was in the range of 38 to 48°. When graphene is grafted by TPE–C4N3, the non-planar conformation of TPE–C4N3 helps to reduce the π–π stacking of the graphene sheets and enhance its solubility or dispersion stability. This result further confirmed that our concept about the functionalization of graphene was correct.
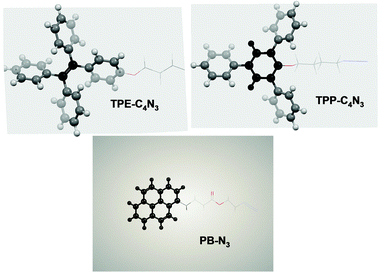 | ||
| Fig. 6 Optimized configurations of TPE–C4N3, PB–N3 and TPP–C4N3. | ||
Conclusions
In summary, we have reported that molecules having the characteristics of stereospecific blockades and rich π-electron frameworks could efficiently improve the dispersion stability of graphene. In this article, TPE–C4N3 was covalently attached to graphene using nitrene chemistry and soluble graphene was prepared successfully. By the way, this method presented here could be expanded to other molecules, which may open up a new avenue for the synthesis of graphene-based materials and nanodevice fabrications.Acknowledgements
We are grateful to the National Fundamental Key Research Program (2011CB932702) and the National Natural Science Foundation of China (No. 21161160556) for financial support, and the Centre for Electron Microscopy of Wuhan University for the aid of TEM tests.References
- K. S. Novoselov, A. K. Geim, S. V. Morozov, D. Jiang, Y. Zhang, S. V. Dubonos, I. V. Grigorieva and A. A. Firsov, Science, 2004, 306, 666–669 CrossRef CAS.
- (a) K. S. Novoselov, A. K. Geim, S. V. Morozov, D. Jiang, M. I. Katsnelson, I. V. Grigorieva, S. V. Dubonos and A. A. Firsov, Nature, 2005, 438, 197–200 CrossRef CAS; (b) A. A. Balandin, S. Ghosh, W. Bao, I. Calizo, D. Teweldebrhan, F. Miao and C. N. Lau, Nano Lett., 2008, 8, 902–907 CrossRef CAS; (c) C. Lee, X. Wei, J. W. Kysar and J. Hone, Science, 2008, 321, 385–388 CrossRef CAS.
- (a) D. A. C. Brownson and C. E. Banks, Chem. Commun., 2012, 48, 1425–1427 RSC; (b) D. Yu and L. Dai, J. Phys. Chem. Lett., 2010, 1, 467–470 CrossRef CAS.
- (a) Z. Liu, Q. Liu, Y. Huang, Y. Ma, S. Yin, X. Zhang, W. Sun and Y. Chen, Adv. Mater., 2008, 20, 3924–3930 CrossRef CAS; (b) X. Wang, L. Zhi and K. Müllen, Nano Lett., 2008, 8, 323–327 CrossRef CAS; (c) J. Wu, H. A. Becerril, Z. Bao, Z. Liu, Y. Chen and P. Peumans, Appl. Phys. Lett., 2008, 92, 263302 CrossRef.
- (a) C. Di, D. Wei, G. Yu, Y. Liu, Y. Guo and D. Zhu, Adv. Mater., 2008, 20, 3289–3293 CrossRef CAS; (b) S. Gilje, S. Han, M. Wang, K. L. Wang and R. B. Kaner, Nano Lett., 2007, 7, 3394–3398 CrossRef CAS; (c) H. Li, Q. Zhang, C. Liu, S. Xu and P. Gao, ACS Nano, 2011, 5, 3198–3203 CrossRef CAS.
- (a) Y. Chen, Y. Li, D. Sun, D. Tian, J. Zhang and J. Zhu, J. Mater. Chem., 2011, 21, 7604–7611 RSC; (b) H. Chang, L. Tang, Y. Wang, J. Jiang and J. Li, Anal. Chem., 2010, 82, 2341–2346 CrossRef CAS; (c) G. Zeng, Y. Xing, J. Gao, Z. Wang and X. Zhang, Langmuir, 2010, 26, 15022–15026 CrossRef CAS; (d) Y. Ohno, K. Maehashi and K. Matsumoto, J. Am. Chem. Soc., 2010, 132, 18012–18013 CrossRef CAS.
- (a) D. W. Lee, T. Kim and M. Lee, Chem. Commun., 2011, 47, 8259–8261 RSC; (b) Y. Xu, H. Bai, G. Lu, C. Li and G. Shi, J. Am. Chem. Soc., 2008, 130, 5856–5857 CrossRef CAS; (c) Q. Yang, X. Pan, F. Huang and K. Li, J. Phys. Chem. C, 2010, 114, 3811–3816 CrossRef CAS.
- S. Stankovich, R. D. Piner, S. T. Nguyen and R. S. Ruoff, Carbon, 2006, 44, 3342–3347 CrossRef CAS.
- S. Niyogi, E. Bekyarova, M. E. Itkis, J. L. McWilliams, M. A. Hamon and R. C. Haddon, J. Am. Chem. Soc., 2006, 128, 7720–7721 CrossRef CAS.
- H. Yang, C. Shan, F. Li, D. Han, Q. Zhang and L. Niu, Chem. Commun., 2009, 3880–3882 RSC.
- (a) Y. Xu, Z. Liu, X. Zhang, Y. Wang, J. Tian, Y. Huang, Y. Ma, X. Zhang and Y. Chen, Adv. Mater., 2009, 21, 1275–1279 CrossRef CAS; (b) Z. Liu, Y. Xu, X. Zhang, X. Zhang, Y. Chen and J. Tian, J. Phys. Chem. B, 2009, 113, 9681–9686 CrossRef CAS.
- (a) O. C. Compton, D. A. Dikin, K. W. Putz, L. C. Brinson and S. T. Nguyen, Adv. Mater., 2009, 21, 1–5 Search PubMed; (b) Y. Zhang, L. Ren, S. Wang, A. Marathe, J. Chaudhuri and G. Li, J. Mater. Chem., 2011, 21, 5386–5391 RSC; (c) D. R. Dreyer, S. Park, C. W. Bielawski and R. S. Ruoff, Chem. Soc. Rev., 2010, 39, 228–240 RSC.
- X. Zhong, J. Jin, S. Li, Z. Niu, W. Hu, R. Li and J. Ma, Chem. Commun., 2010, 46, 7340–7342 RSC.
- (a) J. R. Lomeda, C. D. Doyle, D. V. Kosynkin, W. Hwang and J. M. Tour, J. Am. Chem. Soc., 2008, 130, 16201–16206 CrossRef CAS; (b) Z. Jin, T. P. McNicholas, C. Shih, Q. Wang, G. L. C. Paulus, A. J. Hilmer, S. Shimizu and M. S. Strano, Chem. Mater., 2011, 23, 3362–3370 CrossRef CAS; (c) H. Wang, K. Zhou, Y. Xie, J. Zeng, N. Chai, J. Li and H. Zhang, Chem. Commun., 2011, 47, 5747–5749 RSC.
- (a) M. Quintana, K. Spyrou, M. Grzelczak, W. R. Browne, P. Rudolf and M. Prato, ACS Nano, 2010, 4, 3527–3533 CrossRef CAS; (b) V. Georgakilas, A. B. Bourlinos, R. Zboril, T. A. Steriotis, P. Dallas, A. K. Stubos and C. Trapalis, Chem. Commun., 2010, 46, 1766–1768 RSC.
- (a) L. Liu, M. M. Lerner and M. Yan, Nano Lett., 2010, 10, 3754–3756 CrossRef CAS; (b) L. Liu and M. Yan, J. Mater. Chem., 2011, 21, 3273–3276 RSC; (c) J. Choi, K. Kim, B. Kim, H. Lee and S. Kim, J. Phys. Chem. C, 2009, 113, 9433–9435 CrossRef CAS; (d) T. A. Strom, E. P. Dillon, C. E. Hamilton and A. R. Barron, Chem. Commun., 2010, 46, 4097–4099 RSC.
- X. Xu, Q. Luo, W. Lv, Y. Dong, Y. Lin, Q. Yang, A. Shen, D. Pang, J. Hu, J. Qin and Z. Li, Macromol. Chem. Phys., 2011, 212, 768–773 CrossRef CAS.
- M. Banerjee, S. J. Emond, S. V. Lindeman and R. Rathore, J. Org. Chem., 2007, 72, 8054–8061 CrossRef CAS.
- W. Lv, D. Tang, Y. He, C. You, Z. Shi, X. Chen, C. Chen, P. Hou, C. Liu and Q. Yang, ACS Nano, 2009, 3, 3730–3736 CrossRef CAS.
- (a) U. Khan, A. O'Neill, M. Lotya, S. De and J. N. Coleman, Small, 2010, 6, 864–871 CrossRef CAS; (b) Y. Hernandez, V. Nicolosi, M. Lotya, F. M. Blighe, Z. Sun, S. De, I. T. Mcgovern, B. Holland, M. Byrne, Y. K. Gun'ko, J. J. Boland, P. Niraj, G. Duesberg, S. Krishnamurthy, R. Goodhue, J. Hutchison, V. Scardaci, A. C. Ferrari and J. N. Coleman, Nat. Nanotechnol., 2008, 3, 563–568 CrossRef CAS; (c) A. O'Neill, U. Khan, P. N. Nirmalraj, J. Boland and J. N. Coleman, J. Phys. Chem. C, 2011, 115, 5422–5428 CrossRef CAS.
- K. N. Kudin, B. Ozbas, H. C. Schniepp, R. K. Prud'homme, I. A. Aksay and R. Car, Nano Lett., 2008, 8, 36–41 CrossRef CAS.
- (a) Y. Liu, Y. Tang, N. N. Barashkov, I. S. Irgibaeva, J. W. Y. Lam, R. Hu, D. Birimzhanova, Y. Yu and B. Z. Tang, J. Am. Chem. Soc., 2010, 132, 13951–13953 CrossRef CAS; (b) Y. N. Hong, J. W. Y. Lam and B. Z. Tang, Chem. Commun., 2009, 4332–4353 RSC.
- K. Zhang, L. Zhang, X. Zhao and J. Wu, Chem. Mater., 2010, 22, 1392–1401 CrossRef CAS.
Footnote |
| † Electronic supplementary information (ESI) available: details of the experimental procedures for PB-N3 and TPP-C4N3, Raman, UV-vis, FL spectra, 13C NMR, 1H NMR, and TEM images. See DOI: 10.1039/c2ra20460f |
| This journal is © The Royal Society of Chemistry 2012 |