Electrical properties, thermodynamic behavior, and defect analysis of Lan+1NinO3n+1+δ infiltrated into YSZ scaffolds as cathodes for intermediate-temperature SOFCs
Seonyoung
Yoo
a,
Sihyuk
Choi
a,
Jeeyoung
Shin
b,
Meilin
Liu
c and
Guntae
Kim
*a
aInterdisciplinary School of Green Energy, and KIER-UNIST Advanced Center for Energy, Ulsan National Institute of Science and Technology (UNIST), Ulsan 689-798, Korea. E-mail: gtkim@unist.ac.kr; Fax: +82 52 217 2909.
bDepartment of Mechanical Engineering, Dong-Eui University, 995 Eomgwangno, Busan-jin-gu, Busan 614-714, Korea.
cSchool of Materials Science and Engineering, Georgia Institute of Technology, 771 Ferst Drive, N.W., Atlanta, GA 30332-0245, USA.
First published on 10th April 2012
Introduction
A solid oxide fuel cell (SOFC) is an electrochemical device for chemical-to-electrical energy conversion with high efficiency, low emissions, and excellent fuel flexibility. The requirement for high operating temperatures (1073–1273 K) of conventional SOFCs, however, leads to notable problems such as high costs and high rates of degradation due to interactions between cell components during cell fabrication and operation. To overcome these problems, much effort has been devoted to lowering the SOFC operating temperature toward an intermediate range (873 to 1073 K). One of the challenges for IT-SOFC is to develop cathode materials with high electrocatalytic activity for oxygen reduction at these temperatures.1–5While La1−xSrxMnO3 (LSM) has been widely used as a cathode material for SOFCs based on YSZ electrolytes at high temperatures,3,4 it is inadequate for use in an intermediate temperature range due to reduced ionic and electronic conductivity and diminished catalytic activity at lower temperatures.5–7
Recently, mixed ionic and electronic conductors (MIECs) have received tremendous attention as potential cathodes for IT-SOFCs. MIECs based on transition metal (e.g. Mn, Fe, Co, and Ni) oxides have been extensively investigated. Among various MIECs, cobalt containing oxides showed superior electrocatalytic activity than oxides with predominant electronic conductivity (and little ionic conductivity) such as lanthanum manganese. In particular, La1−xSrxCo1−yFeyO3−δ (LSCF)-based cathodes have attracted much attention for IT-SOFCs. However, the long-term stability of LSCF-based cathodes is still a concern.6–8
As a mixed conductor derived from the K2NiF4-type materials, La2NiO4 has attracted significant attention for possible application as IT-SOFC cathodes. Its advantages include high oxygen ionic and electronic conductivity, moderate thermal expansion coefficient (TEC), and high electrocatalytic activity toward oxygen reduction under oxidizing conditions.9–11 Other materials such as lanthanum cobaltite perovskite also exhibit good conductivities; however, the large thermal expansion mismatch with other cell components may lead to thermo-mechanical problems.
Ruddlesden–Popper compounds are comprised of alternating perovskite and rock-salt layers, as shown in Fig. 1. The number of perovskite layers increases with n in this structure, leading to the formation of higher order Ruddlesden–Popper phases, La3Ni2O7 and La4Ni3O10, which is argued to allow faster ionic and electronic transport.6,11,12 These effects are primarily attributed to increased concentration of Ni–O–Ni bonds, which are responsible for electronic conduction due to progressive delocalization of the p-type electronic charge carriers, and enhanced vacancy-migration or oxygen ion diffusivity.4,11,12 Currently, many of the studies on Lan+1NinO3n+1+δ (n = 1, 2, or 3) focused on the structure and electrochemical properties of the bulk phases, with little attention to the basic thermodynamic properties. To date, the characteristics of Lan+1NinO3n+1+δ infiltrated into a scaffold of YSZ and the actual configuration of a porous cathode fabricated by infiltration, are still unknown. Because of the unique microstructures and possible interactions between the two phases, the behaviour of this Lan+1NinO3n+1+δ–YSZ could be very different from that of a pure Lan+1NinO3n+1+δ phase. Further, redox properties related to oxygen thermodynamics such as oxidation enthalpies and entropies of Lan+1NinO3n+1+δ (n = 1, 2, and 3), and redox stability have not been reported for the intermediate temperature range.
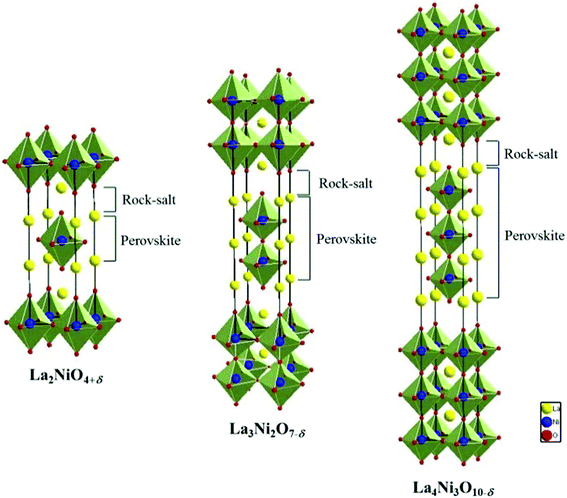 | ||
| Fig. 1 The structure of Lan+1NinO3n+1 (n = 1, 2, and 3). | ||
In this study, we characterized non-stoichiometric variations of oxygen and electrical conductivities of Lan+1NinO3n+1+δ (n = 1, 2, and 3) infiltrated into porous YSZ as a function of oxygen partial pressure in a temperature range of 923–1023 K. Redox behavior was evaluated using coulometric titration and the electrical conductivity was determined using 4-probe conductivity measurement.
Experimental
Lan+1NinO3n+1 (n = 1, 2, and 3)–YSZ slabs were prepared by the infiltration of Lan+1NinO3n+1 (n = 1, 2, and 3) into a porous YSZ (Tosoh corp. TZ-8Y) slab. The porous YSZ slab was prepared by mixing YSZ powder, dispersant (Duramax3005, Rohm & Haas), binder (HA-12 and B-1000, Rohm & Haas), and pore former (graphite, Alfa Aeser, 325 mesh). This solution of YSZ slurry was dried and sintered afterwards at 1773 K to yield porous YSZ with 65% porosity. Stoichiometric amounts of La(NO3)3·6H2O (Aldrich, 99.9%), Ni(NO3)2·6H2O (Aldrich), and citric acid were dissolved in distilled water, which were infiltrated into the porous YSZ up to higher than 45 wt% loading. After firing in air at 723 K and 1123 K, a Lan+1NinO3n+1 (n = 1, 2, and 3) phase was formed in the porous YSZ.The Lan+1NinO3n+1 (n = 1, 2, and 3) were characterized using X-ray diffraction (XRD) and scanning electron microscopy (SEM). X-Ray powder diffraction measurements (Rigaku diffractometer, Cu Ka radiation) were performed to confirm the structure with a scan rate of 0.5° min−1 and a range of 20° < 2θ < 60°.
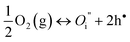
The oxidation/reduction state can be characterized precisely by coulometric titration as a function of p(O2).13,14 This involves placing the oxide sample in a sealed container, separated from the atmosphere by an O2−-conducting membrane such as yttria-stablized zirconia (YSZ). The YSZ tube (McDanel Advanced Ceramic Technologies, Z15410630) was used both to pump oxygen out of the system and to sense the equilibrium p(O2) inside the tube. Lan+1NinO3n+1 (n = 1, 2, and 3) were located in a sealed container at various temperatures of interest and equilibrated by subjecting it to a flow of 5% O2 in Ar. The sample was then isolated in the tube and the equilibrium p(O2) was measured with an oxygen sensor. Electrodes on both sides of the YSZ tube were used to measure the potential across the membrane, and the potential could be related to the p(O2) through the Nernst equation. A specific amount of charge could be passed across the tube using a BioLogic Potentiostat, with 1 coulomb of charge being equivalent to 2.6 μmol of O2.
The electrical conductivity of the slabs, 2 mm × 5 mm × 10 mm in size, was measured in air by the four-probe method with a BioLogic Potentiostat. The measurements were performed starting from 1023 to 373 K with 323 K measurement intervals.
Results and discussion
1. XRD and SEM
Shown in Fig. 2 are typical XRD patterns of Lan+1NinO3n+1 (42 wt%)–YSZ fired at 1123 K, suggesting that the Lan+1NinO3n+1 compounds have a Ruddlesden–Popper structure and the two main phases are Lan+1NinO3n+1 and YSZ without observable peaks of other phases. The XRD data suggest that there were no observable chemical reactions between Lan+1NinO3n+1 and YSZ under the processing conditions.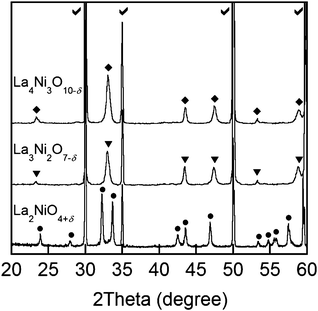 | ||
| Fig. 2 XRD patterns of Lan+1NinO3n+1 (n = 1, 2, and 3)–YSZ sintered at 1123 K: each symbol indicates Lan+1NinO3n+1 (n = 1, 2, and 3), La2NiO4+δ (•), La3Ni2O7−δ (▼), La4Ni3O10−δ (♦), and YSZ (✓). | ||
As is well known, the microstructure of an electrode may influence the reaction kinetics, charge and mass transport processes, and hence fuel cell performance. For example, three phase boundaries (TPBs) at the electrode/electrolyte interfaces are the most active sites for electrochemical reactions in SOFCs. Smaller grain size often results in longer TPB length and potentially higher electrochemical performance.13 SEM images of the Lan+1NinO3n+1–YSZ fired at 1123 K are presented in Fig. 3a, b, and c, respectively, for n = 1, 2, and 3. It is clearly seen that the grain size of the Lan+1NinO3n+1 becomes smaller with the increasing value of n.
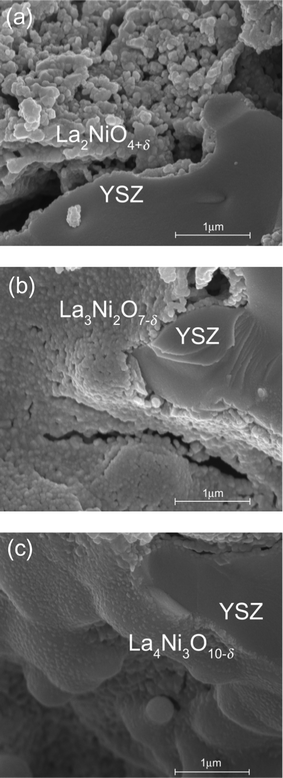 | ||
| Fig. 3 SEM images of the (a) La2NiO4+δ–YSZ, the (b) La3Ni2O7−δ–YSZ, and the (c) La4Ni3O10−δ–YSZ annealed at 1123 K. | ||
2. Thermodynamic characterization
Shown in Fig. 4 are the equilibrium oxygen non-stoichiometries for Lan+1NinO3n+1 infiltrated in YSZ determined by coulometric titration14,15 as a function of p(O2) in a temperature range of 923–1023 K. In general, oxygen interstitials (Oi′′) are considered the dominating defects for n = 1 whereas oxygen vacancies (Vo••) are the main defects for n = 2 and 3 due to the increase of perovskite layers in the structure.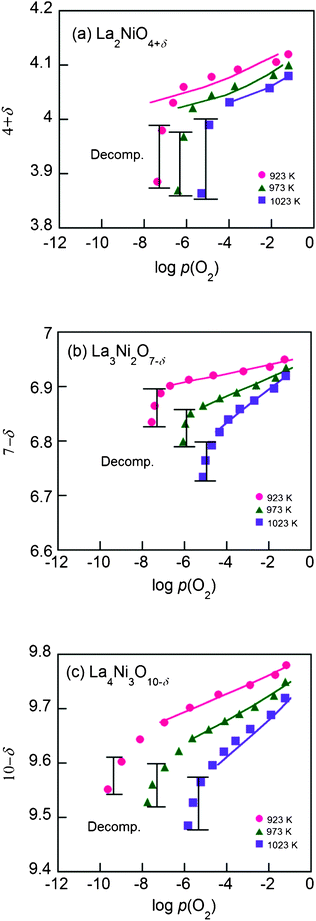 | ||
| Fig. 4 The isotherms of the Lan+1NinO3n+1 (n = 1, 2, and 3)–YSZ at 923–1023 K, (a) La2NiO4+δ, (b) La3Ni2O7−δ and (c) La4Ni3O10−δ. The solid curves are fitting curves calculated by the proposed defect model using data only before decomposition. | ||
There is a considerable change in oxygen non-stoichiometry throughout the p(O2) range for all compounds. The data show that the isotherms of Lan+1NinO3n+1–YSZ (n = 1, 2, and 3) have similar shapes, suggesting that the reduction mechanisms of the scaffolds are quite similar. As temperature decreases, the decomposition p(O2) becomes lower. With an increase of n, the isotherms are extended to the left, indicating that La4Ni3O10−δ has higher redox stability than La2NiO4+δ down to a lower p(O2) at the same temperature. This is due possibly to the higher number of perovskite layers in La4Ni3O10−δ and, accordingly, stronger interaction between the molecules in the lattice.
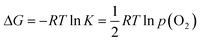
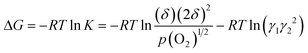
The partial molar enthalpy and entropy of oxygen can be calculated from the slopes of the isotherms. The Gibbs free energy, ΔG, is related to the equilibrium constant, K, and p(O2) as follows,
 | (1) |
At a constant δ, the partial molar enthalpy of oxygen at various temperatures is shown by the Gibbs–Helmholtz equation.
 | (2) |
And the partial molar entropy can be obtained by using the Maxwell relation as follows.
 | (3) |
The partial enthalpies of oxidation for the Lan+1NinO3n+1–YSZ (n = 1, 2, and 3), calculated from eqn (2), are presented in Fig. 5. The oxidation enthalpies (−ΔH) are a strong function of oxygen non-stoichiometry in Lan+1NinO3n+1 (n = 1, 2, and 3).
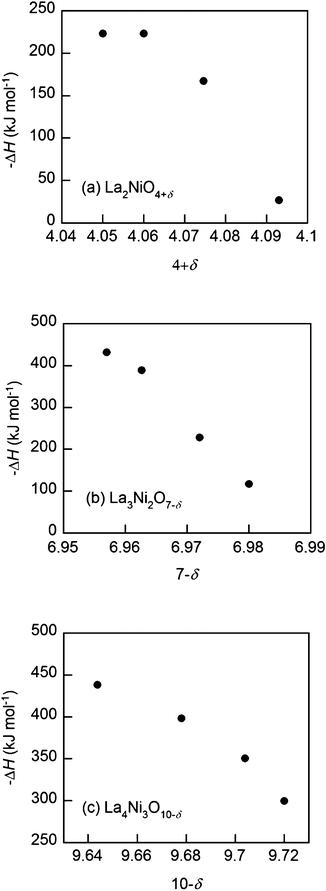 | ||
| Fig. 5 Partial molar enthalpy of oxidation (−ΔH) at 973 K of the Lan+1NinO3n+1 (n = 1, 2, and 3)–YSZ, (a) La2NiO4+δ, (b) La3Ni2O7−δ and (c) La4Ni3O10−δ. | ||
The partial molar enthalpies of oxidation at 10−5 atm are plotted in Fig. 6. The higher partial molar enthalpy for La4Ni3O10−δ–YSZ relative to that of Lan+1NinO3n+1 (n = 1 and 2) means that it would be more stable at roughly the same p(O2).
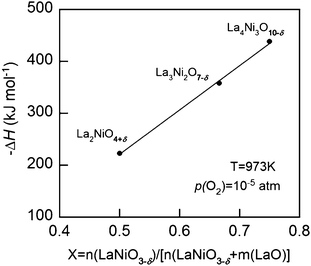 | ||
| Fig. 6 Partial molar enthalpy of oxidation (−ΔH) at 973 K of the Lan+1NinO3n+1 (n = 1, 2, and 3)–YSZ at p(O2) = 10−5 atm. | ||
The partial molar entropies of oxidation, calculated from the differences in the Gibbs free energies and the enthalpies, are presented in Fig. 7. The values of −ΔS become smaller for higher δ, implying that the probability for interstitial oxygen formation decreases with excess oxygen. In other words, there are fewer sites for the interstitial oxygen formation reaction in the scaffolds as the amount of excess oxygen increases (Fig. 7a).9,15–17
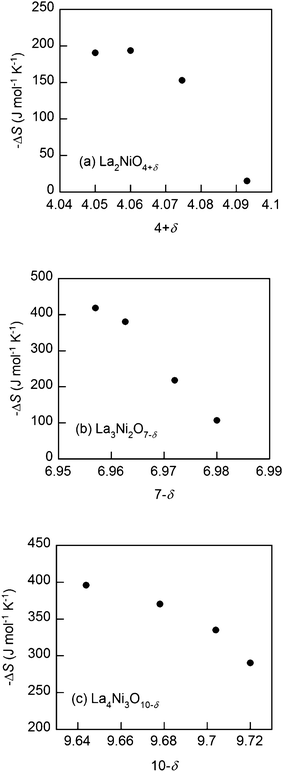 | ||
| Fig. 7 Partial molar entropy of oxidation (−ΔS) at 973 K of the Lan+1NinO3n+1 (n = 1, 2, and 3)–YSZ, (a) La2NiO4+δ, (b) La3Ni2O7−δ and (c) La4Ni3O10−δ. | ||
It can also be argued that fewer sites will be available for oxygen vacancy formation in the scaffolds as the concentration of oxygen vacancies increases. This is consistent with the finding that the values of −ΔS become smaller for higher δ (Fig. 7b and c).9,18
3. Defect analysis
 | (4) |
Thus, electroneutrality approximation requires that the number of electron holes should be about twice the number of oxygen interstitials.
| [h•] = 2[Oi′′] = 2δ | (5) |
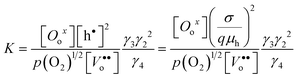
In terms of δ and p(O2), the equilibrium constant for eqn (4) can be expressed as
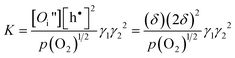 | (6) |
where γ1 and γ2, denote the activity coefficients of Oi′′and h•, respectively.
Thus, the Gibbs free energy change for eqn (4) can be expressed as follows.
 | (7) |
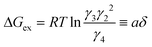
The second term in eqn (7) represents the deviation from the Gibbs free energy change for an ideal system (activity coefficient = 1). As a first order approximation, the deviation is assumed to be a linear function of the oxygen non-stoichiometry, δ.16,19
ΔGex = −RTlnγ1γ22 ![[triple bond, length as m-dash]](https://www.rsc.org/images/entities/char_e002.gif) aδ aδ | (8) |
Thus, the constant a reflects the degree of interaction between the defects and the lattice ions. A positive a suggests that the formation of interstitial oxygen is easier than in an ideal system while a negative a implies that it becomes more difficult than in an ideal system.16 As a approaches zero, the system reduces to the ideal system (i.e. there is no interactions between the defects and the lattice ions). In light of eqn (8), eqn (7) can be rewritten as
 | (9) |
The relationship between δ and p(O2) as described by eqn (9) can then be used to estimate the parameters K and a from experimental data.
The formation of oxygen interstitials in La2NiO4+δ–YSZ is electrically compensated by the formation of electron holes to satisfy electroneutrality. The oxygen non-stoichiometry data for all La2NiO4+δ–YSZ were fitted to the models described above. The theoretical curves calculated for La2NiO4+δ–YSZ using eqn (9) are presented as solid lines in Fig. 4(a), with the fitted K and a values listed in Table 1. Although there was some small deviation, the observed non-stoichiometric behaviour of La2NiO4+δ–YSZ can be well explained using the proposed defect model over a wide range of p(O2) except the area where decomposition is expected. The equilibrium constant K increases exponentially with temperature, implying that the formation of oxygen interstitials is highly affected by temperature, as also shown in the isotherms. This is further confirmed by the observation that the slope of δ versus p(O2) at higher temperatures is steeper than that at lower temperatures, reflecting the relative ease of interstitial oxygen formation at high temperatures.
| La2NiO4+δ | log K | a (J mol−2) |
| 923 K | 0.336 | −2.42 E+05 |
| 973 K | −1.130 | −9.88 E+04 |
| 1023 K | −1.792 | −7.68 E+04 |
Since the value of −a for La2NiO4+δ–YSZ decreases with increasing temperature, the degree of interactions between the defects and the lattice ions diminishes at higher temperatures.
| (10a) |
| NiNiX ↔ NiNi′ + h• | (10b) |
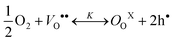
The combination of eqns (10a) and (10b) are the dominant defect reaction in these materials. Thus, charge neutrality requires that the effective negative charge on the lattice ions be balanced by the positive charges of electron holes and oxygen vacancies, as described below.
| [NiNi′] = [h•] + 2[Vo••] or [h•] = [NiNi′] − 2δ | (11) |
Here, the concentration of the charged lattice ions changes with non-stoichiometry as well. Since the electronic conductivity (σh) is much greater than the ionic conductivity (σv) for these materials, however, the total conductivity (σ) is dominated primarily by the transport of electron holes, i.e.
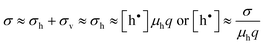 | (12) |
where q is the charge of electron and μh is the drift mobility of electron holes.
In light of this approximation, the equilibrium constant for eqn (10a) can be approximated by
 | (13) |
where γ3 and γ4 denote the activity coefficients of Oox and Vo••, respectively.
The Gibbs free energy change, ΔG, of eqn (10a) can be expressed in terms of the equilibrium constant, K, as in eqn (14a) and (14b) for La3Ni2O7−δ and La4Ni3O10−δ, respectively.
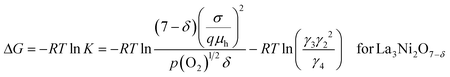 | (14a) |
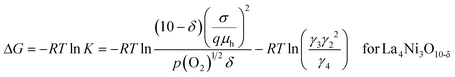 | (14b) |
We define the second term in eqn (14a) and (14b) as the deviation from the standard free energy change of the ideal system, similar to the approximation made for the La2NiO4+δ case.20
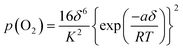
| (15) |
K(qμh)2, we have following equations.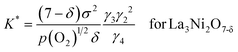 | (16a) |
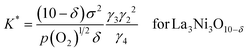 | (16b) |
which can be rewritten as,
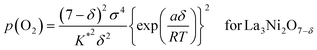 | (17a) |
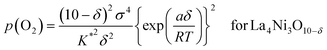 | (17b) |
The oxygen non-stoichiometry data (δ values) and the electrical conductivity data (σ values) at different partial pressures of oxygen collected for the two cathodes (La3Ni2O7−δ–YSZ and La4Ni3O10−δ–YSZ) were curve fitted to the models again. The theoretical curves calculated for using eqn (17a) and (17b) are presented as solid lines in Fig. 4(b) and 4(c), respectively, with the fitted K* and a values listed in Table 2. The theoretical curves again show quite good agreement with the experimental data before decomposition. Oxygen vacancy formation becomes more difficult compared to the ideal system when a is negative.20,21
| La3Ni2O7−δ | log K* | a (J mol−2) | La4Ni3O10−δ | log K* | a (J mol−2) |
| 923 K | 1.308 | −8.53 E+05 | 923 K | 0.049 | −4.13 E+05 |
| 973 K | 1.662 | −4.27 E+05 | 973 K | 0.412 | −3.15 E+05 |
| 1023 K | 1.959 | −2.17 E+05 | 1023 K | 1.112 | −1.89 E+05 |
4. Electrical conductivity
Shown in Fig. 8 are electrical conductivities for the Lan+1NinO3n+1–YSZ (n = 1, 2, and 3). At a given temperature, electrical conductivity increased with the value of n, due possibly to the increased number of Ni–O–Ni interactions, which are responsible for the electronic conduction pathways in the perovskite layers.12 In other words, the conductivity arises mostly from the oxidation state of Ni ions and their electronic configuration. Stoichiometric La2NiO4+δ has a stable Ni2+ oxidation state, whereas incorporation of oxygen interstitials are compensated by Ni3+. Therefore, the electronic conductivity in R–P lanthanum nickelate series depends on the increasing Ni3+/Ni2+ ratio with n, along with the particular connectivity of Ni ions in the structure.22,23 However, the electrical conductivity showed a different trend on temperature. The electrical conductivities of La2NiO4+δ–YSZ (n = 1) and La3Ni2O7−δ–YSZ (n = 2) show little dependence on temperature below ∼573 K and then decreased slightly with increasing temperature (573 < T (K) < 1023). On the contrary, the electrical conductivity of La4Ni3O10−δ–YSZ (n = 3) decreased monotonically with temperature, showing metallic behavior over the entire temperature range. The electrical conductivities for Lan+1NinO3n+1 (42 wt%)–YSZ (n = 1, 2, and 3) calcined at 1023 K as a function of p(O2) at various temperatures (923 < T (K) < 1023) are presented in Fig. 9. The electrical conductivities increased with p(O2) in all cases over the entire temperature range studied, indicating that this material is a p-type electronic conductor under the testing conditions. Further, the electrical conductivities measured at a higher temperature changed more rapidly with p(O2), suggesting that the electrical properties are more sensitive to oxygen non-stoichiometry at higher temperatures.For La2NiO4+δ, the electrical conductivities increased with p(O2) due mainly to increased concentration of mobile interstitial oxygen in the perovskite layers. Since the predominant defects in La2NiO4+δ are interstitial oxygen and electronic holes, an increase in the concentration of oxygen interstitial results in an increase in the concentration of electronic holes, which leads to increased electronic conductivity of the material.14,15
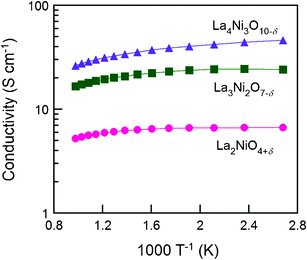 | ||
| Fig. 8 The electrical conductivity of Lan+1NinO3n+1 (n = 1, 2, and 3)–YSZ at various temperatures from 1023 K to 373 K in air, (●) La2NiO4+δ, (■) La3Ni2O7−δ, and (▲) La4Ni3O10−δ. | ||
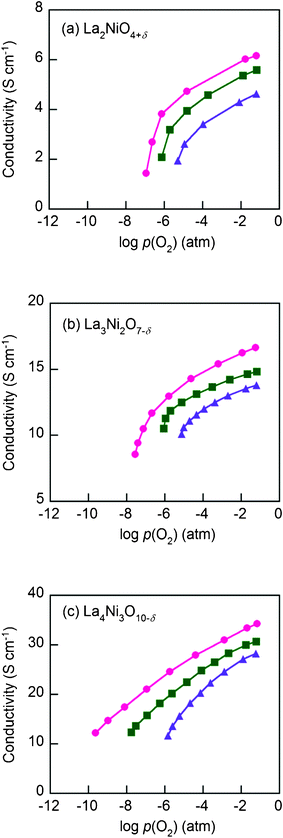 | ||
| Fig. 9 The electrical conductivities of Lan+1NinO3n+1 (n = 1, 2, and 3)–YSZ, (a) La2NiO4+δ, (b) La3Ni2O7−δ, and (c) La4Ni3O10−δ at (●) 923 K, (■) 973 K, and (▲) 1023 K at various p(O2) (atm). | ||
For La3Ni2O7−δ and La4Ni3O10−δ, in contrast, an increase in oxygen partial pressure would lead to a decrease in concentration of oxygen vacancies and an increase in the concentration of electronic holes, which in turn increase the p-type electrical conductivity.
Conclusion
Lan+1NinO3n+1 (n = 1, 2, and 3) were infiltrated into scaffolds of YSZ to form porous cathodes for IT-SOFCs. The redox properties of Lan+1NinO3n+1 (n = 1, 2, and 3) infiltrated in YSZ were investigated using coulometric titration. La4Ni3O10−δ appears to be more suited as cathode materials than La2NiO4+δ and La3Ni2O7−δ because it has higher oxidation enthalpies and hence better stability in a lower p(O2) under the same testing conditions, Partial molar entropies can provide insight into the variation of the number of sites available for oxygen interstitial or vacancy formation reactions during the oxidation/reduction process. A defect model is proposed and it fits well the experimental data on non-stoichiometric variations of oxygen over a wide range of p(O2). All samples show increased electrical conductivity with increasing n at a given temperature. Therefore, the La4Ni3O10−δ–YSZ is considered the most favorable candidate cathode material for IT-SOFC applications.Acknowledgements
This research was supported by the WCU (World Class University) program (R31-2009-000-20012-0) and the Basic Science Research Program (2011-0010773) through the National Research Foundation of Korea funded by the Ministry of Education, Science and Technology, and the New & Renewable Energy of the Korea Insitute of Energy Technology Evaluation and Planning (KETEP) grant (20113020030060) funded by the Korea government Ministry of Knowledge Economy.References
- A. J. Jacobson, Chem. Mater., 2010, 22, 660 CAS.
- G. Amow and S. J. Skinner, J. Solid State Electrochem., 2006, 10, 538 CAS.
- Z. Zhang, M. Greenblatt and J. B. Goodenough, J. Solid State Chem., 1994, 108, 402 CAS.
- Z. Zhang and M. Greenblatt, J. Solid State Chem., 1995, 117, 236 CAS.
- K. T. Lee and A. Manthiram, Chem. Mater., 2006, 18, 1621 CAS.
- G. Amow, I. J. Davidson and S. J. Skinner, Solid State Ionics, 2006, 177, 1205 CAS.
- S. J. Skinner and J. A. Kilner, Solid State Ionics, 2000, 135, 709 CAS.
- A. Yamada, Y. Suzuki, K. Saka, M. Uehara, D. Mori, R. Kanno, T. Kiguchi, F. Mauvy and J. C. Grenier, Adv. Mater., 2008, 20, 4124 CAS.
- D. O. Bannikov, A. P. Safronov and V. A. Cherepanov, Thermochim. Acta, 2006, 451, 22 CAS.
- Z. Gao, Z. Q. Mao, C. Wang and Z. X. Liu, Int. J. Hydrogen Energy, 2010, 35, 12905 CAS.
- V. V. Kharton, A. P. Viskup, E. N. Naumovich and F. M. B. Marques, J. Mater. Chem., 1999, 9, 2623 CAS.
- E. V. Tsipis, M. V. Patrakeev, J. C. Waerenborgh, Y. V. Pivak, A. A. Markov, P. Gaczynski, E. N. Naumovich and V. V. Kharton, J. Solid State Chem., 2007, 180, 1902 CAS.
- M. Andersson, J. L. Yuan and B. Sunden, Appl. Energy, 2010, 87, 1461 CAS.
- S. Yoo, J. Y. Shin and G. Kim, J. Mater. Chem., 2011, 21, 439 CAS.
- S. Yoo, J. Y. Shin and G. Kim, J. Electrochem. Soc., 2011, 158, B632 CAS.
- T. Nakamura, K. Yashiro, K. Sato and J. Mizusaki, Solid State Ionics, 2009, 180, 368 CAS.
- E. V. Tsipis, E. N. Naumovich, M. V. Patrakeev, J. C. Waerenborgh, Y. V. Pivak, P. Gaczynski and V. V. Kharton, J. Phys. Chem. Solids, 2007, 68, 1443 CAS.
- S. Sengodan, H. J. Yeo, J. Y. Shin and G. Kim, J. Power Sources, 2011, 196, 3083 CAS.
- Z. Li, R. Haugsrud, J. B. Smith and T. Norby, Solid State Ionics, 2009, 180, 1433 CAS.
- S. Onuma, K. Yashiro, S. Miyoshi, A. Kaimai, H. Matsumoto, Y. Nigara, T. Kawada, J. Mizusaki, K. Kawamura, N. Sakai and H. Yokokawa, Solid State Ionics, 2004, 174, 287 CAS.
- M. Oishi, K. Yashiro, J. O. Hong, Y. Nigara, T. Kawada and J. Mizusaki, Solid State Ionics, 2007, 178, 307 CrossRef CAS.
- M. D. Carvalho, A. Wattiaux, L. P. Ferreira and J. M. Bassat, J. Solid State Chem., 2009, 182, 60 CAS.
- M. Schroeder and M.-A. Dragan, J. Mater. Sci., 2007, 42, 1972 CAS.
| This journal is © The Royal Society of Chemistry 2012 |