Highly sensitive optofluidic chips for biochemical liquid assay fabricated by 3D femtosecond laser micromachining followed by polymer coating†
Yasutaka
Hanada
ab,
Koji
Sugioka
*a and
Katsumi
Midorikawa
a
aRIKEN-Advanced Science Institute, 2-1 Hirosawa, Wako, Saitama, Japan. E-mail: ksugioka@riken.jp; Fax: +81 48462 4682; Tel: +81 48467 9502
bHirosaki University, Graduate School of Science and Technology, 3 Bunkyo-cho, Hirosaki, Aomori, Japan
First published on 14th June 2012
Abstract
The demand for increased sensitivity in the concentration analysis of biochemical liquids is a crucial issue in the development of lab on a chip and optofluidic devices. We propose a new design for optofluidic devices for performing highly sensitive biochemical liquid assays. This design consists of a microfluidic channel whose internal walls are coated with a polymer and an optical waveguide embedded in photostructurable glass. The microfluidic channel is first formed by three-dimensional femtosecond laser micromachining. The internal walls of the channel are then coated by the dipping method with a polymer that has a lower refractive index than water. Subsequently, the optical waveguide is integrated with the microfluidic channel. The polymer coating on the internal walls permits the probe light, which is introduced by the optical waveguide, to propagate along the inside of the microfluidic channel. This results in a sufficiently long interaction length between the probe light and a liquid sample in the channel and thus significantly improves the sensitivity of absorption measurements. Using the fabricated optofluidic chips, we analyzed protein in bovine serum albumin to concentrations down to 7.5 mM as well as 200 nM glucose-D.
Introduction
The increasing demand to analyze low concentrations of biochemical liquids has resulted in optofluidic chips being developed for this purpose in recent years. Detection of biochemical liquids such as proteins is very important since proteins have many biological and chemical functions, including catalyzing reactions in living organisms, decoding information in cells, regulating biochemical processes, storing and transporting small molecules, and many other specialized functions.1 In particular, a few molecules of a pathological protein are sufficient to induce a disease or to adversely affect the biological functions of cells. Other biological liquids such as glucose are critical in diagnosing a wide range of health conditions, including diabetes and hypoglycemia.2 For example, the blood glucose concentration of non-diabetics generally varies over a narrow range of about 3.5–5 mM, whereas diabetic patients exhibit a considerably larger variation of about 1–30 mM.3 Consequently, highly accurate and sensitive techniques for detecting biological liquids are required to investigate and diagnose specific diseases. Analysis using microfluidic chips is rapid and cost effective. Furthermore, highly sensitive analysis can be formed using even a tiny volume of sample. In contrast, conventional spectroscopic methods require much larger sample volumes to analyze low-concentration biochemical liquids. This feature will also reduce reagent consumption. Several methods have been recently reported for using microfluidic devices to measure biochemical liquids, including those mentioned above. Vegvari and Hjerten developed a hybrid microdevice that consists of a supporting polyvinyl chloride (PVC) plate with a groove that accommodates a fused silica capillary tube (the separation channel), a slit that permits in-tube detection, an inlet for introducing the sample, and electrode vessels and platinum electrodes for analyzing proteins and other biochemical samples by electrophoresis and electrochromatography.4 To realize UV detection, the silica capillary tube was irradiated by UV light. Lapos et al. demonstrated the effectiveness of a capillary electrophoresis system that employs microchips with dual laser-induced fluorescence and electrochemical detectors for analyzing cerebral spinal fluid samples from patients with multiple sclerosis.5 We have demonstrated quantitative measurement of CO2 concentration in water based on changes in the absorption spectrum induced by a pH indicator. We realized this by using an optofluidic chip in which two optical waveguides for sensing intersected a microfluidic channel embedded in glass.6 Crespi et al. have employed a three-dimensional (3D) unbalanced Mach-Zehnder interferometer consisting of optical waveguides embedded in a substrate to enhance the sensitivity of glucose-D concentration measurements.7However, in all these light detection methods, the interaction length of light with the sample is determined by the width of the capillary or microfluidic channel, which limits the detection sensitivity. The interaction length would be greatly increased if the probe light could propagate inside the channel. However, materials typically used for optofluidic chips such as glass and polydimethylsiloxane (PDMS) have higher refractive indices than those of liquid samples, which prohibits light propagation inside the channel. To overcome this problem, in this study, we develop a technique for coating the internal walls of a microfluidic channel with a polymer that has a lower refractive index than water. The fabricated optofluidic chips are used to detect low concentrations of proteins and glucose-D with a high sensitivity.
Method
Optofluidic fabrication
Fig. 1 shows a schematic diagram of an optofluidic system fabricated by femtosecond (fs) laser micromachining for performing highly sensitive analysis of liquid samples. We used a commercially available photostructurable glass (Foturan, Schott Glass Corp.) that consists of lithium aluminosilicate doped with trace amounts of silver, cerium, sodium, and antimony. The optofluidic system was fabricated by 3D direct writing using a commercial fs laser (wavelength: 775 nm; pulse width: 150 fs; repetition rate: 1 kHz). The fabrication procedure consists of the following three steps. (1) 3D latent images were drawn inside the glass by scanning a tightly focused fs laser beam (pulse energy: 0.7 μJ; scanning speed: 1.0 mm s−1). Silver atoms precipitated in irradiated regions. (2) The glass sample was annealed in a programmable furnace to form a crystalline phase of lithium metasilicate. The temperature was increased to 500 °C at 5 °C min−1, held constant for 1 h, raised to 605 °C at 3 °C min−1, and held constant for 1 h. (3) The annealed glass microfluidic chip was etched in an aqueous solution of 10% hydrofluoric (HF) acid in an ultrasonic bath to selectively remove the modified area. Lithium metasilicate was preferentially etched with an etching rate that is ca. 50 times higher than the unmodified regions. This etching produced 3D microfluidic structures inside the glass chip. Further details regarding the fabrication procedure and its mechanisms are described elsewhere.6,8–15 After fabricating the 3D microfluidic structures, additional annealing was performed to smooth the etched surface.10 Both laser direct writing and furnace annealing are well controlled by programmable systems. In addition, we performed systematic experiments to determine the optimal etching time and concentration of the HF etching process for fabricating the microfluidic structures. Consequently, we could produce various microfluidic devices with high reproducibility using the present technique.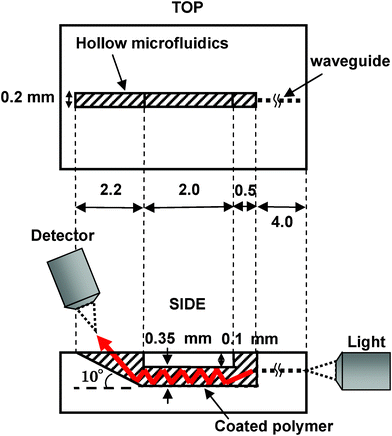 | ||
| Fig. 1 Optofluidic chip design for liquid concentration measurement. The optofluidic chip is filled with liquid and a white light probe is coupled to the entrance facet of the waveguide. The light transmitted by the waveguide propagates inside the microfluidic channel and is then reflected at the tilted wall of the left reservoir, where the absorption spectra of liquids are measured. | ||
To realize highly sensitive analysis of liquid concentration, the embedded microfluidic channel was coated with a low refractive index polymer (Teflon AF, DuPont) whose refractive index (1.31) is lower than that (∼1.33) of water. Thus, the probe light for liquid analysis can propagate inside the microfluidic channel filled with liquid samples, resulting in a sufficiently long interaction length between the liquid and the incident probe light, thereby increasing the analysis sensitivity. This coating was performed by dipping the optofluidic chip in the liquid polymer for 5 s and removing it with a speed of 4 mm s−1. The viscosity of the liquid polymer is sufficiently low that the polymer filled the microfluidic channel by merely dipping. An optofluidic chip with its channel filled with the liquid polymer was then annealed by increasing the temperature to 200 °C at 20 °C min−1 and holding this temperature for 2 h. Since the liquid polymer has a high volatility even at room temperature, the final thickness of the solid polymer coating on the wall of the microfluidic channel was about 1.7 μm.
To efficiently couple the probe light into the microfluidic channel, an optical waveguide was integrated between the channel and the right edge of the optofluidic chip. To write the optical waveguide, a focused fs laser beam with a pulse energy of 0.3 μJ was scanned at 1.5 mm s−1 inside the glass to increase the refractive index in the laser-scanned regions after polymer coating. This waveguide enables the probe light to be efficiently introduced into the microfluidic channel by an objective lens, as shown in Fig. 1. The written line functions as a single-mode waveguide with a propagation loss of 0.5 dB cm−1 at a wavelength of 632 nm.16
Sample preparation
The Bradford assay was used for the protein concentration assay. It is a well-known method for measuring the concentration of various proteins by spectroscopic analysis based on an absorbance shift of Coomassie Brilliant Blue G-250 dye. Prediluted bovine serum albumin (BSA) standards and Bradford reagent supplied by Oz Bioscience were used. The BSA standards had seven different protein concentrations (7.5, 15, 37.5, 75, 112.5, 150, 225 mM). After preparation, incubation was performed for 5 min for this reaction.A glucose assay kit from BioVision was used for the glucose-D concentration assay. This kit contains glucose standards, an assay buffer for dilution, and an enzyme mix for inducing color change that depends on the amount of glucose present in the liquid. Glucose-D samples with different concentrations were prepared by diluting the glucose standard using the assay buffer (0.2, 0.4, 0.8, 1.2, 2 μM). After preparation, incubation was performed for 30 min for this reaction.
Liquid concentration analysis
The fabricated optofluidic chip shown in Fig. 1 was first filled with the above-described liquid samples. White light from a halogen lamp (DH-2000, Mikropack) was used as the probe light. It was coupled to a facet of an optical waveguide connected to the right side of the microfluidic channel by a ×20 objective with a numerical aperture (NA) of 0.46. The light transmitted by the waveguide is introduced to the microfluidic channel filled with a liquid sample and it then propagates inside the channel. Finally, the probe light is reflected at the end of the channel and is directed to an objective lens and a spectrometer. Light propagates inside the liquid-filled channel by total internal reflection due to the coated polymer having a lower refractive index than the liquid sample. To introduce the light into the spectrometer, the side wall of the left reservoir is tilted at an angle of 10° relative to the optofluidic chip surface, which gives an optimum incident angle of ca. 80° for reflection of 632 nm wavelength light. The reflected probe beam is collected by a ×10 objective (NA: 0.21) and is coupled to the detector head of the external spectrometer (USB 2000, Ocean Optics) for absorbance measurements of the liquid samples in concentration analysis. The absorbance was calculated by subtracting the spectrum with the liquid samples in the microfluidic channel from that observed without the samples. Before each absorbance measurement of liquid samples, the optofluidic chip was ultrasonically cleaned with ethanol and rinsed with deionsed water for 5 min. The optofluidic chip was then carefully set at the same position where the previous measurement was performed. This procedure was repeated three times for the same liquid concentration and the average of the three measurements was adopted for each sample.Results and discussion
Optical characterization of the optofluidic chip
The white light introduced from the end facet of the integrated waveguide propagates in the microfluidic channel as a result of the refractive index of the coated polymer being lower than that of the liquid sample. Consequently, the light can interact with the liquid along the length of the microfluidic channel, resulting in a much longer interaction length than optofluidic chips used in previous studies,6 thereby significantly enhancing the analysis sensitivity. To evaluate the profiles of guided beams in the microfluidic channel, a 632 nm wavelength He–Ne laser beam was coupled with the entrance facet of the written waveguide by a ×20 objective (NA: 0.46). Fig. 2(a) and (b) respectively show the near-field pattern and the intensity distribution profile obtained by imaging the output beam at the end of the microfluidic channel. To realize this, the left side of the reservoir was cut and the microfluidic channel was filled with water. A ×10 water-immersion objective (NA: 0.30) and a CCD camera were set at the end of the channel.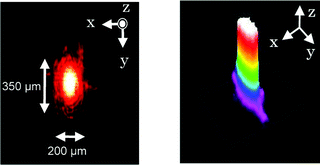 | ||
| Fig. 2 (a) Near-field pattern and (b) intensity distribution of 632 nm CW laser beam at end of the microfluidic channel. The polymer-coated microfluidic channel essentially functions as a single-mode waveguide at a wavelength of 632 nm. | ||
Fig. 2 reveals that the microfluidic channel essentially functions as a single-mode waveguide at a wavelength of 632 nm. The intensity profile has a full-width at half-maximum of approximately 200 μm in the x-direction (i.e., parallel with the chip surface) and 350 μm in the y-direction (i.e., perpendicular to the chip surface), which is comparable to the cross-section of the microfluidic channel.
To evaluate the propagation loss by the polymer-coated microfluidic channel, five optofluidic chips with different microfluidic channel lengths were prepared. Fig. 3 shows the optical loss as a function of the microfluidic channel length. Much care was taken to ensure that the coupling conditions were identical for all five microfluidic channels. To determine the optical loss, a 632 nm wavelength CW laser was coupled to the waveguide by a ×20 objective (NA: 0.46). The coupling loss was estimated to be ca. 0.15 dB by extrapolating the data to a distance of 0 mm. The coupling loss is caused by either a mismatch between the size of the beam and that of the waveguide or misalignment between the waveguide and the focused laser. The propagation loss in the microfluidic channel is estimated to be 0.55 dB mm−1 at a wavelength of 632 nm from the slope of the data in Fig. 3. The CW laser light may leak through the thin polymer into the glass by its evanescent wave, which would cause propagation loss. However, the penetration depth of the evanescent wave is smaller than the laser wavelength, while the polymer thickness is larger than the wavelength. In all the propagation loss measurements, we did not observe the laser beam leaking into the glass. Although the propagation loss obtained is much greater than that of optical waveguides written by fs lasers, it is still acceptable for optofluidic applications due to the reasonably short channel length (in the present case, the microfluidic channel is ca. 2 mm long; the length is inevitably determined by the size of the glass chip and the arrangement of the left reservoir and the fs laser-written optical waveguide).
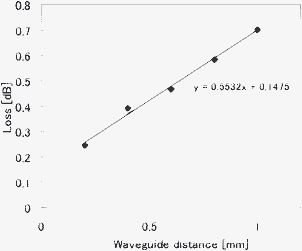 | ||
| Fig. 3 Optical loss as a function of microfluidic channel length. The coupling loss is estimated to be ca. 0.15 dB by extrapolating the data to a distance of 0 mm. The propagation loss is estimated to be 0.55 dB mm−1 at a wavelength of 632 nm. | ||
In the concentration analysis, the laser beam is reflected from the tilted wall in the left reservoir after propagating through the microfluidic channel. The reflectivity at a wavelength of 632 nm was measured to be 40%. This large propagation loss and low reflectivity may be due to the roughness of the coated polymer, which is shown by the atomic force microscopy (AFM) image in Fig. 4. To observe its surface morphology, the polymer was coated on a photostructurable glass surface by employing the same dipping procedure described above. Despite the fabricated microfluidic channel having a smooth surface after additional annealing,10 the coated polymer had a root mean square surface roughness of 56.8 nm. The propagation loss and the reflectivity could be improved by reducing the roughness of the coated polymer. Nevertheless, the fabricated optofluidic chips exhibited good performance in concentration analysis, as described below.
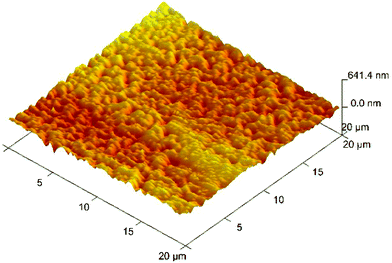 | ||
| Fig. 4 AFM image of polymer coated on glass. To measure the surface roughness, a low refractive index polymer was coated on the photostructurable glass surface by dipping. The root mean square roughness was measured to be 56.8 nm. | ||
Liquid concentration assay in the optofluidic chip
Fig. 5(a) shows absorbance spectra of BSA standards with protein concentrations ranging from 7.5 to 225 mM. After sample preparation, each sample was introduced to the microfluidic channel and white light was propagated through the channel. Bradford protein assay relies on the dye binding to the protein. When the dye binds to the protein, it is converted into the most stable unprotonated cationic blue form that has an absorption at wavelengths between 580 and 610 nm (the maximum absorption is at 595 nm). The broad and unstable baselines at wavelengths of more than about 650 nm are due to excess dye being used in the preparation. It is critical to improve the sample preparation procedure to suppress the broad and unstable baseline. The intensity of the peak at a wavelength of 595 nm gradually decreases with decreasing protein concentration, as shown in Fig. 5(a). By plotting the peak intensity of the absorbance in Fig. 5(a), a standard curve of the optical density (OD) as a function of the protein concentration can be obtained, as shown in Fig. 5(b). In preparing a standard curve, three measurements were performed for each concentration. Since the errors in the measurements are very small, only the average of the three measurements is plotted in Fig. 5(b). The OD decreases monotonically with decreasing protein concentration and the fabricated optofluidic chip had a detection limit as low as 7.5 mM for protein concentration. This detection limit is sufficiently small compared to that of the Bradford assay. Protein concentration measurement of BSA standards by the Bradford assay generally have a detection limit of more than a few tens of mM.17,18 Therefore, the fabricated microfluidic chip has the potential to detect low protein concentrations that occur in the early stages of biochemical, immunological, and other areas of clinical analysis. This may enable earlier detection of diseases.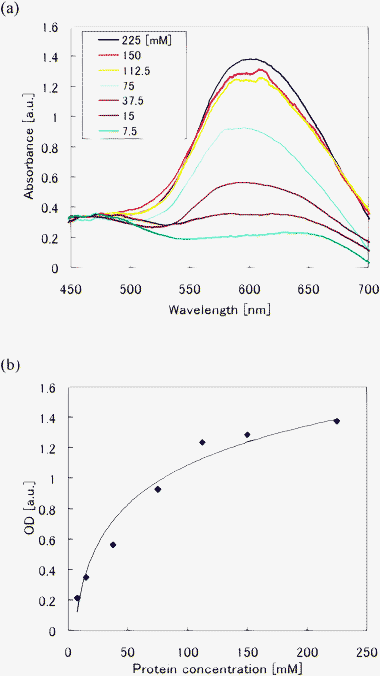 | ||
| Fig. 5 Absorption measurement of BSA standards using the optofluidic chip. (a) Absorbance spectra of BSA standards with different protein concentrations. (b) Standard curve of OD for protein concentration was obtained by plotting the peak intensity in (a). A detection limit of 7.5 mM protein concentration was obtained using the optofluidic chip. | ||
After demonstrating the highly sensitive detection of protein concentrations, we compared the sensitivities of the fabricated optofluidic chip used in this study and one used in our previous study.6 In the previous study, a simple straight microfluidic channel was first fabricated in glass. We then formed straight optical waveguides that intersect the microfluidic channel at its center by scanning a tightly focused fs laser beam using the same technique described above. After fabrication, we measured the absorptions of the same BSA standards as those used above with different protein concentrations.
Fig. 6(a) shows absorbance spectra of BSA standards with different protein concentrations using the optofluidic chips fabricated in this and previous studies (the ellipses labeled 1 and 2 indicate spectra obtained by the optofluidic chips used in this study and the previous study, respectively). Fig. 6(b) shows enlarged spectra from ellipse 2 in Fig. 6(a). At high concentrations, both optofluidic chips can detect the BSA standards. However, the intensity obtained by the optofluidic chips used in this study is enhanced by a factor of ca. 14 relative to that obtained by the optofluidic chips used in the previous study. Furthermore, spectra for protein concentrations in the range 7.5–37.5 mM obtained by the optofluidic chip used in the previous study almost overlap (see Fig. 6(b)), making it impossible to distinguish absorbance spectra obtained at different concentrations. Thus, the detection sensitivity of the previous fabricated optofluidic chip is limited to a concentration of 75 mM. This low sensitivity is due to the short interaction length between the white light propagating across the protein solution in the microfluidic channel (width: 0.2 mm). In contrast, the present optofluidic chip has an interaction length of 2.0 mm (corresponding to the channel length). Its sensitivity could be further enhanced by increasing the channel length. However, a longer channel would increase the optical propagation loss. Therefore, it is also necessary to reduce the propagation loss.
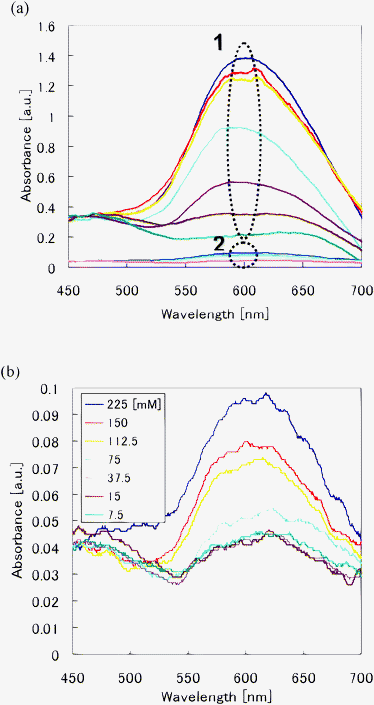 | ||
| Fig. 6 Comparison of absorption measurements of protein concentrations using the optofluidic chip fabricated in the present study and one fabricated in a previous study. (a) Absorbance spectra obtained by optofluidic chips fabricated in this and previous studies (ellipses 1 and 2 indicate spectra obtained from the optofluidic chips used in this and previous studies respectively). (b) Enlargements of spectra indicated by ellipse 2 in (a). | ||
To evaluate the performance of the optofluidic chip for various liquids, detection of glucose-D solutions with different concentrations was also performed using the same optofluidic chip as that used for protein concentration analysis. Fig. 7(a) shows absorbance spectra of glucose-D solutions with different concentrations mixed with an enzyme and Fig. 7(b) shows the standard OD curve for glucose-D obtained from Fig. 7(a). The optical absorption spectra exhibit a high absorbance peak at wavelengths of about 550 nm. This peak drops gradually as the concentration decreases. A glucose-D concentration as low as 200 nM was clearly detected, indicating that the detection limit was improved by a factor of over 104 relative to that obtained (5 mM) by the microfluidic chip integrated with an unbalanced Mach-Zehnder interferometer described in Ref. 7. The lowest concentration detected in the present study was limited by the concentration of glucose-D solution available. Therefore, it may be possible to detect samples with concentrations lower than 200 nM.
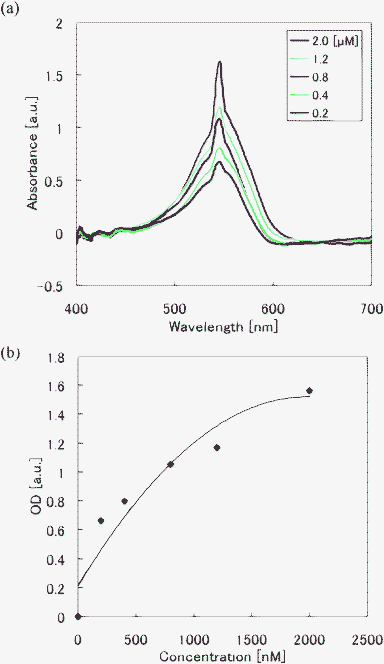 | ||
| Fig. 7 Absorption spectra of glucose-D solutions obtained using the optofluidic chip. Absorbance spectra of (a) glucose-D with different concentrations. (b) Standard curve of glucose-D amount for different concentrations by plotting the peak intensity in (a). A glucose-D concentration down to 200 nM was clearly detected using the optofluidic chip. | ||
Conclusion
We proposed a new optofluidic chip for performing assays of low concentrations of biochemical liquids. The microfluidic channel was coated with a low refractive index polymer to enhance the interaction between the liquid and the probe light to realize highly sensitive assays. Using the proposed optofluidic chip, protein with a concentration of 7.5 mM and glucose-D with a concentration of 200 nM were detected; these concentrations are sufficiently low for practical concentration assays. Thus, optofluidic chips fabricated by fs lasers are attractive and powerful tools for high sensitivity and low concentration assays. The present optofluidic chip has the potential to diagnose cryptogenic and other diseases at a much early stage than conventional methods.References
- G. A. Petsko, D. Ringe, New Science Press, London, 2004.
- S. Li and L. Kricka, Clin. Chem., 2006, 52(1), 37 CAS.
- Y. Hsieh and J. Zahn, J. Diabetes Sci. and Technol., 2007, 1(3), 375 Search PubMed.
- A. Vegvari and S. Hjerten, Electrophoresis, 2003, 24, 3815 CrossRef CAS.
- J. Lapos, D. Manica and A. Ewing, Anal. Chem., 2002, 74(14), 3348 CrossRef CAS.
- Y. Hanada, K. Sugioka, I. S. Ishikawa, H. Kawano, A. Miyawaki and K. Midorikawa, Lab Chip, 2011, 11, 2109 RSC.
- A. Crespi, Y. Gu, B. Ngamsom, H. Hoekstra, C. Dongre, M. Pollnau, R. Ramponi, H. Vlekkert, P. Watts, G. Cerullo and R. Osellame, Lab Chip, 2010, 10, 1167 RSC.
- M. Masuda, K. Sugioka, Y. Cheng, N. Aoki, M. Kawachi, K. Shihoyama, K. Toyoda, H. Helvajian and K. Midorikawa, Appl. Phys. A: Mater. Sci. Process., 2003, 76, 857 CrossRef CAS.
- Y. Cheng, K. Sugioka, K. Midorikawa, M. Masuda, K. Toyoda, M. Kawachi and K. Shihoyama, Opt. Lett., 2003, 28, 55 CrossRef.
- Y. Cheng, K. Sugioka, K. Midorikawa, M. Masuda, K. Toyoda, M. Kawachi and K. Shihoyama, Opt. Lett., 2003, 28, 1144 CrossRef.
- Y. Cheng, K. Sugioka and K. Midorikawa, Opt. Lett., 2004, 29, 2007 CrossRef.
- Y. Cheng, K. Sugioka and K. Midorikawa, Appl. Surf. Sci., 2005, 248, 172 CrossRef CAS.
- Y. Cheng, K. Sugioka and K. Midorikawa, Opt. Express, 2005, 13, 7225 CrossRef CAS.
- T. Hongo, H. Niino, Y. Cheng, M. Masuda, I. Miyamoto, H. Takai and K. Midorikawa, J. Appl. Phys., 2005, 97, 063517 CrossRef.
- K. Sugioka, Y. Hanada and K. Midorikawa, Laser Photonics Rev., 2010, 3, 386 CrossRef.
- Z. Wang, K. Sugioka, Y. Hanada and K. Midorikawa, Appl. Phys. A: Mater. Sci. Process., 2007, 88, 699 CrossRef CAS.
- L. Perazzolo, R. Gargioni, P. Ogliari and M. Barracco, Aquaculture, 2002, 214, 19 CrossRef.
- P. Held, Nature Methods Application Notes, 2006 Search PubMed (published online).
Footnote |
| † Published as part of a themed issue on optofluidics. |
| This journal is © The Royal Society of Chemistry 2012 |