DOI:
10.1039/C1AY05345K
(Paper)
Anal. Methods, 2012,
4, 299-308
Chromatographic fingerprint of Semen Armeniacae Amarae based on high-performance liquid chromatogram and chemometric methods
Received
14th June 2011
, Accepted 2nd November 2011
First published on 5th December 2011
Abstract
Thirteen real Semen Armeniacae Amarae (SAA) samples and 28 commercial SAA samples were obtained from four typical sources of China. The high-performance liquid chromatographic (HPLC) fingerprints of them were firstly recorded. Chromatographic fingerprint was estimated by adding all the UV spectra recorded at each wavelength in the range between 210 and 360 nm. The chromatographic fingerprint obtained in this way provided more information than the chromatograms recorded at single wavelengths. Principal component analysis (PCA) based on the chromatographic fingerprint obtained as referred in previous paragraphs was performed to visualize and classify the studied samples in principal spaces. Similarity analysis (SA) and absolute peak areas (APA) were applied to estimate the concentrations of their components. Hierarchical clustering analysis (HCA) was also carried out to validate the clustering results. Furthermore, amygdalin and another four components were checked out by loadings plots of PCA and could be used as potential chemical markers for discrimination among different sources of samples. The results indicate that herbal medicines from different geographical conditions lead to different constituent contents. The total chromatographic fingerprint adding UV spectra recorded at each wavelength between 210 and 360 nm was reliable for the chemical fingerprint analysis of herbal medicine and would provide a useful reference for quality control of herbal medicines.
1 Introduction
SAA is a seed of Prunus armeniaca Linne var.ansu Masximowica widely used to treat asthma, aplastic anemia and tumors in herbal medicine.1,2Amygdalin is usually chosen as a marker compound to assess the quality of SAA.3–5 However, amygdalin does not only exist in SAA, but also in other Rosaceae plants.6 Controlling only one component of the SAA is non-effective.7 Obtaining a typical chromatographic fingerprint and discriminating herbal materials as a function of their origin as well as its bioactive ingredients are crucial to ensure the reliability and repeatability of pharmacological research. This would also help to enhance product quality control.8,9
Publications on SAA are mostly about amygdalin quantitative analysis in high-performance liquid chromatogram (HPLC), micellar electrokinetic chromatography and gas chromatography-mass spectrometry.10–12 None of them involved the fingerprints of SAA. A good chromatographic fingerprint includes the characterization of common chemical and pharmacologically active components, and could be used to characterize the “sameness” and “differences” among various samples.13–15 However, selecting the best chromatography conditions to construct a typical fingerprint can be excruciating. Actually many researchers have found out that a chromatographic fingerprint constructed by using only one single wavelength is deficient. Some researchers have tried to overcome the limitations of mono-wavelength recording.16,17 In this study, the chromatograms at different wavelengths were analyzed. The ultimate total chromatographic fingerprint was estimated by adding all the UV spectra recorded at each wavelength in the range between 210 and 360 nm for the first time. The technique of HPLC fingerprints combined with chemometric methods was employed to analyze SAA collected from various origins and the results at different wavelengths were compared. To begin with, the main bioactive compound in SAA herb, namely amygdalin, was identified and quantified by chromatography with UV detection at 215 nm. Then, PCA based on the total chromatographic fingerprint and its principal peaks were performed to differentiate and classify the studied samples. Five potential chemical markers were discovered. The amygdalin was absolutely quantified. The spectrums of another four components were given, and according to a previous report some of them might be prunasin, mandelonitrile or benzaldehyde.18 Then absolute peak areas (APA) and similarity analysis (SA) were applied to confirm their discrepancy; hierarchical clustering analysis (HCA) was further accomplished to validate the clustering results adjunctively. Finally, the HPLC fingerprints of 41 samples from extensive sources were acquired and identified. This investigation shows that the developed methodology can be applied for classifying herb medicines as a function of their origin to discriminate genuine medicinal materials from other place materials, and further used for the quality control of herb medicines.
2 Experimental
2.1 Chemicals and reagents
Amygdalin standard was purchased from the National Institute for the Control of Pharmaceutical and Biological Products (Beijing, China). Methanol HPLC grade, acetonitrile and phosphoric acid were purchased from Jiangsu Hanbon Science and Technology Co., Ltd (Huaian, Jiangsu Province, China). Other reagents were of analytical grade. Water was deionized in a Milli-Q water purification system (Millipore Bedford, MA, USA).
2.2 Plant materials
Forty-one batches of samples including real samples (13) with known origin and some commercial samples (28), some with unknown origin (see Table 1), were collected from different provinces of China. Authentic SAA were bought in the country of origin, and confirmed by local State Drug Administration. The commercial samples were purchased from various places in China. Detailed information about the origins is shown in Fig. 1 and Table 2.
Table 1 A summary of the tested samples
| Sample No. |
Source |
Habitat |
Year of collection |
| 1 |
Zhenyuan, Gansu (authentic) |
Gansu |
2010 |
| 2 |
Jiamushi, Heilongjiang (authentic) |
Heilongjiang |
2010 |
| 3 |
Haerbin, Heilongjiang (authentic) |
Heilongjiang |
2010 |
| 4 |
Changchun Drug Store, Changchun (authentic) |
Jinlin |
2010 |
| 5 |
Changchun, Jilin (authentic) |
Jinlin |
2010 |
| 6 |
Chende, Hebei (authentic) |
Hebei |
2010 |
| 7 |
Tianshili Drug Store, (authentic) |
Hebei |
2010 |
| 8 |
Zhangjiakou, Hebei (authentic) |
Hebei |
2010 |
| 9 |
Tangshan, Hebei (authentic) |
Hebei |
2010 |
| 10 |
Zigong, Linyon, Shanxi (authentic) |
Shanxi |
2009 |
| 11 |
Zigong, Ansai, Shanxi (authentic) |
Shanxi |
2009 |
| 12 |
Zigong, Sanxian, Shanxi (authentic) |
Shanxi |
2009 |
| 13 |
Zigong, Xixian, Shanxi (authentic) |
Shanxi |
2009 |
| 14 |
Purchased from Jiuzhitang, Changsha, Huanan |
Shanxi |
2009 |
| 15 |
Sanjiu Drug Store, Changsha, Hunan |
Hebei |
2009 |
| 16 |
Haiwangxingchen Drug Store, Changsha, Hunan |
Hebei |
2009 |
| 17 |
Tongrentang Drug Store, Changsha, Hunan |
Hebei |
2009 |
| 18 |
Tongjitang Drug Store, Changsha, Hunan |
Hebei |
2009 |
| 19 |
Gaoqiao Drug Market, Changsha, Hunan |
Unknown |
2009 |
| 20 |
Laobaixin, Changsha, Hunan |
Hebei |
2009 |
| 21 |
Ruihua Drug Store, Changsha, Hunan |
Unknown |
2009 |
| 22 |
Zhangtongtai Drug Store, Zhejiang |
Heibei |
2010 |
| 23 |
Zhongkang Drug Store, Zhejiang |
Hebei |
2010 |
| 24 |
Tongjuntang Drug Store, Zhejiang |
Huabei |
2009 |
| 25 |
Liriqin Drug Store, Zhejiang |
Shanxi |
2010 |
| 26 |
Kangmei Drug Company, Zhejiang |
Unknown |
2010 |
| 27 |
Nanlinboai Drug Store, Guangxi |
Dongbei |
2010 |
| 28 |
Jiahe Drug Store, Guangxi |
Heibei |
2010 |
| 29 |
Shunxin Drug Store, Guangxi |
Dongbei |
2010 |
| 30 |
Xinhua Drug Store, Guangxi |
Unknown |
2010 |
| 31 |
Yihe Drug Store, Guangxi |
Unknown |
2010 |
| 32 |
Purchased form Guanzhou, Guangdong |
Unknown |
2010 |
| 33 |
Purchased form zhongshan, Guangdong |
Hebei |
2010 |
| 34 |
Purchased form Shanghai |
Hebei |
2010 |
| 35 |
Purchased form Shanghai |
Unknown |
2010 |
| 36 |
Purchased form Beijing |
Unknown |
2010 |
| 37 |
Purchased form Beijing |
Unknown |
2010 |
| 38 |
Purchased form Chongqing |
Unknown |
2010 |
| 39 |
Purchased form Chongqing |
Unknown |
2010 |
| 40 |
Purchased form Yunan |
Unknown |
2010 |
| 41 |
Purchased form Yunan |
Unknown |
2010 |
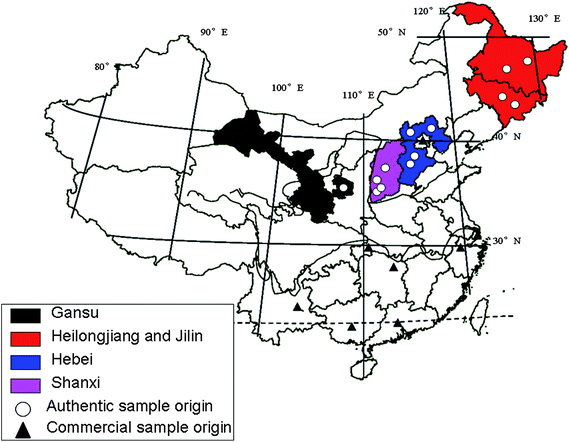 |
| | Fig. 1 Origins of the authentic and commercial samples. | |
Table 2 Geographic condition of different origins
| Origin |
Climate |
An annual average temperature |
Average altitude |
| Gansu |
Temperate continental climate, dry and little rain |
8 °C |
1500 m |
| Heilongjiang and Jilin |
Continental monsoon climate, semi–arid, semi-humid |
5 °C |
340 m |
| Hebei |
Continental monsoon climate |
13 °C |
1500 m |
| Shanxi |
Warm temperate monsoon climate |
10 °C |
1300 m |
2.3 Instrumentation and chromatographic conditions
All HPLC analyses were performed using Ultimate 3000 Series HPLC system equipped with a vacuum degasser, binary pump, autosampler, thermostated column compartment and Ultimate 3000 Diode Array Detector (DAD). A Dionex Acclaim C18 (5 μm, 250 mm × 4.6 mm) column and a suitable guard column (C18, 5 μm, 7.5 mm × 4.6 mm) were used for all chromatographic separations. The mobile phase was CH3CN-0.05% phosphate buffer (0–5 min: 5% CH3CN 5–20 min: 5–10% CH3CN 20–35 min: 10% CH3CN 35–60 min: 10–95% CH3CN 60–65 min: 95%CH3CN). The flow rate was 0.8 mL min−1, the column temperature was maintained at 30 °C and the injection volume was 10 μL. The DAD detector was set at 210 nm to 360 nm for acquiring chromatograms.
2.4 Preparation of standard and sample solutions
The reference compound was weighed accurately and dissolved in methanol in a 10 ml volumetric flask to make stock solutions. Working standard solutions were prepared from those stock solutions by further dilution of the appropriate volume in methanol. These solutions were stored away from light at 4 °C in a refrigerator. Pulverized sample (20 mesh, 2.50 g) was weighed accurately into a 100 mL round bottom flask, further extracted ultrasonically for 30 min in 25 mL methanol at room temperature and finally filtered. The extracts were preserved in a refrigerator. All the standard solutions, samples and solvents used in HPLC runs were previously filtered through a 0.45 μm nylon filter membrane.
2.5 Date analysis
The best chromatographic fingerprint should contain maximum peak number, an appropriate distribution of each chemical component and good response under the experimental conditions selected, while the unsuitable fingerprint would only contain a large peak which is similar to content test. So, different chromatographic fingerprints at different UV wavelengths were recorded and the total chromatographic fingerprint obtained by adding the chromatograms acquired by DAD at each wavelength in the range between 210 and 360 nm was obtained. An unsupervised multivariate data analysis approach such as PCA was used. This method was widely used in traditional Chinese medicine (TCM) fingerprint analysis.19–21 The APA of each characteristic peak was calculated to indentify the components having distinct differences between paired samples. The correlation coefficients of entire chromatograms among different groups were calculated, and the mean chromatograms were calculated and created by the Computer Aided Similarity Evaluation System produced by our laboratory. It is widely accepted as a key technique in quality control of TCM.22–24 HCA is a multivariate analysis technique used to sort samples into groups.25,26 It was accomplished through the program written on MATLAB 7.1 here. In this study, centroid euclidean distance was selected as a measurement.
3 Results and discussion
3.1
HPLC fingerprints of SAA
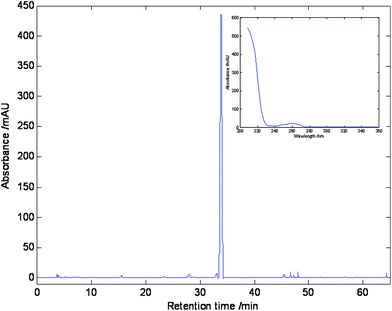
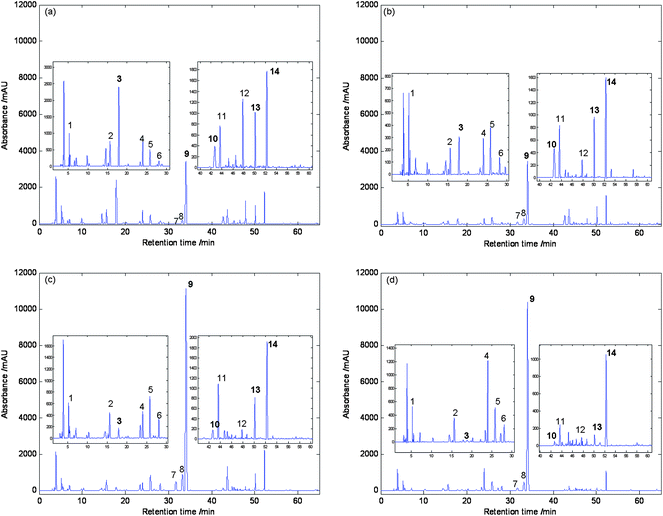
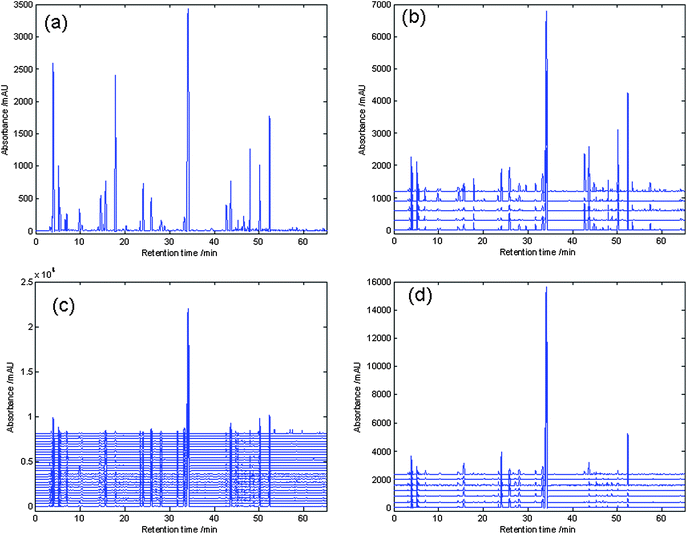
In order to establish an informative and reliable HPLC fingerprint of SAA, the chromatographic conditions such as the choice of solvent and selection of separation column were optimized. Extraction conditions were set up according to the China Pharmacopeia.3 Method reproducibility and repeatability were evaluated by five replicate injections of sample solution. Amygdalin for replicate injection was 1.2% of R.S.D. (n = 5) at 215 nm. Under this HPLC conditions, the UV detector response of amygdalin was linear in the concentration range between 20 and 800 μg mL−1. The regression equation was Y = 2.7038 × 10⁴x − 126.45 with r2 values of 0.9993. The detection limit for amygdalin was 2.5 μg mL−1 (S/N = 3). All results indicated that the conditions for the fingerprint analysis were satisfactory. In order to decide the best wavelength for analysis, the SAA from Gansu province (GsSAA) chromatograms at four typical different wavelengths are shown in Fig. 2, whereas Fig. 2(a) displays only one component (amygdalin), at concentration levels similar to those in the test. Fig. 2(b) and 2(c) exhibited lower responses under the wavelengths. In conclusion, the chromatograms added at UV absorbances from 210 nm to 360 nm would be the most appropriate chromatographic fingerprints than the other chromatograms at any other wavelength. The next PCA analysis would be based on the chromatograms added at UV absorbances from 210 nm to 360 nm.
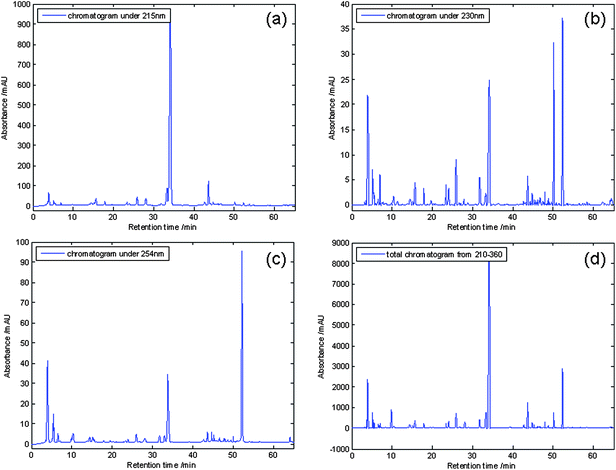 |
| | Fig. 2
Chromatograms at different wavelengths: (a) 215 nm, (b) 230 nm, (c) 254 nm, (d) the total chromatogram adding UV spectra recorded at each wavelength between 210 and 360 nm. | |
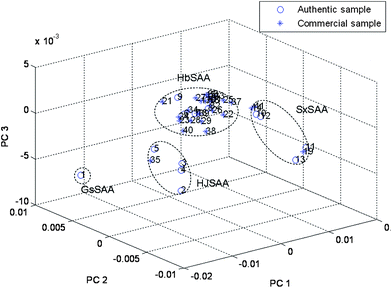 |
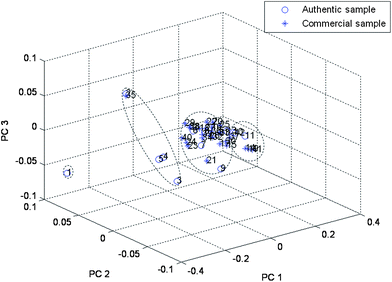
| | Fig. 3 The scatter plot obtained by PCA of 41 samples based on entire chromatograms: SAA from Gansu province (GsSSA) (No. 1); SAA from Heilongjiang and Jilin (HJSAA) (No. 2–5 and No. 35); SAA from Hebei (HbSAA) (No. 6–9, No. 15–18, No. 20–34 and No. 36–40); SAA from Shanxi (SxSAA) (No. 10–13, No. 14, No. 19 and No. 41). | |
PCA on the total chromatographic fingerprint (including 14 characteristic peaks) allowed the classification of the samples into groups depending on their composition The PCA scores plot (shown in Fig. 4(a)) demonstrated that information obtained from the 14 main components was enough for discrimination and classification of samples into different groups. The loadings plot of PCA (Fig. 4(b)) indicated that peaks 3, 9, 10, 13 and 14 (Fig. 5) may have more influence on the discrimination among different groups than the other peaks. These peaks could be seen from Fig. 5. For demonstration, the discrimination ability of a 5 component PCA was assessed (Fig. 6). Based on its retention time and on its UV absorbance spectrum, peak 9 was identified as amygdalin (Fig. 7). The UV spectra for the other four components is given in Fig. 8. According to NIST UV spectra database and previous reports,18,28 peak 13 most likely belong to benzaldehyde. UV spectra of Peaks 3 and 10 suggested low-conjugated structures. Peak 14 had a larger conjugated structure. However, further research was needed and the addition of them as HPLC markers for analysis of SAA was suggested by Quality Control Authorities.
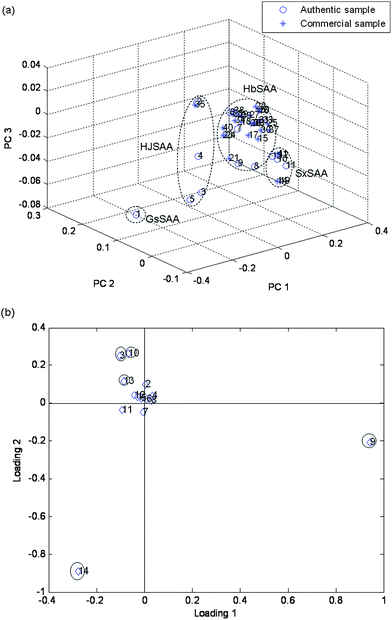 |
| | Fig. 4 Scores and loadings plot for 41 samples, using peak areas of 14 main components as input data. (a) 3D projection of two principal components (scores plot). GsSSA, (No. 1); HJSAA, (No. 2–5 and No. 35); HbSAA, (No. 6–9, No. 15–18, No. 20–34 and No. 36–40); SxSAA, (No. 10–13, No. 14, No. 19 and No. 41). (b) Corresponding loading plot No. 1–14 are peak 1–peak 14. | |
 |
| | Fig. 5 Mean chromatograms of (a) GsSSA; (b) HJSAA; (c) HbSAA; (d) SxSAA. 1, 2, 3, 4, 5, 6, 7, 8, 9, 10, 11, 12, 13 and 14 were thirteen main peaks for all samples. Peaks 3, 9 (Amygdalin), 10, 13 and 14 were 5 chemical makers. | |
 |
| | Fig. 6
PCA projection plot for the 41 samples, using peak areas of 5 chemical markers as input data. GsSSA, (No. 1); HJSAA, (No. 2–5 and No. 35); HbSAA, (No. 6–9, No. 15–18, No. 20–34 and No. 36–40); SxSAA, (No. 10–13, No. 14, No. 19 and No. 41). | |
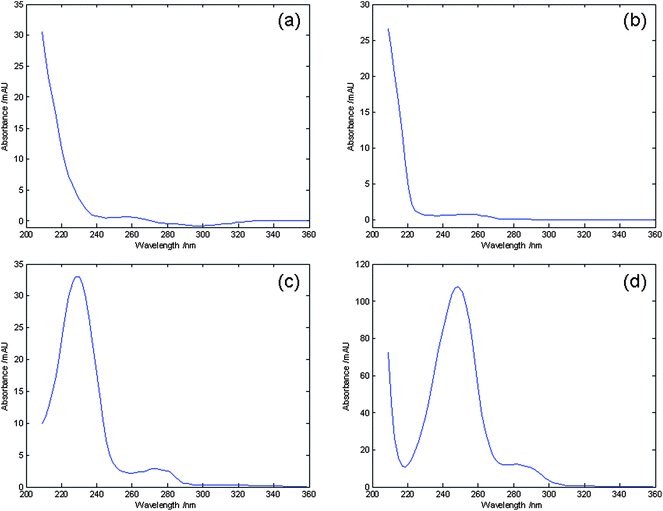 |
| | Fig. 8
UV spectra of: (a) peak 3; (b) peak 10; (c) peak 13; (d) peak14. | |
3.3
APA
The PCA based on total chromatographic fingerprint demonstrated the influence of the 14 peaks. The APAs of 14 main peak areas (Fig. 5) can be seen from Table 3.
Table 3 APAs of main components in those 41 samples between different groups
| Peak No. |
GsSAA (n = 1) |
HJSAA (n = 5) |
HbSAA (n = 28) |
SxSAA (n = 7) |
| 1 |
21184 |
13968 ± 3439 |
14483 ± 6300 |
10872 ± 2023 |
| 2 |
46619 |
13009 ± 9724 |
33990 ± 17665 |
22135 ± 1227 |
| 3 |
149990 |
18446 ± 12777 |
10969 ± 4575 |
1789 ± 1689 |
| 4 |
38776 |
16363 ± 20562 |
22686 ± 20423 |
56642 ± 30056 |
| 5 |
29511 |
22679 ± 13010 |
52662 ± 12017 |
30541 ± 11987 |
| 6 |
13582 |
7939 ± 4636 |
24146 ± 6596 |
16237 ± 3814 |
| 7 |
1933 |
10484 ± 4797 |
39409 ± 11462 |
11827 ± 6394 |
| 8 |
17670 |
25950 ± 14418 |
85212 ± 20546 |
46346 ± 16699 |
| 9 |
2952810 |
282778 ± 133630 |
1030860 ± 283372 |
910027 ± 248493 |
| 10 |
31124 |
35724 ± 35300 |
11444 ± 16198 |
2209 ± 4311 |
| 11 |
35303 |
38176 ± 27233 |
61035 ± 23463 |
10230 ± 10787 |
| 12 |
39374 |
8855 ± 5861 |
6148 ± 3620 |
552 ± 875 |
| 13 |
36149 |
32895 ± 19587 |
33977 ± 14569 |
5092 ± 2574 |
| 14 |
81708 |
69429 ± 45301 |
103431 ± 80041 |
47228 ± 48791 |
The APA shown in Table 3 indicate that concentration levels of the target analytes were similar among samples within the same group but had distinct concentrations compared to samples within other groups. Compared with the compounds of GsSAA, 4 components of HJSAA have distinct differences (peak 2, peak 4, peak 7 and peak 12). Compared with the composition of HbSAA, that of HJSAA had distinct difference in peaks 7, 8, 9 and 10. Compared to SxSAA, we can see that peaks 3, 7, 8, 9, 10, 11 and 12 of HJSAA were different. Thus, concentrations of SxSAA were up twice compared to those of HJSAA. HJSAA was different from HbSAA as regards to peaks 3, 4, 6, 9, 10, 11, 12 and 13. HbSAA composition was different from SxSAA mainly in peaks 10, 11, 12 and 13, as well as 3, 4, 7 and 14. On the whole, HbSAA and SxSAA were richer in amygdalin than samples from other origins, which might be attributed to the comfortable temperature condition there. The difference among these different clusters was mainly decided by peaks 3, 7, 9, 10 and 12. The result was consistent with that of PCA analysis.
3.4
SA of HPLC fingerprints by correlation coefficient
The correlation coefficient is a conventional method describing the similarity among different chromatograms. The closer to 1 the index, the more similar are the two chromatographic fingerprints. Correlation coefficient of similarity between the 41 fingerprints chromatographic profile of SAA samples were calculated (Table 4). The initial chromatograms are presented in Fig. 9 and the mean chromatograms (see Fig. 5) were generated by a method developed by our laboratory's TCM Quality Control System. In this research, the 4 kinds of mean chromatograms were applied as standard HPLC fingerprints. According to the results shown in Table 4, the mean correlation coefficient of every group was higher than 0.98, except for HJSAA (0.95, with a large relative standard deviation). Correlation among samples from four sources were significantly different from each other (all the correlation coefficient were below 0.95), especially for GsSAA, whose correlation coefficients included 0.8447, 0.7895 and 0.7461. Overall, the result of the correlation coefficient was referable and it had been widely used with some other methods in the quality control of TCMs.
Table 4 Similarity compared among different groups
| Sample group |
GsSSA (n = 1) |
HJSAA (n = 5) |
HbSAA (n = 28) |
SxSAA (n = 7) |
|
The correlation coefficient of each chromatogram to themselves mean chromatogram, mean ± S.D.
The correlation coefficient between different mean chromatograms.
|
|
GsSSA (n = 1) |
1.000a |
0.8447b |
0.7895b |
0.7461b |
|
HJSAA (n = 5) |
|
0.9591 ± 0.1930a |
0.9539b |
0.9295b |
|
HbSAA (n = 28) |
|
|
0.9892 ± 0.0126a |
0.9874a |
|
SxSAA (n = 7) |
|
|
|
0.9946 ± 0.0026a |
 |
| | Fig. 9
Chromatograms of (a) 1 authentic sample from Gansu; (b) 4 authentic samples from Jilin, and Heilongjiang and 1 commercial sample No. 35; (c) 4 authentic samples from Heibei and 24 commercial samples No. 15–18, No. 20–34, No. 36–40; (d) 4 authentic samples from Shanxi and 3 commercial samples No. 14, No. 19 and No. 41. | |
3.5 HCA
To assess the reliability of the categorization, HCA was also applied. Centroid Euclidean distance was selected as a measurement. The hierarchical clustering was accomplished by the program written in MATLAB 7.1. The dendrogram generated (see Fig. 10) allowed to extract the relationship characteristics. The samples could be classified into four clusters overall. Compared with the result of PCA, we could see that samples 3, 4, and 5 clustered to one group while sample 2 and sample 35 clustered to another group, which displayed some slight difference. In all, the result of HCA was clearer than the result of SA and is consistent with the result of PCA. By using these methodologies, the relationship among these samples was represented clearly.
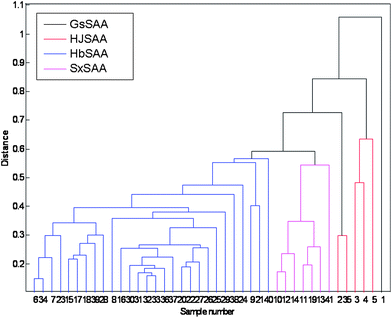 |
| | Fig. 10 The result of HCA of 41 samples. | |
3.6
PCA and HCA at other wavelengths
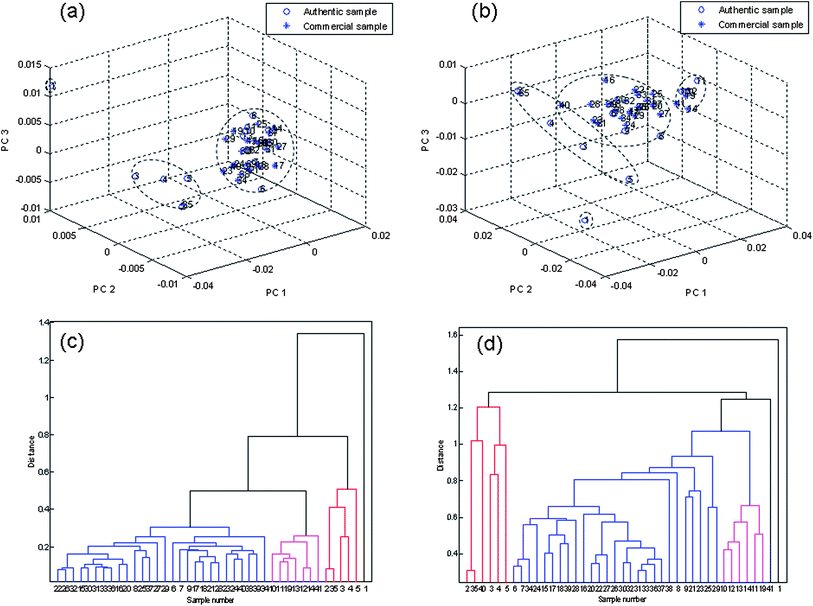
As referred to in section 2.5, analytical conclusions might be slightly different depending on the UV absorbance data introduced for modeling through PCA or HCA algorithms, so the PCA and HCA were employed again to analyse the chromatogram at 215 nm and 230 nm wavelengths (Fig. 11). From Fig. 11, we could conclude that when the chromatogram recorded at 215 nm was used, the samples were classified into three groups, but the HbSAA and the SxSAA blended together. By introducing the UV spectrum at 230 nm, HbSAA separated from the SxSAA well, but there was no definite confine between the HbSAA and HJSAA. Fig. 11(c) shows the classification result through HCA algorithms by introducing the spectrum at 215 nm, which is consistent with the result through PCA algorithms, while the classification result through HCA algorithms by introducing the spectrum at 230 nm was just passable, Fig. 11(d). Compared with the previous consequence, it was obvious that the total chromatographic fingerprints in the 210–360 nm range provided more information about chemical components in the herbals, and exhibited stronger ability in clustering samples, which might be a better methodology to analyze TCMs.
 |
| | Fig. 11
PCA and HCA at various wavelengths. (a) PCA at 215 nm; (b) PCA at 230 nm; (c) HCA at 215 nm; (d) HCA at 230 nm. | |
4 Conclusions
It is difficult to classify SAA as a function of its origin based on concentration levels of amygdalin and morphological variations. With the help of chemometric methods, say PCA, HCA and SA. 41 herbal samples of SAA from various sources can be accurately classified. The APAs of 14 main components were inspected. The result was generally consistent with the results of PCA, HCA and SA analysis. The consistency and disparity in chromatograms of different groups reflected the similar and dissimilar chemicals of samples from different origins exactly. The standard fingerprints of SAA could be employed to discriminate different habitats. The four novel chemical markers discovered by PCA, and amygdalin could be applied to accurate discrimination and quality control of SAA.
In this research, the total chromatographic fingerprint estimated, as explained in the introduction section, was demonstrated to be a better and more desirable research approach than the previous analysis at a single wavelength. It may be a better choice to control the quality of TCMs.
The method developed in this paper has demonstrated ability for discriminating herbals as a function of their origins, for determining the concentration of bioactive ingredients and for favouring a rational herbal usage.
Acknowledgements
This work was financially supported by the National Nature Foundation Committee of P.R. China (Grant No. 20875104 and 21075138) and the international collaboration project on modernization of Chinese herbal medicines, Ministry of Science and Technology of China. We are also grateful to all the employees of Zhongshang Zhongzhi pharmaceutical Co., LTD for their support of this research.
References
- Y. P. Zhu, Chin. Mater. Med., 1998, 1998, 496–498 Search PubMed.
-
J. H. Zhou, Y. M. Wang, Pharmacology of Traditional Chinese Medicine, Shanghai Scientific and Technical Publishers, Shanghai, 1986 Search PubMed.
-
Chinese Pharmacopoeia Committee, Chinese Pharmacopoeia, Chemical Industry Press, 2010 Search PubMed.
- S. K. Raychaudhuri, S. P. Raychaudhuri and E. M. Farber, Int. J. Immunopharmacol., 1998, 20, 661–667 CrossRef CAS.
- E. Araya, A. Rodriguez, J. Rubio and A. Spada, Bioorg. Med. Chem. Lett., 2005, 15, 1493–1496 CrossRef CAS.
- J. E. Poulton, Plant Physiol., 1990, 94, 401–405 CrossRef CAS.
- R. Bauer, Drug Inform. J., 1998, 32, 101–110 Search PubMed.
-
X. J. Yan, J. J. Zhou, G. R. Xie, G. W. A. Milne, Traditional Chinese Medicines: Molecular Structures, Natural Sources and Applications, Aldershot, Ashgate, 1999 Search PubMed.
-
P. H. Raven, R. F. Evert, S. E. Eichhorn, Biology of Plants, sixth ed., Freeman, New York, 1999 Search PubMed.
- J. Y. Koo, E. Y. Hwang, S. Cho, J. H. Lee, Y. M. Lee and S. P. Hong, J. Chromatogr., B: Anal. Technol. Biomed. Life Sci., 2005, 814, 69–73 CrossRef CAS.
- T. Isozaki, Y. Matano, K. Yamamoto, N. Kosaka and T. Tani, J. Chromatogr., A, 2001, 923, 249–254 CrossRef CAS.
- D. Chassagne, J. C. Crouzet, C. L. Bayonove and R. L. Baumes, J. Agric. Food Chem., 1996, 44, 3817–3820 CrossRef CAS.
- P. S. Xie, Chin. Drug Res. Clin. Pharm., 2001, 12, 141–169 Search PubMed.
- P. Valentao, P. B. Andrade, F. Areias, F. Ferreres and R. M. Seabra, J. Agric. Food Chem., 1999, 47, 4579–4582 CrossRef CAS.
- F. Gong, Y. Z. Liang, P. S. Xie and F. T. Chau, J. Chromatogr., A, 2003, 1002, 25–40 CrossRef CAS.
- A. Zhang, Y. L. Fang, H. Wang, J. Q. Song, Y. L. Zhang and S. R. Song, Chinese J. Anal. Chem., 2007, 35, 1614–1618 Search PubMed.
- Z. F. Hou and G. X. Sun, Lishizhen Med Mater Med Res., 2010, 9, 2353–2357 Search PubMed.
- D. R. Haisman and D. J. Knight, Biochem. J., 1967, 103, 528–534 CAS.
- M. P. Karisa, L. H. Janiece, J. J. Kevin, W. W. Bob and E. S. Robert, J. Chromatogr., A, 2005, 1096, 101–110 CrossRef.
- P. R. Kannel, S. Lee, S. R. Kanel and S. P. Khan, Anal. Chim. Acta, 2007, 582, 390–399 CrossRef CAS.
- X. H. Fan, Y. Wang and Y. Y. Cheng, J. Pharm. Biomed. Anal., 2006, 40, 591–597 CrossRef CAS.
- E. R. Collantes, R. Duta, W. J. Welsh and W. L. Zielinski, Anal. Chem., 1997, 69, 1392–1394 CrossRef CAS.
- X. Wang, W. Y. Wang, K. R. Zhang and K. S. Bi, J. Shenyang Pharm. Univ., 2003, 20, 360–366 Search PubMed.
- T. I. Aksenova, I. V. Tetko, A. G. Ivakhnenko, A. E. P. Villa, W. J. Welsh and W. L. Zielinski, Anal. Chem., 1999, 71, 2423–2430 CrossRef CAS.
- R. M. Yu, B. Ye, C. Y. Yan, L. Y. Song, Z. Zhang, W. Yang and Y. Zhao, J. Pharm. Biomed. Anal., 2007, 44, 818–823 CrossRef CAS.
- Y. P. Li, Z. Hu and L. C. He, J. Pharm. Biomed. Anal., 2007, 43, 1667–1672 CrossRef CAS.
- V. E. Tyler, J. Nat. Prod., 1999, 62, 1589–1592 CrossRef CAS.
-
H. Z. Zheng, Z. H. Dong, J. She, Modern Study of Traditional Chinese Medicine, Xue Yuan Press, fourth, Beijing, 2000 Search PubMed.
|
| This journal is © The Royal Society of Chemistry 2012 |
Click here to see how this site uses Cookies. View our privacy policy here.