Evaluation of antibacterial effect and mode of Coptidis rhizoma by microcalorimetry coupled with chemometric techniques
Weijun
Kong
ab,
Jiabo
Wang
b,
Xiaohe
Xiao
*b,
Shilin
Chen
a and
Meihua
Yang
*a
aInstitute of Medicinal Plant Development, Chinese Academy of Medical Sciences, Peking Union Medical College, Beijing, 100193, China. E-mail: kongwj302@126.com; Tel: +86 10 66933322 Tel: +86 10 57833277
bChina Military Institute of Chinese Materia Medica, 302 Military Hospital of China, Beijing, 100039, P.R. China
First published on 7th November 2011
Abstract
In this study, the antibacterial effect and mode of Coptidis rhizoma on Escherichia coli was evaluated by microcalorimetry coupled with chemometric techniques. Using an isothermal microcalorimeter, the metabolic profiles of E. coligrowth at 37 °C affected by 15 batches of C. rhizoma were measured. Through principal component analysis (PCA) on nine quantitative thermo-kinetic parameters obtained from the metabolic power–time profiles of E. coli, the antibacterial effects of C. rhizoma from various sources could be easily evaluated by analyzing the change of the two main thermo-kinetic parameters, growth rate constant k2 and maximum heat-output power P2m, in the second exponential phase of E. coligrowth. Then, hierarchical clustering analysis (HCA) was carried out on the two parameters to distinguish those C. rhizoma samples in respect to their antibacterial effects. Clear results were obtained to show that all 15 C. rhizoma samples with different antibacterial effects could be successfully grouped in accordance with their origins. Ranked in decreasing order, the antibacterial mode of C. rhizoma samples that were from Sichuan province had the strongest antibacterial effects, followed by samples from Chongqing city and Hubei province. Our results revealed that the developed microcalorimetry with chemometric techniques had the potential perspective for evaluating the effect and mode of Coptidis rhizoma and other Chinese materia medicas.
1. Introduction
In recent years, Chinese materia medicas (CMMs), with their complementary therapeutic effects to western medicines and capability to deal with many essential problems that have not yet been solved by conventional medicinal practices, have been attracting more and more attention. Coptidis rhizoma (C. rhizoma, Huanglian in Chinese)1 is among the more commonly used herbal drugs in CMMs, with the reported efficacies of suppressing fever, dispelling dampness, removing toxicosis and detoxification. Also, it has wide antitumor,2 antihypercholesterolic,3 antimicrobial,4,5 and anti-inflammatory6 effects. The dried roots of Coptis chinensis Franch., Coptis deltoidea C.Y. Cheng et Hsiao and Coptis teeta Wall. are the major sources of C. rhizoma,1 and different sources or species of C. rhizoma are known to have widely different bioactivities and pharmacodynamic actions,6,7 showing that the internal qualities of them are different. So, it is necessary to comprehensively evaluate the effects of C. rhizoma from different sources for establishing the quality specification of this CMM, so as to ensure the clinical efficacies of them.As we know, the quality evaluation of CMM should consist of two aspects. One is the chemical analysis including qualitative and quantitative determination of one or several high-content components and fingerprinting analysis of different samples,8 which has been introduced and accepted by the WHO,9 and State Food and Drug Administration (SFDA) of China.10 The other is the evaluation of pharmacodynamic action. Some reports have demonstrated the quality differences of C. rhizoma by chemical analysis.11 So the evaluation of pharmacodynamic action including antimicrobial effects of this CMM should be studied deeply and widely by useful and sensitive methods.12,13 To our knowledge, no previous studies have been published on evaluating the antibacterial mode of C. rhizoma.
Microcalorimetry, with its high sensitivity, high accuracy and ability of automation, has been used widely for evaluating the antimicrobial effects of many drugs and compounds.14–16 From the metabolic profile of microbial growth affected by various substances, some important qualitative and quantitative information could be obtained to detect and analyze the changes of the total metabolic state of microbes due to patho-physiological stimuli, further to present the antimicrobial effects of these substances. Nowadays, metabolic profile is being used to evaluate the effects of these substances and has been an attractive candidate for mode-of-action studies.17
In this study, the antibacterial effect and mode of 15 batches of C. rhizoma on Escherichia coli (E. coli) growth were evaluated by microcalorimetry. And the metabolic profile of E. coli affected by C. rhizoma from various sources was acquired. Then, chemometric techniques including principal component analysis (PCA) and hierarchical clustering analysis (HCA) were carried out on the quantitative parameters obtained from the metabolic profile of E. coli to distinguish samples according to their antibacterial effects; further, the possible antibacterial mode of C. rhizoma was explored.
2. Experimental
2.1. Instrument
A thermal activity monitor (TAM) air isothermal microcalorimeter (Thermometric AB, Sweden) was used to determine the metabolic power–time profiles of E. coligrowth. This microcalorimeter is an eight-channel twin instrument and thermostated at the range of 5–60 °C, with a limit of detectability of 2 μW. For more details of the instrument, see the report of Wadsö.18 The temperature of the calorimeter system and the isothermal box was controlled at 37 °C. Meanwhile, a computer was used to monitor continuously and record the metabolic power–time signals of E. coligrowth in the ampoule.2.2. Materials
Fifteen batches of C. rhizoma from Sichuan, Hubei provinces and Chongqing city were collected and labeled in Table 1. All of them were identified by Professor Xiao-He Xiao and deposited at China Military Institute of Chinese Materia Medica, 302 Military Hospital of China, Beijing, China. High-purity water was obtained by a Millipore Milli-Q water purification system (Milipore, Bedford, MA, USA).| Sample no. | Sources | Origins | Harvesting time | Description |
|---|---|---|---|---|
| A | Shizhu, Sichuan | Coptis chinensis Franch. | February 2007 | Dried |
| B | Shizhu, Sichuan | Coptis chinensis Franch. | August 2007 | Dried |
| C | Shizhu, Sichuan | Coptis chinensis Franch. | December 2007 | Dried |
| D | Emei, Sichuan | Coptis chinensis Franch. | August 2007 | Dried |
| E | Dayi, Sichuan | Coptis chinensis Franch. | November 2006 | Dried |
| F | Dayi, Sichuan | Coptis chinensis Franch. | August 2007 | Dried |
| G | Pengxian, Sichuan | Coptis chinensis Franch. | July 2006 | Dried |
| H | Chengkou, Sichuan | Coptis chinensis Franch. | February 2007 | Dried |
| I | Wuxi, Sichuan | Coptis chinensis Franch. | August 2007 | Dried |
| J | Huangshui, chongqing | Coptis chinensis Franch. | February 2007 | Dried |
| K | Huangshui, chongqing | Coptis chinensis Franch. | August 2007 | Dried |
| L | Enshi, Hubei | Coptis chinensis Franch. | August 2007 | Dried |
| M | Lichuan, Hubei | Coptis chinensis Franch. | August 2007 | Dried |
| N | Fangxian, Hubei | Coptis chinensis Franch. | July 2007 | Dried |
| O | Laifeng, Hubei | Coptis chinensis Franch. | July 2007 | Dried |
Strain E. coli (CCTCC AB91112) was provided by China Center for Type Culture Collection, Wuhan University, Wuhan, China. It was inoculated in Luria–Bertani (LB) culture medium which contained per 1000 mL (pH 7.2–7.40): 10 g peptone, 5 g yeast extract and 5 g NaCl and was sterilized in high pressure (0.1 MPa) steam at 121 °C for 30 min.
2.3. Sample preparation
All of the dried C. rhizoma samples were cut into small pieces and further ground into powder and oven-dried at 50 °C until a constant weight was reached. 20 g of the powder was accurately weighed and extracted with 200 mL water by refluxing for 1.5 h. The extraction was repeated two additional times and the extracts were combined. Then, the combined extract was filtered and evaporated to dryness using a rotary evaporator at 50 °C. The residue was then dissolved in water to yield the sample solution for the antibacterial experiments.2.4. Experimental procedure
In this calorimetric experiment, the TAM air isothermal microcalorimeter with ampoule mode was applied to measure the metabolic profile of E. coligrowth. E. coli was inoculated in the prepared 5 mL culture medium in a 20 mL glass ampoule, and the initial population density was 4.5 × 10³cells mL−1. Each of the C. rhizoma samples was added into each glass ampoule, respectively, and the final concentration of each C. rhizoma sample in the ampoule was 9.0 mg mL−1. Then, the glass ampoules were sealed with a cap and put into the microcalorimeter after the equipment was thermostated at 37 °C. The growth process of E. coli with and without a C. rhizoma sample was monitored continuously. The experiments above were all carried out under aseptic conditions.3. Results and discussion
3.1. Metabolic power–time profiles and growth rate constant of E. coli
The metabolism of E. coligrowth in culture media was studied and the metabolic power–time profiles were recorded. The result was shown in Fig. 1(a). Since the E. colimetabolic process was monitored in isothermal and isochoric conditions, the nutrient and oxygen consumed by cells were in limited supply. The metabolic power–time profiles of E. coli could be divided into two stages: stage 1 and 2 and five phases: a lag phase (a–b), the first exponential phase (b–c), a transition phase (c–d), the second exponential phase (d–e) and a decline phase (e–f).19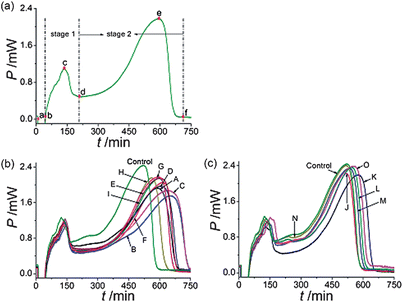 | ||
| Fig. 1 Metabolic power–time profiles of E. coligrowth (a) without drug, and affected by C. rhizoma samples of (b) 9 from Sichuan province, (c) 2 samples from Chongqing city and 4 from Hubei province. The final concentration of all C. rhizoma samples were 9.0 mg mL−1. | ||
The metabolic power–time profiles of E. coligrowth in Fig. 1(a) showed that the bacterial growth was an exponential model in the growth processes giving the following equation:20
| Pt = P0 exp(kt) or ln Pt = ln P0 + kt | (1) |
3.2. Microcalorimetric method validation
To obtain the optimal experimental results, the equivalency of the eight channels in the isothermal microcalorimeter, the reproducibility of the microcalorimetric method was validated. The correlation coefficient R of the growth rate constant k of E. coli and the relative standard deviation (RSD) of the each channel were taken as the indicators for this validation. Sample B of C. rhizoma in Table 1 was randomly selected in method development studies. The parameters k1 and k2 were the growth rate constants in the first and second exponential phases, respectively.For the equivalency of the eight channels, an E. coli suspension without the drug was added into each channel in triplicate experiments. The reproducibility of the method was evaluated by running sample B of C. rhizoma in triplicate. As shown in Table 2, the R values of k1 and k2 for the equivalency of the eight channels were all more than 0.9975 with RSDs of 0.73% and 0.65%, respectively, and the R values of k1 and k2 for the reproducibility of the microcalorimetric method were in the range of 0.9974–0.9988 and 0.9983–0.9993 with RSDs of 0.71% and 1.37%, respectively. The above results illustrated that the eight channels were equivalent, and that the microcalorimetric method was precise, stable and sensitive enough for evaluation of the antibacterial effects of C. rhizoma.
| Channel | Equivalency (n = 3) | Reproducibility (n = 3) | ||||||
|---|---|---|---|---|---|---|---|---|
| k 1/min−1 | R a | k 2/min−1 | R | k 1/min−1 | R | k 2/min−1 | R | |
| a Correlation coefficient. b Relative standard deviation. | ||||||||
| 1 | 0.01206 | 0.9983 | 0.00647 | 0.9991 | 0.00903 | 0.9985 | 0.00394 | 0.9991 |
| 2 | 0.01211 | 0.9981 | 0.00652 | 0.9993 | 0.00908 | 0.9980 | 0.00399 | 0.9993 |
| 3 | 0.01183 | 0.9978 | 0.00649 | 0.9991 | 0.00913 | 0.9974 | 0.00395 | 0.9988 |
| 4 | 0.01192 | 0.9976 | 0.00650 | 0.9989 | 0.00916 | 0.9975 | 0.00401 | 0.9984 |
| 5 | 0.01201 | 0.9977 | 0.00651 | 0.9990 | 0.00911 | 0.9983 | 0.00404 | 0.9990 |
| 6 | 0.01205 | 0.9988 | 0.00655 | 0.9988 | 0.00902 | 0.9988 | 0.00389 | 0.9983 |
| 7 | 0.01198 | 0.9989 | 0.00643 | 0.9992 | 0.00904 | 0.9981 | 0.00397 | 09989 |
| 8 | 0.01199 | 0.9991 | 0.00644 | 0.9991 | 0.00900 | 0.9979 | 0.00400 | 0.9991 |
| RSD (%)b | 0.73 | 0.65 | 0.71 | 1.37 | ||||
3.3. Metabolic power–time profiles of E. coligrowth affected by C. rhizoma
The metabolic power–time profiles of E. coligrowth affected by various sources of C. rhizoma at the final concentration of 9.0 mg mL−1 were shown in Fig. 1(b) and (c). As seen from the figures, compared with the control, the height of the highest peak of each curve was reduced, showing that E. coligrowth was inhibited by C. rhizoma. But, the extents to which the highest peak was reduced were different for different samples, which illustrated that different samples had different inhibitory effects on E. coli.3.4. Thermo-kinetic data for E. coligrowth affected by C. rhizoma
From the metabolic power–time profiles of E. coligrowth affected by C. rhizoma, nine quantitative thermo-kinetic data were obtained and listed in Table 3. P1m and P2m were the two maximum heat-output powers of the first and second peaks. t1m and t2m were the appearance times of P1m and P2m, respectively. Qsta1 and Qsta2 were the heat outputs of stage 1 and 2 and Qt was the total heat output of E. coligrowth.| Sample | k 1/min−1 | k 2/min−1 | P 1 m/mW | P 2 m/mW | t 1 m/min | t 2 m/min | Q sta1/J | Q sta2/J | Q t/J |
|---|---|---|---|---|---|---|---|---|---|
| Control | 0.01355 | 0.00677 | 1.257 | 2.444 | 121.5 | 522.8 | 6.73 | 22.70 | 29.43 |
| A | 0.01181 | 0.00435 | 1.231 | 1.928 | 141.3 | 592.3 | 5.73 | 16.59 | 22.32 |
| B | 0.00911 | 0.00405 | 1.079 | 1.753 | 143.7 | 646.7 | 4.98 | 16.07 | 21.05 |
| C | 0.01108 | 0.00411 | 1.217 | 1.873 | 141.3 | 639.5 | 5.23 | 16.17 | 21.40 |
| D | 0.01243 | 0.00492 | 1.142 | 1.970 | 138.8 | 602.2 | 5.21 | 17.27 | 22.48 |
| E | 0.00989 | 0.00597 | 1.173 | 2.153 | 136.2 | 602.2 | 5.24 | 17.74 | 22.98 |
| F | 0.01224 | 0.00556 | 1.179 | 2.058 | 136.2 | 614.5 | 5.94 | 17.28 | 23.22 |
| G | 0.01148 | 0.00609 | 1.108 | 2.179 | 136.2 | 594.7 | 6.13 | 18.96 | 25.09 |
| H | 0.00979 | 0.00605 | 1.103 | 2.160 | 129.0 | 560.2 | 6.42 | 21.58 | 28.00 |
| I | 0.01037 | 0.00574 | 1.118 | 2.148 | 133.7 | 599.8 | 6.02 | 18.71 | 24.73 |
| J | 0.01016 | 0.00627 | 1.165 | 2.231 | 136.5 | 518.0 | 6.65 | 21.88 | 28.53 |
| K | 0.01208 | 0.00615 | 1.084 | 2.193 | 129.2 | 574.8 | 5.58 | 17.27 | 22.85 |
| L | 0.01313 | 0.00624 | 1.135 | 2.342 | 133.7 | 530.3 | 5.16 | 17.87 | 23.03 |
| M | 0.01168 | 0.00634 | 1.215 | 2.373 | 131.3 | 545.0 | 6.06 | 19.64 | 25.70 |
| N | 0.01161 | 0.00640 | 1.187 | 2.404 | 123.8 | 518.0 | 6.22 | 21.90 | 28.18 |
| O | 0.01148 | 0.00638 | 1.235 | 2.385 | 151.2 | 555.0 | 6.33 | 22.40 | 28.73 |
The data in Table 3 showed that the values of the nine metabolic parameters had different changing trends with various C. rhizoma samples. Compared with the control, the values of k1, k2, P1m, P2m, Qsta1, Qsta2 and Qt decreased and the values of t1m, t2m increased, demonstrating that all C. rhizoma samples had the ability to inhibit E. coligrowth to different extents and that the inhibitory extent varied with various sources of C. rhizoma. The increasing values of t1m and t2m indicated that E. coligrowth was inhibited and the bacterial culture might take a longer time to produce a sufficient number of cells for a detectable signal. This probably resulted from the fact that the C. rhizoma samples combined with the cell to inhibit the duplication of DNA, resulting in damage of the membrane structure and functions of cells. The thermo-kinetic parameters of E. coligrowth in Table 3 were different for all C. rhizoma samples. The smaller the values of k1, k2, P1m, P2m, Qsta1, Qsta2, Qt and the bigger the values of t1m, t2m are, the stronger the antibacterial effects are that the drug possesses.21 For explaining intuitively the inhibitory effects of different C. rhizoma samples on E. coli, the column maps of the nine quantitative metabolic parameters in Fig. 2 showed the changes of the nine thermo-kinetic parameters. The general results from Fig. 1(b) and (c), Fig. 2 and Table 3 showed that the sequence of antibacterial effect of C. rhizoma from various sources on E. coligrowth was: B > C > A > D > F > I > E > H > G > K > J > L > M > O > N. Sample B sample in Table 1 with the smallest k1, k2, P1m, P2m, Qsta1, Qsta2, and Qt values had the strongest antibacterial effect, but sample N had adverse results. As we know, sample B was collected from Shizhu city, Sichuan province, in the southwest area of China, while sample N was produced in Fangxian, Hubei province, in the central area of China. These indicated that the antibacterial effect of C. rhizoma was related to the production place and the latitude and longitude of the place of this CMM.
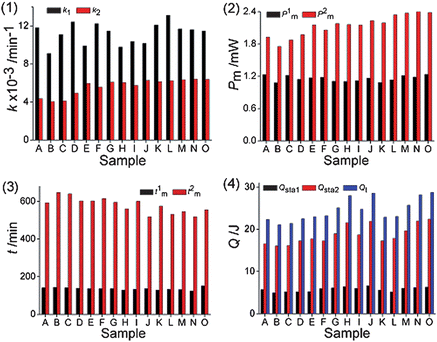 | ||
| Fig. 2 Column maps of the nine parameters metabolic parameters. The nine quantitative metabolic parameters were: (1) the growth rate constant k1 and k2; (2) the maximum heat-output power P1m and P2m; (3) the appearance time t1m and t2m of P1m and P2m; (4) the heat output Qsta1, Qsta2 and Qt. | ||
3.5 Hierarchical clustering analysis of C. rhizoma samples based on the nine metabolic parameters
Hierarchical clustering analysis (HCA) is a multivariate analysis technique that is used to sort samples into different clusters. This technique comprises an unsupervised classification procedure that involves measuring either the distance or the similarity between the objects to be clustered. The similarity or dissimilarity between samples (objects) is usually represented in a dendrogram for ease of interpretation. Each object is similar to the others within a group but different from those in other groups with respect to a predetermined selection criterion.22 In order to find the antibacterial mode of C. rhizoma samples from various sources, HCA on the values of the nine quantitative metabolic parameters in Table 3 was performed using SPSS 13.0 software (Chicago, USA). The Ward's method as the amalgamation rule and the squared Euclidean distance as metric were used to establish clusters.It could be seen from the results of HCA for C. rhizoma samples from various sources in Fig. 3 that all the samples could be distinguished into three clusters. But the samples in each group were not necessarily close. Cluster I consisted of four samples from Sichuan province, one sample from Chongqing city and two samples from Hubei province. Cluster II consisted of four samples from Sichuan province, while cluster III consisted of two samples from Hubei province, one from Sichuan province and one from Chongqing city. So, it was difficult to find the antibacterial mode of all C. rhizoma samples. This phenomenon might result from the multivariate problems. There were nine metabolic parameters for HCA and the internal information of these parameters was different and the contribution of each parameter for HCA was different. Then, it was necessary to find out the main parameter(s) which played a more important role in representing the antibacterial effect of C. rhizoma and HCA of these samples. By analyzing the change tendency of the main parameter(s), the antibacterial effect could be evaluated better and faster and the antibacterial mode could be explored well by HCA.
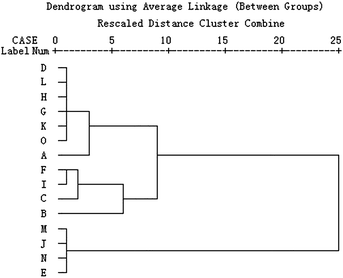 | ||
| Fig. 3 HCA results of C. rhizoma samples from various sources. This dendrogram was acquired based on the nine metabolic parameters obtained from the metabolic profiles of E. coligrowth affected by C. rhizoma. | ||
3.6. Principal component analysis on the nine metabolic parameters
Principal component analysis (PCA) is a popular method in applied statistical work and data analysis, and it has a good ability to summarize multivariate variation. It allows visualizing the information of the data set in a few principal components retaining the maximum possible variability within that set.11,23–25 Therefore, PCA is recommended to reduce the computation burden. In this study, PCA on the nine metabolic parameters was performed using software of Unscrambler 9.7 from Camo AS (Trondheim, Norway).The loadings plot of PCA on the nine metabolic parameters was shown in Fig. 4(a). For the log centered data set with 99.62% of explained variance by the first two principal components (parameters), the scatter plot of the loading showed a good distribution of these parameters. This plot indicated that parameters 2 (k2) and 4 (P2m) may be the two main parameters playing a more important role in evaluating the antibacterial effect and mode of C. rhizoma samples from various sources. From the values of k2 and P2m in Table 3, it could be quickly and clearly found that the sequence of antibacterial effect of C. rhizoma on E. coligrowth was: B > C > A > D > F > I > E > H > G > K > J > L > M > O > N, which was same as the above-mentioned results.
On the basis of eigenvalues >1 from the first two principal components PC1 and PC2, the scores plot of PCA for C. rhizoma samples from various sources was shown in Fig. 4(b). The results showed three site-related groups, which were marked as groups I, II and III according to different provinces and cities, respectively. Although producing exactly the same pattern of loadings, the map gave a clear classification of all C. rhizoma samples. From these plots, one could see clearly that the samples of the same or similar source (province and city) would cluster together in the PCA projections. Group I consisted of C. rhizoma samples from Shizhu city Sichuan province, group II consisted of the samples from Chongqing city and other cities in Sichuan province, and group III consisted of the samples from Hubei province. Combined with the above results, it could be found that the samples in group I from Shizhu city Sichuan province had the strongest antibacterial effects and the samples in group III from Hubei province had the adverse results. These 15 samples with different antibacterial effects could be successfully grouped in accordance with the province and city of origin. Ranked in decreasing order, the antibacterial mode of C. rhizoma was that samples from Sichuan province had the strongest antibacterial effects, followed by samples from Chongqing city and then Hubei province.
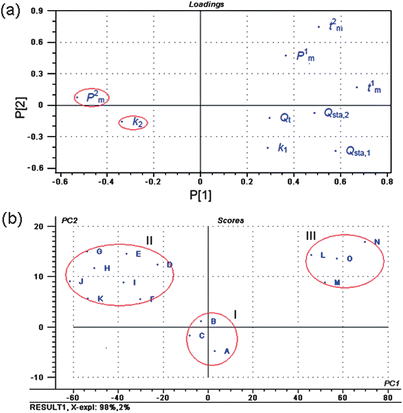 | ||
| Fig. 4 (a) Loadings plot of PCA on the nine metabolic parameters, and (b) scores plot of PCA for C. rhizoma samples from various sources on the first two PCs. These plots were obtained by PCA on the nine metabolic parameters from the metabolic power–time profiles of E. coligrowth using software of Unscrambler 9.7 from Camo AS (Trondheim, Norway). | ||
3.7. HCA of C. rhizoma samples based on the two main metabolic parameters
HCA based on the two main metabolic parameters k2 and P2m was performed using SPSS 13.0 software to validate the antibacterial mode of C. rhizoma from PCA. The new HCA results were shown in Fig. 5, from which the antibacterial mode were revealed and validated clearly. Supposing an appropriate distance level (Level II) chosen, the samples could be classified into three clusters. Cluster I consisted of the C. rhizoma samples from Sichuan province, cluster II consisted of the samples from Chongqing city and cluster III consisted of samples from Hubei province. If a higher distance level (Level I) was adopted, all the samples could be classified into two clusters. Samples K and J from Chongqing city tended to be classified into the cluster consisted of samples from Sichuan province, which indicated that the samples from Chongqing city and those from Sichuan province were very similar. In other words, the antibacterial effects of C. rhizoma samples from Chongqing city had close relationships with those from Sichuan province, but were quite different from those collected from Hubei province. In all, it could be seen clearly that the antibacterial mode of C. rhizoma was that samples from Sichuan province had the strongest antibacterial effect, followed by samples from Chongqing city and Hubei province.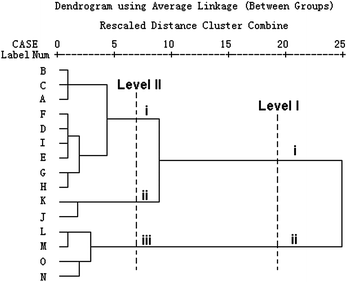 | ||
| Fig. 5 New HCA results of C. rhizoma samples from various sources. This dendrogram was acquired based on the two main metabolic parameters got from PCA on the nine parameters. The C. rhizoma samples could be distinguished into three clusters: (I) samples from Sichuan province, (II) samples from Chongqing city, and (III) samples Hubei province. | ||
4. Conclusions
This study has shown that the samples from Shizhu city Sichuan province had the strongest antibacterial effects, while the samples from Hubei province had the poorest antibacterial effects, revealing partly that C. rhizoma samples from Shizhu city Sichuan province had the best internal quality. And the relationships between the antibacterial effect or mode and the contents of the main constituents in C. rhizoma need further study and clarification. This will be our target and task in the prospective study.This study also illustrated that it was possible for microcalorimetry coupled with chemometric techniques to evaluate the antibacterial effect and mode of C. rhizoma samples from various sources with the help of PCA and HCA, which further proved that the developed microcalorimetry with chemometric techniques had potential for evaluating the effect and mode of Coptidis rhizoma and other Chinese materia medicas.
Acknowledgements
The authors are grateful for the support from the Science and Technology Major Program (Nos. 2009ZX09502-022 and 2009ZX09502-025), the Industry Research Program of Traditional Chinese Medicine (No. 200807020) and the National Science Foundation of China (Nos. 30973947 and 81173539).References
- China Pharmacopoeia Committee, China Pharmacopoeia (vol. I), Chemical Industry Press, Beijing, 2005, p. A213 Search PubMed.
- N. Iizuka, K. Miyamoto, S. Hazama, S. Yoshino, K. Yoshimura, K. Okita, T. Fukumoto, S. Yamamoto, A. Tangoku and M. Oka, Anticachectic effects of Coptidis Rhizoma, an anti-inflammatory herb, on esophageal cancer cells that produce interleukin 6, Cancer Lett., 2000, 158, 35–41 CrossRef CAS.
- T. Yokozawa, A. Ishida, E. J. Chao and T. Nakagawa, The effects of Coptidis rhizoma extract on an hypercholesterolemic animal model, Phytomedicine, 2003, 10, 17–22 CrossRef CAS.
- L. Wang, X. L. Nv, L. Sun, Y. N. Shen and W. D. Liu, Studies on antifungal activity of extracts from six traditional Chinese Medicines against dermatophyte genus, Chin. J. Derm. Venereol., 2008, 22, 498–500 Search PubMed.
- C. M. Dai, D. Wang and Y. Q. Sun, Microcalorimetry study on the Escherichia Coli metabolism affected by Coptis Roots in different areas, J. Jinzhou Med. College, 2005, 26, 5–7 Search PubMed.
- R. Enk, R. Ehehalt, J. E. Graham, A. Bierhaus, A. Remppis and H. J. Greten, Differential effect of Rhizoma coptidis and its main alkaloid compound berberine on TNF-α induced NFKB translocation in human keratinocytes, J. Ethnopharmacol., 2007, 109, 170–175 CrossRef CAS.
- H. A. Kwon, Y. J. Kwon, D. Y. Kwon and J. H. Lee, Evaluation of antibacterial effects of a combination of Coptidis Rhizoma, Mume Fructus, and Schizandrae Fructus against Salmonella, Int. J. Food Microbiol., 2008, 127, 180–183 CrossRef.
- H. Z. Lian and Y. Wei, Chromatographic fingerprints of industrial toluic acids established for their quality control, Talanta, 2007, 71, 264–269 CrossRef CAS.
- World Health Organization, Guidelines for the Assessment of Herbal Medicines, WHO, Munich, Geneva, 1991 Search PubMed.
- State Food Drug Administration of China, Technical Requirements for the Development of Fingerprints of TCM Injections, SFDA, Beijing, 2000 Search PubMed.
- Y. Chen, S. B. Zhu, M. Y. Xie, S. P. Nie, W. Liu, C. Li, X. F. Gong and Y. X. Wang, Quality control and original discrimination of Ganoderma lucidum based on high-performance liquid chromatographic fingerprints and combined chemometrics methods, Anal. Chim. Acta, 2008, 623, 146–156 CrossRef CAS.
- E. J. Cho, T. Yokozawa, S. H. Rhee and K. Y. Park, The role of Coptidis Rhizoma extract in a renal ischemia-reperfusion model, Phytomedicine, 2004, 11, 576–584 CrossRef CAS.
- C. M. Dai, X. H. Xiao, Y. J. Hu, Y. Q. Sun and Y. Liu, Quality evaluation of Rhizoma coptidis by microcalorimetry, Chin. Trad. Patent Med., 2008, 30, 1179–1182 Search PubMed.
- W. J. Kong, Y. L. Zhao, L. M. Shan, X. H. Xiao and W. Y. Guo, Microcalorimetric studies of the action on four organic acids in Radix isatidis on the growth of microorganisms, Chin. J. Biotechnol., 2008, 24, 646–650 CrossRef CAS.
- Z. Simoncic, P. Zupancic, R. Roskar, A. Gartner, K. Kogej and V. Kmetec, Use of microcalorimetry in determination of stability of enalapril maleate and enalapril maleate tablet formulations, Int. J. Pharm., 2007, 342, 145–151 CrossRef CAS.
- W. J. Kong, Y. L. Zhao, L. M. Shan, X. H. Xiao and W. Y. Guo, Investigation on the spectrum-effect relationships of EtOAc extract from Radix Isatidis based on HPLC fingerprints and microcalorimetry, J. Chromatogr., B, 2008, 871, 109–114 CrossRef CAS.
- E. D. Brown and G. D. Wright, New targets and screening approaches in antimicrobial drug discovery, Chem. Rev., 2005, 105, 759–774 CrossRef CAS.
- I. Wadsö, Isothermal microcalorimetry in applied biology, Thermochim. Acta, 2002, 394, 305–311 CrossRef.
- W. J. Kong, J. B. Wang, X. Y. Xing, C. Jin, X. H. Xiao, Y. L. Zhao, P. Zhang, Q. C. Zang and Z. L. Li, Screening for novel antibacterial agents based on the activities of compounds on metabolism of Escherichia coli: A microcalorimetric study, J. Hazard. Mater., 2011, 185, 346–352 CrossRef CAS.
- W. J. Kong, J. B. Wang, C. Jin, Y. L. Zhao, C. M. Dai, X. H. Xiao and Z. L. Li, Effect of emodin on Candida albicans growth investigated by microcalorimetry combined with chemometric analysis, Appl. Microbiol. Biotechnol., 2009, 83, 1183–1190 CrossRef CAS.
- X. Li, Y. Liu, J. Wu, H. G. Liang and S. S. Qu, Microcalorimetric study of Staphylococcus aureus growth affected by selenium compounds, Thermochim. Acta, 2002, 387, 57–62 CrossRef CAS.
- P. R. Kannel, S. Lee, S. R. Kanel and S. P. Khan, Chemometrics in assessment of seasonal variation of water quality in fresh water systems, Anal. Chim. Acta, 2007, 582, 390–399 CrossRef CAS.
- L. Z. Yi, D. L. Yuan, Y. Z. Liang, P. S. Xie and Y. Zhao, Quality control and discrimination of Pericarpium Citri Reticulatae and Pericarpium Citri Reticulatae Viride based on high-performance liquid chromatographic fingerprints and multivariate statistical analysis, Anal. Chim. Acta, 2007, 588, 207–215 CrossRef CAS.
- Z. B. Yi, Y. Yu, Y. Z. Liang and B. Zeng, Evaluation of the antimicrobial mode of berberine by LC/ESI-MS combined with principal component analysis, J. Pharm. Biomed. Anal., 2007, 44, 301–304 CrossRef CAS.
- J. H. Chen, F. M. Wang, J. Liu, F. S. C. Lee, X. R. Wang and H. H. Yang, Analysis of alkaloids in Coptis chinensis Franch by accelerated solvent extraction combined with ultra performance liquid chromatographic analysis with photodiode array and tandem mass spectrometry detections, Anal. Chim. Acta, 2008, 613, 184–195 CrossRef CAS.
| This journal is © The Royal Society of Chemistry 2012 |