Effect of acid concentration on pore size in polymer-templated mesoporous alumina†
Stacy M.
Grant
and
Mietek
Jaroniec
*
Department of Chemistry and Biochemistry, Kent State University, Kent, OH 44242, USA. E-mail: jaroniec@kent.edu; Fax: +01 330 672-3816; Tel: +01 330 672-2891
First published on 27th September 2011
Abstract
Ordered mesoporous alumina and alumina-titania composites can be prepared in a facile and reproducible manner by mixing metal precursors, acid, solvent and polymer template in one-pot and performing evaporation induced self assembly followed by removal of the template. Structural characteristics, particularly pore size, of these materials can be tailored by controlling the acid concentration in the synthesis mixture. The optimal range for alumina materials with a large range of pore widths (4.0–10.5 nm), high surface areas (up to 467 m2 g−1) and significant pore volumes (up to 0.74 cm3 g−1) was found to be within the range of 1.2 and 3.0 moles of nitric acid per mole of metal. For well ordered, thermally stable titania-alumina samples the range over which nitric acid concentration produces high surface area (431 m2 g−1), large pore volume (0.79 cm3 g−1) and significant pore widths (up to 15.5 nm) is 1.2 to 3.0 moles of nitric acid to metal. The effect of acid concentration on the pore width is likely due to the combination of a salt-like effect from the increased concentration of H+ and NO3− ions, the effect of increased water concentration in the synthesis mixture and the direct relationship between the metal alkoxide hydrolysis rate and acid concentration.
Introduction
Aluminum oxides are largely studied because of their catalytic,1–3 optical,4 electronic5 and biomedical6,7 properties and as a result their usefulness in numerous applications. Porous aluminum oxides have been synthesized by high temperature dehydration of bulk powders,4 aerosol generation of particles with the use of block copolymers,8 modified sol–gel in the presence of organic structural agents,9,10 cationic3,11,12 and anionic surfactants,13 block copolymers,14–16 by using ordered mesoporous carbon templates,17 colloidal precursors with amine structural agents18 and through evaporation induced self assembly (EISA) with block copolymers.19,20 Meso- and macroporous γ-Al2O3 was obtained under microwave irradiation in the presence of surfactants under acidic conditions21 and through conventional synthesis using polystyrene microspheres and surfactant or non-ionic templates.22–25 Another synthesis strategy, albeit one that is time consuming and may result in partial or complete loss of mesostructural ordering during the numerous cycles, involves the use of ordered mesoporous carbons as hard templates for the synthesis of mesoporous γ-alumina.17 This strategy is considered as an important achievement because it initiated interest in the development of alumina materials with ordered and uniform mesopores.Since the synthesis of ordered mesoporous silica involving non-ionic poly(ethylene oxide)-poly(propylene oxide)-poly(ethylene oxide) block copolymers [(EO)x(PO)y(EO)x] as soft templates, there have been numerous attempts and great interest in extending this strategy for the preparation of well-defined ordered mesoporous aluminas (OMAs) with high surface area and pore volumes.1,2,26 The aforementioned polymeric templates are attractive because they are inexpensive, commercially available, biodegradable and afford materials with relatively large and uniform mesopores. Early attempts to generate alumina thin films using block copolymers and evaporation induced self-assembly resulted in amorphous14 or disordered mesoporous materials with broad pore size distributions.15 Another strategy employing triblock copolymers as soft templates afforded 3-dimensional (3D) mesoporous structures with disk shaped pores in the presence of an ammonium hydroxide buffer.20 Sol–gel methods, which employed diblock and triblock copolymers under basic conditions, afforded mesoporous aluminas with wormhole-like structures.16
The first successful synthesis of OMA in the presence of block copolymers as soft template was reported by Niesz et al.;15 however, this procedure required a strict control of experimental conditions. A significant step towards preparation of γ-Al2O3 with ordered mesopores has been achieved by self-assembly of the (EO)20(PO)70(EO)20 triblock copolymer and alumina precursors (aluminum isopropoxide or aluminum salts) in ethanolic solution in the presence of additives such as citric or nitric acid.19 This route has been found to be reproducible and avoids the need for controlling hydrolysis conditions, such as the amount of water and humidity. Methods which have built upon this initial breakthrough include the use of aluminum nitrate and aluminum chloride salts as the metal precursors to synthesize well ordered mesoporous alumina, which is bimodal in the case of aluminum chloride,27 the use of phthalic acid to prevent coordination of chlorine around aluminum atoms in the synthesis mixture,28 the use of aluminum nitrate as the aluminum precursor and citric acid resulting in a bimodal distribution of macro/mesoporous alumina,29 and the synthesis of mesoporous crystalline γ-alumina by utilizing boehmite as the alumina precursor.30
The structural characteristics of mixed metal oxide materials can differ greatly from that of the pure oxides. The chemical composition of these oxides has a pronounced effect on their structural, electronic and surface properties31 and there have been numerous attempts to obtain well-defined mixed metal oxides with tailorable surface properties.1,2,32 Among metal oxides, alumina (Al2O3) and titania (TiO2) are very popular because of their unique properties and diverse applications. Titania is a chemically stable, non-toxic and environmentally friendly oxide,33 with extensive applications in catalysis and photocatalysis.33,34 Alumina and titania have been used interchangeably for many applications and each has individual drawbacks. Alumina suffers from a decrease in activity and titania tends to have lower surface area and reduced thermal stability.34–36 Therefore, the study of a mixture of these oxides can be interesting for use in catalysis and a thorough study of their properties is useful when trying to create tailorable materials useful for a broad range of applications.
There remains a great deal that is not understood in the synthesis of OMAs and the ability to tailor such materials is important for all applications. Herein, we demonstrate the ability of tailoring the pore size of aluminum oxide by adjusting the acid concentration in the synthesis mixture. This approach has been extended to titanium-aluminum oxides to show its generality and to gain a better understanding of the role of acid in the one-pot synthesis of non-ionic block copolymer-templated alumina and alumina-based metal oxides.
Synthesis, characterization and calculations
Materials were synthesized using a procedure similar to that reported previously.19,37,38 In a typical synthesis, 1.0g of BASF, Co. Pluronic P123 triblock copolymer ((EO)20(PO)70(EO)20) was dissolved in 10 mL of 95.5+% anhydrous ethanol (Acros Organics) and stirred for 4 h. 0.01 mol of aluminum isopropoxide (Acros Organics) was then added to the solution, followed by various amounts (0.006 to 0.048 moles, depending on the desired acid/aluminum ratio) of 68–70% nitric acid in water (Acros Organics). The aforementioned ratio was obtained by dividing the number of moles of acid added by the number of moles of aluminum to give the number of moles of acid per one mole of aluminum. For example, when 1.6 mL of nitric acid (0.024 moles) was added to the solution with 0.01 moles of aluminum isopropoxide, this sample is denoted as having 2.4 moles of nitric acid per mole of aluminum. Acid addition was followed by an additional 10mL of anhydrous ethanol. The solution was allowed to stir for 5 h and then solvent evaporation occurred at 60 °C for 48 h. The as-made materials were calcined in a horizontal quartz tube furnace in flowing air with a heating rate of 1 °C min−1 and held at 400, 700 or 900 °C for 4 h.Titanium aluminum oxide samples were made by substituting 98+% titanium(IV) isopropoxide (Acros Organics) for a portion (10% or 50%) of the 0.01 moles of aluminum isopropoxide. Additions were made immediately following addition of nitric acid in a drop-wise manner.
The resulting samples were labelled starting with mesoporous alumina (MA), followed by the molar fraction of titanium (xTi), if applicable, then the number of moles of acid per mole of aluminum, or total metal added to the synthesis (y) followed by calcination temperature (C) with 4 representing 400 °C and so on; in the general form MA-xTi-y-C. For instance, MA-10Ti-2.4–7 refers to a mesoporous titanium-aluminum oxide sample with 10% molar fraction of titanium, 2.4 moles of nitric acid per mole of metal (aluminum plus titanium), calcined up to and held at 700 °C for 4 h in flowing air.
Nitrogen adsorption measurements were performed using ASAP 2010 and ASAP 2020 (Micromeritics, Inc.) volumetric analyzers at −196 °C with ultra high purity nitrogen gas. All samples were degassed under vacuum at 200 °C for 2 h prior to measurement.
The small angle X-ray scattering (SAXS) experiments were performed on a Bruker Nanostar U instrument using Cu-Kα radiation (λ = 0.1541 nm) source, which was a rotating anode. Each sample was placed in a hole of an aluminum sample holder and secured on both sides using a Kapton tape.
The wide angle powder X-ray diffraction (XRD) measurements were performed using an X'Pert Pro MPD multipurpose diffractometer (PANalytical, Inc.) with Cu-Kα radiation (λ = 0.1541 nm) at room temperature from 20 to 80°. Measurements were conducted using a voltage of 40 kV, current setting of 40 mA, step size of 0.02° and count time of 4 s. Microscope glass slides were used as supports for all samples.
Samples were imaged using a Hitachi HD-2000 scanning and transmission electron microscope (STEM). Sample preparation was performed by dispersing 5wt% sample in ethanol by moderate sonication, dipping a Lacy carbon-coated, 200-mesh copper grid into the sample suspension and drying under vacuum at 80 °C for 12 h prior to analysis. The unit was operated at an accelerate voltage of 200 kV and an emission current of 30 mA.
Adsorption parameters for the samples were determined from the collected nitrogen adsorption isotherms. The specific surface area (SBET) was calculated using the BET method in the relative pressure range of 0.05–0.2.39 The single point pore volume (Vsp) was calculated from the adsorption isotherm at a relative pressure of 0.98. Pore size distributions (PSDs; dV/dw; where V is the volume of pores and w is the pore width) were calculated from the adsorption branches of nitrogen adsorption-desorption isotherms using the improved KJS method applicable for cylindrical pores.40 The pore width (wKJS) was obtained at the maximum of the PSD curve. The volume of fine pores, mainly micropores, (Vmi) was evaluated by integration of the PSD curve up to ∼3 nm.
Results and discussion
Nitrogen adsorption isotherms for the samples studied are type IV according IUPAC classification.41 Hysteresis is of type H1 for the samples with 1.2 and 2.4 moles of nitric acid per mole of aluminum and type H2 for the samples with 3.0 and more moles of nitric acid per mole of aluminum. This trend continues for samples calcined at 400, 700 and 900 °C, see Fig. 1 and S1, S2 and S3 in the ESI.† Type IV adsorption isotherm with H2 hysteresis loop (showing delayed desorption) is characteristic of mesoporous materials with cage-like pores or pores with constrictions at the pore openings.41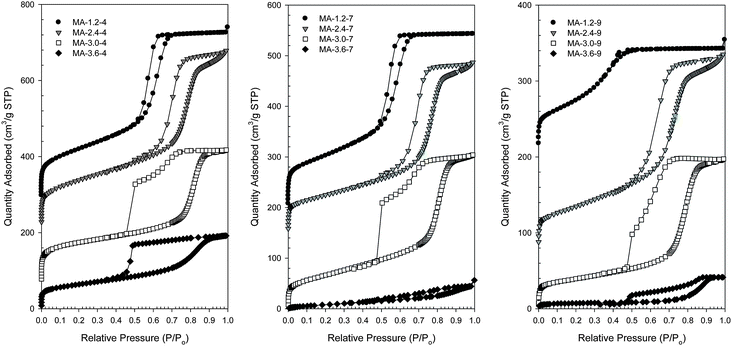 | ||
| Fig. 1 Nitrogen adsorption isotherms for the alumina samples calcined at 400 °C (left), 700 °C (middle) and 900 °C (right) prepared by using 1.2, 2.4, 3.0 and 3.6 moles of nitric acid per every mole of aluminum added to the synthesis mixture. The isotherm curves have been respectively offset by 290, 220 and 70 cm3 g−1 STP (samples calcined at 400 °C), by 200 and 150 cm3 g−1 STP (samples calcined at 700 °C), and by 210 and 80 cm3 g−1 STP (samples calcined at 900 °C). | ||
The entire series of the alumina samples (0.6, 1.2, 1.8, 2.4, 3.0, 3.2, 3.6 and 4.8 moles of nitric acid) is displayed in Fig. S1–S6, ESI.†Table 1 lists the adsorption and structural properties for the alumina samples studied, indicating their large surface areas and pore volumes, which decrease as the calcination temperature is increased. The small pore sample (5.0 nm) synthesized with 0.6 moles of acid has a surface area of 583 m2 g−1. The surface area then decreases as the concentration of acid increases to 1.8 moles of acid then increases at 2.4 moles of acid and then continues to decrease. Pore volumes increase for the samples obtained with 0.6 moles of acid to 1.8 and then generally decrease for the remaining samples. These deviations from linear are most likely due to the complex interactions occurring as the concentration of acid is changed in the synthesis mixture and are displayed in more detail in Fig. S7–S8, ESI.†
| Sample | SBET (m2 g−1) | Vsp (cm3 g−1) | Vmi (cm3 g−1) | wKJS (nm) |
|---|---|---|---|---|
| a SBET – BET specific surface area obtained from the adsorption data in the P/Po range from 0.05 to 0.2; Vsp – single-point pore volume calculated from adsorption isotherm at P/Po = 0.98; Vmi – complementary pore volume calculated by integration of the PSD curve up to ∼3nm; wKJS – pore width calculated at the maximum of PSD. b PSDs are broad and these values reflect an approximate mesopore maximum. | ||||
| MA-0.6-4 | 583 | 0.60 | 0.02 | 5.0 |
| MA-0.6-7 | 460 | 0.47 | 0.01 | 4.6 |
| MA-0.6-9 | 209 | 0.16 | 0.01 | 3.7 |
| MA-1.2-4 | 467 | 0.67 | 0.00 | 6.3 |
| MA-1.2-7 | 367 | 0.53 | 0.02 | 6.1 |
| MA-1.2-9 | 235 | 0.20 | 0.01 | 4.0 |
| MA-1.8-4 | 395 | 0.74 | 0.00 | 8.0 |
| MA-1.8-7 | 344 | 0.65 | 0.01 | 6.9 |
| MA-1.8-9 | 257 | 0.46 | 0.01 | 6.0 |
| MA-2.4-4 | 427 | 0.70 | 0.02 | 9.4 |
| MA-2.4-7 | 266 | 0.51 | 0.02 | 9.1 |
| MA-2.4-9 | 197 | 0.39 | 0.01 | 7.9 |
| MA-3.0-4 | 367 | 0.53 | 0.05 | 10.5 |
| MA-3.0-7 | 240 | 0.47 | 0.01 | 9.9 |
| MA-3.0-9 | 139 | 0.30 | 0.01 | 9.6 |
| MA-3.2-4 | 361 | 0.56 | 0.03 | 10.8 |
| MA-3.2-7 | 72 | 0.15 | 0.00 | 9.6 |
| MA-3.2-9 | 58 | 0.12 | 0.00 | 9.0 |
| MA-3.6-4 | 227 | 0.30 | 0.01 | 10.2b |
| MA-3.6-7 | 35 | 0.07 | 0.00 | 11.9b |
| MA-3.6-9 | 26 | 0.06 | 0.00 | 12.4b |
| MA-4.8-4 | 223 | 0.22 | 0.05 | 10.4b |
| MA-4.8-7 | 45 | 0.09 | 0.01 | 10.6b |
| MA-4.8-9 | 26 | 0.06 | 0.00 | 12.8b |
The alumina materials synthesized display thermal stability up to at least 900 °C. This is especially apparent in samples with nitric acid concentrations in the middle of the series (1.8, 2.4 and 3.0 moles nitric acid) which retain high surface areas, large pore widths and pore volumes even as they are calcined at 900 °C, see Table 1 and Fig. S1, S3 and S5, ESI.† For example, MA-2.4 has surface areas of 427, 266 and 197 m2 g−1, pore volumes of 0.70, 0.51 and 0.39 cm3 g−1 and pore widths of 9.4, 9.1 and 7.9 nm as the calcination temperature is raised from 400 to 700 and then to 900 °C.
Alumina samples, which are calcined at 400 °C, are fully amorphous. When the calcination temperature is raised to 700 °C, materials begin to display some peaks in the wide angle XRD pattern but are not fully crystalline. At 900 °C, the material begins crystallizing and the alumina phase present is γ-alumina, see Fig. S9, ESI.†
Many of the samples studied show uniform and ordered mesopores. Uniformity is reflected by nearly vertical capillary condensation steps, which is observed for the samples prepared with nitric acid concentrations up to and including 3.2 moles of this acid, and by the PSD curves (Fig. 2 and S2, S4 and S6 in ESI†). Samples prepared under more acidic conditions do not exhibit such distinct mesopore uniformity, which is reflected by broad PSD curves.
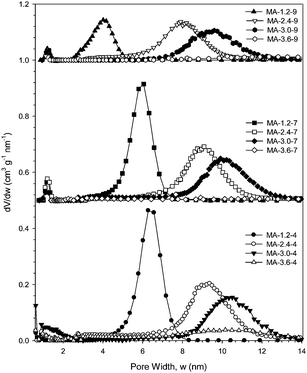 | ||
| Fig. 2 Pore size distributions (PSDs) for alumina samples calcined at 400 °C, 700 °C and 900 °C with 1.2, 2.4, 3.0 and 3.6 moles of nitric acid for every mole of aluminum added to the synthesis mixture. PSDs for 700 °C were offset by 0.5 cm3 g−1 nm and 900 °C by 1.0 cm3 g−1 nm−1. | ||
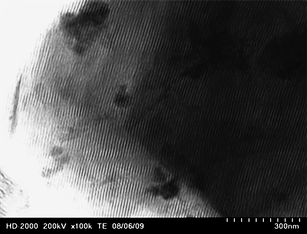
The aforementioned ordered mesoporosity is confirmed by the TEM image of one representative sample (MA-2.4–4; Fig. 3). In addition, further evidence of the mesopore ordering is shown by SAXS profiles recorded for all samples studied (see Fig. 4 and Fig. S10, ESI†). As can be seen from these figures, the SAXS profiles show from 1 to 3 broad peaks. For instance, the SAXS profile of MA-2.4–4 has three peaks, which can be indexed according to p6m symmetry group (unit cell = 12.5 nm). Note that the adsorption isotherm curve for this sample exhibits H1 hysteresis loop, which is observed for cylindrical pores (Fig. 1). In contrast, analysis of the SAXS profile for the next sample, MA-3.0–4, is not provided because the peaks are less resolved; however, these peaks could be equally well analyzed according to Fm3m/Im3m and p6m symmetry groups. Since the adsorption hysteresis loop for this sample resembles H2 type, which is observed for cage-like mesopores, it seems that higher acid concentration promotes the formation of cage-like structures.
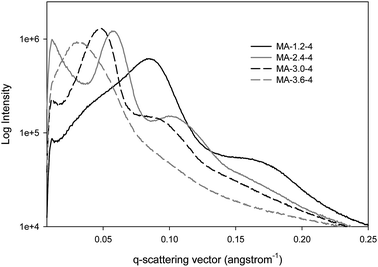 | ||
| Fig. 4 SAXS data for alumina samples calcined at 400 °C with 1.2, 2.4, 3.0 and 3.6 moles of nitric acid for every mole of aluminum added to the synthesis mixture. | ||
As the molar fraction of acid is increased from 1.2 to 3.6 in the synthesis mixture, the capillary condensation steps of the resulting isotherms shift to higher relative pressures. This trend, shown in Fig. 1, is present for the samples calcined at 400, 700 and 900 °C. It is well known that the relative pressure at which capillary condensation occurs is related to the pore width.40,42 As the molar fraction of nitric acid is increased, the pore width increases up to a maximum, at which the pore size distributions do not show distinct peaks and have either bimodal or broad distributions. This increase in the pore width with increasing acid concentration is clearly visible in Fig. 2 showing PSDs and in the graph of the pore width plotted as a function of acid concentration, Fig. 5. This graph shows the almost linear nature of the pore width increase with increasing concentration of acid. The deviation from this linear behaviour occurs after 3.0 moles of nitric acid and is due to the broad pore size distribution in these samples.
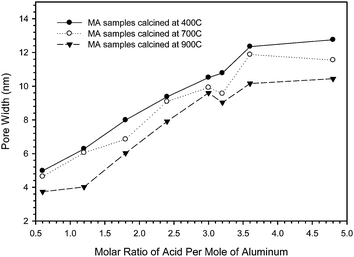 | ||
| Fig. 5 The pore widths plotted as a function of the molar ratio of acid for all samples studied. | ||
The direct relationship between pore width and acid concentration continues not only for the samples calcined at 400 °C but for those calcined at 700 and 900 °C. A maximum is reached for each series and occurs at 3.2 moles of nitric acid for the samples calcined at 400 °C, beyond this point the pore size distributions become broad and/or show a more complex bimodal distribution of pores. For the samples calcined at 700 or 900 °C this maximum occurs earlier at 3.0 moles of nitric acid per mole of metal.
Further evidence of an increase in the pore width with increasing acid concentration is provided by the SAXS data (Fig. 4). Primary peaks shift to smaller values of the q-scattering vector as the acid concentration is increased from 1.2 to 3.6 moles of nitric acid per mole of aluminum. This supports a larger unit cell parameter and a larger pore size at greater acid concentrations.
Recent studies43,44 point out the role of acidic conditions in the polymer-templated synthesis of ordered mesoporous silica and the ability of protons to allow for interactions between the PEO blocks and silica precursors. It is likely that a similar phenomenon is occurring in the synthesis of ordered mesoporous alumina, in which protons interact with the polymer template and the concentration of which affects the micelle size. The study of the effect of nitrates on the formation of Pluronic P123 micelles has shown that in the synthesis of SBA-15 (a hexagonal siliceous material), the increased addition of HNO3 and NaNO3 led to an increase in the Pluronic micelle partially due to the affinity of protons to the EO blocks of the triblock copolymer and to the increase in NO3− at the corona/water interface. At higher acid concentrations, there was a higher capacity for the corona to accommodate an increase in nitrate ions. The authors also observed a transition from the hexagonal to the cubic phase at high salt and acid concentrations.43
Nitric acid acts as a catalyst for the hydrolysis of the aluminum precursor. At low acid concentrations, the dilute ethanol and slow hydrolysis rate control the kinetics of the reaction. As a result, acid concentration has a far reaching effect on the resulting mesostructure formation. In general, it controls the reaction rate in metal alkoxide hydrolysis as reported previously for siliceous45,46 and alumina materials.19
It is clear that as the acid concentration increases in this series of samples, the pore width increases in a nearly linear fashion. This effect is most likely the result of a salt-like effect due to the increased concentration of H+ and NO3− ions in solution, to the increased amount of water associated with increasing amount of 68% nitric acid solution added into the synthesis mixture (swelling of the hydrophilic core) and to the dependence of metal alkoxide hydrolysis on acid concentration.
To show the generality of the acid concentration effect on the properties of similar materials, a series of titanium-aluminum oxide samples with 10 and 50% molar fraction of titanium to aluminum in the synthesis mixture were prepared by varying the acid concentration, Fig. 6 and S11–22 in ESI.† For the MA-10Ti samples, the capillary condensation step shifts to higher relative pressures as the molar acid concentration is increased from 1.2 to 3.0. This trend of pore width increase is clearly shown in the PSD curves provided in ESI.† The sample prepared with 3.2 moles of nitric acid has a broad PSD making the estimation of the mesopore size at the maximum of the PSD difficult. The PSD curves for the samples prepared with smaller acid concentrations show sharp and distinct mesopore peaks, except that for the sample obtained with 1.2 moles of acid, which is broadened and appears to be a bimodal distribution with mesopores of ∼7.0 and 7.8nm. Similar to the pure alumina samples, the pore width increases with increasing acid concentration (up to and including 3.0 moles of nitric acid per mole of metal) for the 10% titanium-aluminum oxide samples.
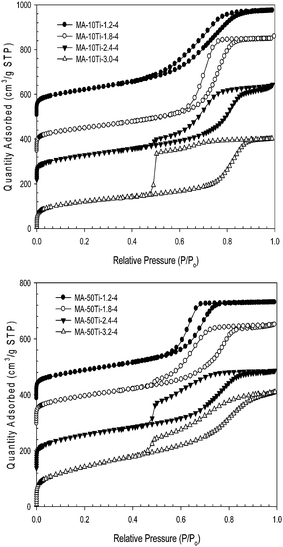 | ||
| Fig. 6 Nitrogen adsorption isotherms for 10 (top) and 50% (bottom) titanium-aluminum oxide samples calcined at 400 °C with various moles of nitric acid for every mole of metal added to the synthesis mixture. Isotherms have been offset for 10% titanium-aluminum oxide by 500, 335 and 210 cm3 g−1 STP, respectively, and for 50% titanium-aluminum oxide by 380, 290 and 130 cm3 g−1 STP, respectively. | ||
The samples prepared with 50% molar fraction of titanium exhibit a rather bimodal-type distribution of pores when calcined at 400 °C and to a lesser degree at 700 °C. The pore volumes are smaller, see Table S1 in ESI,† than those for the samples obtained with 10% titanium. The pore size dependence on acid concentration is not as distinct as compared to both the 10% titanium-aluminum oxide samples and the pure alumina samples. The surface areas are large and the mesopores are very large, most likely due to the phase transitions and re-crystallization of titania at higher calcination temperatures.47,48 For the samples calcined at higher temperatures, the surface area decreased more dramatically than in the case of 10% titanium-aluminum samples. In addition, the 50% titanium-aluminum oxide samples are less thermally stable and have smaller pore volumes. These findings are supported by previous studies of ordered mesoporous titanium-aluminum oxides, which have shown that the titania-alumina composites with higher percentage of titania (33% titanium-aluminum oxide and greater) possess wormhole-like mesostructures instead of the well ordered mesostructures found in pure alumina and 10% titanium-aluminum oxide.38
A unique feature found in these samples is an increase in the pore width from 400 to 900 °C, usually with a slight decrease from 400 to 700 °C. This phenomenon has been documented in other porous titania samples synthesized using non-ionic copolymers and titanium alkoxides due to the transition from amorphous to anatase and/or rutile crystallites.47,48 As the calcination temperature is increased in pure titania materials there is a transformation from a well ordered mesostructure to large wormhole-like crystallites. This pore size increase is seen in the 10% titanium-aluminum oxide materials but there is an insufficient quantity of titania present to make this increase more pronounced. In the 50% titanium-aluminum oxide samples there is an abundance of titanium which has been shown in previous works to form wormhole-like mesostructures.38 Wide angle XRD patterns confirmed the presence of only γ-alumina in the 10% titanium-aluminum oxide samples and both α-alumina and anatase in the 50% titanium-aluminum oxide samples, see Fig. S23 in ESI.† Although the effect of acid concentration on the pore width is still present in the MA-50Ti materials, it is clear that it is much more pronounced for materials with distinct, thermally stable, well ordered mesostructures, which possess large surface area and pore volume.
Conclusions
Ordered mesoporous alumina materials can easily be tailored to suit an individual application's needs by adjusting the acid concentration. The optimal range for alumina materials with varied pore widths (4.0–10.5 nm), high surface areas (up to 467 m2 g−1) and significant pore volumes (up to 0.74 cm3 g−1) was found to be within the range of 1.2 and 3.0 moles of nitric acid per mole of metal. For titanium-aluminum oxide samples with 10% molar fraction of titanium to aluminum, large pore widths (7.2–15.5 nm), high surface areas (up to 431 m2 g−1) and pore volumes (up to 0.73 cm3 g−1) are possible with 1.2 to 3.3 moles of acid per mole of metal. In 50% titanium aluminum oxide, the effect of acid is less obvious for this wormhole-like and less thermally stable material. However larger surface areas (up to 516 m2 g−1) and pore widths (6.6–20.4 nm) are possible at acid to metal ratios of 1.2–3.8. The effect of acid concentration on the pore width is most likely due to a combination of a salt-like effect from the increased concentration of H+ and NO3− ions in solution and their affinity for the ethylene oxide blocks in the triblock copolymer template, the increased water concentration in the synthesis mixture and the direct relationship between the metal alkoxide hydrolysis rate and acid concentration.Acknowledgements
The authors wish to thank Dr M. Mandal from the group of Prof. M. Kruk at College of Staten Island (CUNY) for performing SAXS analysis and Dr Stanisław Pikus of Maria Curie-Skłodowska University in Lublin, Poland for assisting with SAXS analysis. The authors thank BASF Co. for providing the Pluronic® P123 triblock polymer used in this study.Notes and references
- J. Cejka, Appl. Catal., A, 2003, 254, 327 CrossRef CAS.
- C. Marquez-Alvarez, N. Zilkova, J. Perez-Pariente and J. Cejka, Catal. Rev. Sci. Eng., 2008, 50, 222 CAS.
- M. Trueba and S. P. Trasatti, Eur. J. Inorg. Chem., 2005, 17, 3393 CrossRef.
- X.-S. Fang, C.-H. Ye, X.-X. Xu, T. Xie, Y.-C. Wu and L.-D. Zhang, J. Phys.: Condens. Matter, 2004, 16, 4157–4163 CrossRef CAS.
- S. Kurien, J. Mathew, S. Sebastian, S. N. Potty and K. C. George, Mater. Chem. Phys., 2006, 98, 470–476 CrossRef CAS.
- S. E. Kim, J. H. Lim, S. C. Lee, S.-C. Nam, H.-G. Kang and J. Choi, Electrochim. Acta, 2008, 53, 4846–4851 CrossRef CAS.
- S. Iftekar, J. Grins, G. Svensson, J. Loof, T. Jarmar, G. A. Botton, G. C. M. Andrei and H. Engqvist, J. Eur. Ceram. Soc., 2008, 28, 747–756 CrossRef.
- C. Boissiere, L. Nicole, C. Gervais, F. Babonneau, M. Antonietti, H. Amenitsch, C. Sanchez and D. Grosso, Chem. Mater., 2006, 18, 5238–5243 CrossRef CAS.
- R.-H. Zhao, C. P. Li, F. Guo and J.-F. Chen, Ind. Eng. Chem. Res., 2007, 46, 3317–3320 CrossRef CAS.
- T. M. Zima, N. I. Baklanova and N. Z. Lyakhov, Inorg. Mater., 2008, 44, 146–153 CrossRef CAS.
- M. B. Yue, W. Q. Jiao, Y. M. Wang and M. Y He, Microporous Mesoporous Mater., 2010, 132, 226 CrossRef CAS.
- J. Aguando, J. M. Escola and M. C. Castro, Microporous Mesoporous Mater., 2010, 128, 48 CrossRef.
- F. Vaudry, S. Khodabandeh and M. E. Davis, Chem. Mater., 1996, 8, 1451 CrossRef CAS.
- P. Yang, D. Zhao, D. I. Margolese, B. F. Chmelka and G. D. Stucky, Nature, 1998, 396, 152 CrossRef CAS.
- K. Niesz, P. Yang and G. A. Somorjai, Chem. Commun., 2005, 1986 RSC.
- Z. Zhang and T. J. Pinnavaia, J. Am. Chem. Soc., 2002, 124, 12294 CrossRef CAS.
- Q. Liu, A. Wang, X. Wang and T. Zhang, Chem. Mater., 2006, 18, 5153 CrossRef CAS.
- Z. Zhang and T. J. Pinnavaia, Angew. Chem., Int. Ed., 2008, 47, 7501 CrossRef CAS.
- Q. Yuan, A.-X. Yin, C. Luo, L.-D. Sun, Y.-W. Zhang, W.-T. Duan, H.-C. Liu and C.-H. Yan, J. Am. Chem. Soc., 2008, 130, 3465 CrossRef CAS.
- M. Kuemmel, D. Grosso, C. Boissiere, B. Smarsly, T. Brezesinski, P. A. Albouy, H. Amenitsch and C. Sanchez, Angew. Chem., Int. Ed., 2005, 44, 4589 CrossRef CAS.
- T.-Z. Ren, Z.-Y. Yuan and B.-L. Su, Langmuir, 2004, 20, 1531 CrossRef CAS.
- S. W. Bian, Y. L. Zhang, H. L. Li, Y. Yu, Y. L. Song and W. G. Song, Microporous Mesoporous Mater., 2010, 131, 289 CrossRef CAS.
- J. P. Dacquin, J. Dhainaut, D. Duprez, S. Royer, A. F. Lee and K. Wilson, J. Am. Chem. Soc., 2009, 131, 12896 CrossRef CAS.
- N. Suzuki, Y. Sakka and Y. Yamauchi, Sci. Technol. Adv. Mater., 2009, 10, 25002 CrossRef.
- H. N. Li, L. Zhang, H. X. Dai and H. He, Inorg. Chem., 2009, 48, 4421 CrossRef CAS.
- T. J. Pinnavaia, Z. R. Zhang and R. W. Hicks, Stud. Surf. Sci. Catal., 2005, 156, 1 CrossRef CAS.
- W. Q. Cai, J. G. Wu, C. Anand, A. Vinu and M. Jaroniec, Chem. Mater., 2011, 23, 1147 CrossRef CAS.
- F. Huang, Y. Zheng, Y. H. Xiao, Y. Zheng, G. H. Cai and K. M. Wei, Mater. Lett., 2011, 65, 244 CrossRef CAS.
- M. Z. Liu and H. M. Yang, Colloids Surf., A, 2011, 371, 126 CrossRef.
- P. F. Fulvio, R. I. Brosey and M. Jaroniec, ACS Appl. Mater. Interfaces, 2010, 2, 588 CAS.
- J. A. Rodriguez, M. Fernandez-Garcia (ed.), Synthesis, Properties, and Applications of Oxide Nanomaterials; John Wiley & Sons: Hoboken, NJ, 2007 Search PubMed.
- J. Cejka, P. J. Kooyman, L. Vesela, J. Rathousky and A. Zukal, Phys. Chem. Chem. Phys., 2002, 4, 4823 RSC.
- A. S. Deshpande, D. G. Shchukin, E. Ustinovich, M. Antonietti and R. A. Caruso, Adv. Funct. Mater., 2005, 15, 239 CrossRef CAS.
- A. Vargas, J. A. Montoya, C. Maldonado, I. Hernandez-Perez, D. R. Acosta and J. Morales, Microporous Mesoporous Mater., 2004, 74, 1 CrossRef CAS.
- E. Y. Kaneko, S. H. Pulcinelli, V. Teixeira da Silva and C. V. Santilli, Appl. Catal., A, 2007, 235, 71 CrossRef.
- J. Choi, J. Kim, J. S. Yoo and T. G. Lee, Powder Technol., 2008, 181, 83 CrossRef CAS.
- S. M. Morris, P. F. Fulvio and M. Jaroniec, J. Am. Chem. Soc., 2008, 130, 15210 CrossRef CAS.
- S. M. Morris, J. A. Horton and M. Jaroniec, Microporous Mesoporous Mater., 2010, 128, 180 CrossRef CAS.
- M. Kruk and M. Jaroniec, Chem. Mater., 2001, 13, 3169 CrossRef CAS.
- M. Jaroniec and L. Solovyov, Langmuir, 2006, 22, 6757 CrossRef CAS.
- K. S. W. Sing, D. H. Everett, R. A. W. Haul, L. Moscou, R. A. Pierotti, J. Rouquerol and T. Siemieniewska, Pure Appl. Chem., 1985, 57, 603 CrossRef CAS.
- M. Kruk, M. Jaroniec and A. Sayari, Langmuir, 1997, 13, 6267 CrossRef CAS.
- D. Baute and D. Goldfarb, J. Phys. Chem. C, 2007, 111, 10931 CAS.
- A. Caragheorgheopol, A. Rogozea, R. Ganea, M. Florent and D. Goldfarb, J. Phys. Chem. C, 2010, 114, 28 CAS.
- F. Kleitz, S. H. Choi and R. Ryoo, Chem. Commun., 2003, 2136 RSC.
- R. M. Grudzien and M. Jaroniec, Chem. Commun., 2005, 1076 RSC.
- S. Agarwala and G. W. Ho, Mater. Lett., 2009, 63, 1624 CrossRef CAS.
- D. S. Kim and S.-Y. Kwak, Appl. Catal., A, 2007, 323, 110 CrossRef CAS.
Footnote |
| † Electronic supplementary information (ESI) available: 23 figures, nitrogen adsorption isotherms for the complete series of alumina samples calcined at 400 , 700 and 900 °C and the corresponding PSD curves, SAXS data for the alumina studied, wide angle X-ray diffraction patterns for selected alumina samples, figures showing dependence of adsorption parameters on the molar ratio of acid per mole of metal, nitrogen adsorption isotherms and the PSD curves for 10% titanium-aluminum oxide samples with 1.2, 1.8, 2.4, 3.0 and 3.2 moles of acid, nitrogen adsorption isotherms and the PSD curves for 50% titanium-aluminum samples with 1.2, 1.8, 2.4, 3.2 and 3.8 moles of acid, X-ray diffraction data for selected titanium-aluminum oxide samples and one Table with textural parameters for all titanium-aluminum oxide samples. See DOI: 10.1039/c1jm13592a |
| This journal is © The Royal Society of Chemistry 2012 |

