Fragment screening against the thiamine pyrophosphate riboswitchthiM†
Elena
Cressina‡
a,
Liuhong
Chen‡
b,
Chris
Abell
b,
Finian J.
Leeper
b and
Alison G.
Smith
*a
aDepartment of Plant Sciences, University of Cambridge, Downing Street, Cambridge, UK CB2 3EA. E-mail: as25@cam.ac.uk; Fax: (+44) 1223 333953
bUniversity Chemical Laboratory, University of Cambridge, Lensfield Road, Cambridge, UK CB2 1EW
First published on 4th October 2010
Abstract
Riboswitches are regions of mRNA that bind selectively certain metabolites, thereby regulating gene expression. We have developed a method, which uses a combination of biophysical techniques (equilibrium dialysis, waterLOGSY and T2 relaxation-edited NMR spectroscopy and isothermal titration calorimetry) that allows screening and identification of novel ligands for riboswitches. By this method a library of 1300 fragments was screened on the E. colithiamine pyrophosphate (TPP) riboswitchthiM, resulting in the identification of 17 hits. The compounds showed KD values from 22 to 670 μM, with four compounds having KD values <100 μM. The fragments are structurally diverse and their ligand efficiency indicates good prospects for structure-guided elaboration. In addition, a riboswitch functional assay based on in vitrotranscription translation (IVTT) of the reporter gene luciferase was developed. This assay system is an alternative to in vivo assays and constitutes a valuable tool to determine the effect of small molecules on riboswitch-regulated gene expression.
Introduction
The ability of RNA to interact with small molecules is widely recognized,1 as exemplified by the aminoglycosides2 and the oxazolidinone antibiotic linezolid,3 which target ribosomal RNA. In recent years, regulatory regions in messenger RNA, named riboswitches, have been identified.4–11 They adopt well-defined secondary and tertiary structures and bind tightly and selectively to cofactors (thiamine pyrophosphate,4coenzyme B12,5flavin mononucleotide,6S-adenosyl methionine7), amino acids (lysine,8glycine9) and other essential metabolites (glucosamine 6-phosphate,10purines11). Ligand binding to these mRNA regions triggers conformational changes that result in alteration of the expression of the downstream open reading frame, which is often directly involved in the biosynthesis or transport of the ligand.12Riboswitches thus control vital biosynthetic processes and naturally fold to bind small molecules with high affinity and selectivity. This makes them targets for chemical intervention. The potential scope for synthetic riboswitch modulators spans chemical tools to novel therapeutics.13Riboswitches responsive to thiamine pyrophosphate (TPP) (Fig. 1a) are found in virtually all bacterial genomes,14 usually in the 5′-untranslated regions (UTR) of mRNA. They are the only riboswitches known to be present in eukaryotes including fungi,15 algae16 and higher plants.17 The Escherichia coliTPP riboswitchthiM (thiM-RS) is one of the most extensively studied riboswitches from both biochemical and biophysical standpoints. It modulates the expression of the thiMDoperon, encoding two enzymes involved in the thiamine biosynthetic pathway.14 The thiM-RS comprises a 78-nucleotide aptamer domain (Fig. 1b), which is defined by the minimal sequence able to bind the ligand, and a 90-nucleotide expression platform that causes translation attenuation by sequestering the ribosome binding site (RBS) when TPP is bound.18 Although TPP is the preferred ligand (KD = 200 nM), thiM-RS can also bind thiamine monophosphate (TMP) and thiamine (Fig. 1a), with reduced affinity.4,19
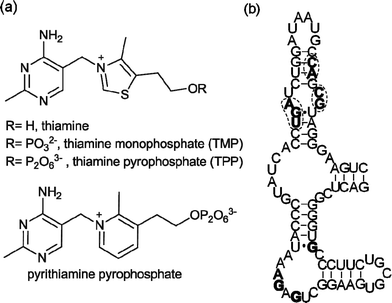 | ||
| Fig. 1 (a) Structures of thiamine, TMP, TPP and pyrithiamine pyrophosphate, all E. coli thiMriboswitch ligands. (b) Primary sequence and secondary structure of the E. coli thiMriboswitch aptamer.4Nucleotides in filled bold type form binding interactions with the pyrimidine moiety of thiamine; circled nucleotides in bold type are involved in pyrophosphate binding.20 | ||
Thiamine analogues such as pyrithiamine, benfotiamine, and amprolium, also bind to the TPP aptamer, with a reported KD for pyrithiamine of 6 μM.4,19 In addition, it has been suggested that the antimicrobial action of pyrithiamine is via its effect on TPP riboswitches.19 The crystal structure of the thiM-RS bound to TPP shows that this RNA acts like a pincer, wrapping the cofactor between two helical arms.20 The aminopyrimidine moiety of TPP makes contact with one helical arm by hydrogen bonding and stacking interactions, while the pyrophosphate binds the other arm through two Mg2+ ions. The thiazole ring appears to make only a minor contribution to binding. The structure of a TPP riboswitch found in the mRNA of the thiCgene in the plant Arabidopsis thaliana reveals a very similar folding motif.21
We are interested in discovering and developing novel ligands for the thiM-RS, which could potentially interfere with the riboswitch mechanism. In order to diverge from thiamine analogues and to obtain structurally diverse binders, a fragment-based approach22 was employed.23
Fragment-based methods22 have proven very successful for the discovery of enzyme inhibitors.24 They rely in part on the concept that screening small molecules (MW ≤ 300 Da, fragments) allows a more effective exploration of chemical space, and therefore increases the probability of finding efficient ligands. As a consequence, it is sufficient to screen libraries of a few hundreds of fragments (in contrast to millions of bigger “lead-like” compounds) to obtain a selection of structurally diverse ligands. Fragment ligands generally display KD values in the lower millimolar to higher micromolar range, but subsequent structure-guided elaboration allows the generation of more potent compounds.24
In contrast to proteins, only a few examples of the application of fragment-based approaches to RNAs of interest are encountered in the literature.23,25,26NMR spectroscopy25 and mass spectrometry26 have been used individually as screening methods. However a combination of different techniques would allow the examination of different aspects of RNA–ligand binding, furnishing a more complete picture of the binding event. We have previously published a communication outlining fragment screening on the TPP riboswitch.23 Here we describe in greater detail our investigation of different biophysical techniques, aimed at developing a general method to screen compounds against riboswitches and the complete results of our screening. From a library of approximately 1300 compounds, we have identified a number of fragment ligands for the thiM-RS, and explored their binding properties. In addition, we describe the development of a riboswitch functional assay, based on in vitrotranscription translation of a reporter gene.
Results and discussion
The use of fragments in the discovery of enzyme inhibitors generally involves four main stages: assembly of a suitable fragment library; screening of the fragments; validation of the hits (by biophysical methods) and elaboration of the fragments into more potent binders (guided by X-ray crystallography or NMR spectroscopic structural studies).24 Our first challenge was to translate this process to an RNA target.Fragment library
Fragment libraries used in drug discovery generally consist of compounds that comply to the ‘rule of three’ (MW ≤ 300 Da, c![[thin space (1/6-em)]](https://www.rsc.org/images/entities/char_2009.gif) logP ≤ 3, no more than three hydrogen bond donors and acceptors)27 and have a variety of shapes and functionalities. Many examples of protein-targeted libraries have been reported,22 however only one instance of a small RNA-directed library has been assembled.25 In this study, we used a library of 1300 structurally and chemically diverse fragments, compiled from various commercial sources. Fragments were ‘rule of three’ compliant, with ≥95% purity and ≥1 mM aqueous solubility.
logP ≤ 3, no more than three hydrogen bond donors and acceptors)27 and have a variety of shapes and functionalities. Many examples of protein-targeted libraries have been reported,22 however only one instance of a small RNA-directed library has been assembled.25 In this study, we used a library of 1300 structurally and chemically diverse fragments, compiled from various commercial sources. Fragments were ‘rule of three’ compliant, with ≥95% purity and ≥1 mM aqueous solubility.
Fluorescence melting assay
Screening fragment libraries on enzyme targets is performed using a range of biophysical techniques.28 The thermal shift (or Thermofluor screen) is a fluorescence-based assay that monitors fragment-induced changes in the protein stability (or protein Tm).29 It is often used as a first screen in a screening cascade for fragments. Sypro Orange, a dye sensitive to its chemical environment, is added to a fragment-protein solution. The solution is then heated until the protein begins to denature. The dye binds preferentially to the partially denatured “molten globule” state of the protein and its fluorescence increases. By measuring the fluorescence emission over a range of temperatures, it is possible to determine the protein Tm. As no equivalent assay in terms of generality and throughput has been reported for RNA, we investigated whether such an approach would be suitable.When thiamine binds to the thiM-RS, the RNA undergoes a conformational change that stabilises its tertiary structure.23 Such stabilisation could be measured by monitoring changes in thiM-RS Tm in the presence of fragments that alter the RNA structure. We attempted to follow ligand-induced changes in Tm by adding a fluorescent dye to thiM-RS-ligand solutions, hoping to achieve a sensitive and high-throughput assay, without requiring covalent labelling of either the nucleic acid or the substrate.30
In preliminary experiments, we screened the fluorescence of seven commercially available DNA and RNA dyes (EvaGreen®, PicoGreen®, Sybr Green I®, LC Green®, Sybr Gold®, acridine orange and proflavin) between 37 and 70 °C, in a solution containing thiM-RS ± TPP. Only in the presence of the dye EvaGreen®,31 did the thiM-RS melting curves show a non-linear shape, as might be expected for a cooperative transition like the melting of an ordered RNA structure. The presence of 50 μM TPP in solution caused a more marked inflection of the melting curve, indicating an effect of the ligand on the overall structure of the RNA (Fig. S1, ESI†). However, it was difficult to determine a Tm from the curve, and experiments conducted with decreasing amounts of TPP did not show a direct correlation of the effect with the ligand concentration. In addition, although the same effect was observed with thiamine and TMP, it was much less marked, despite these molecules being good ligands. For these reasons, we concluded that this method was not adequate to screen our fragment library.
Equilibrium dialysis
Riboswitch RNA has evolved to bind small molecules strongly and selectively. This can be detected by equilibrium dialysis experiments, where riboswitch RNA and the natural radiolabelled ligand ([3H]thiamine in the case of the thiM-RS) are placed in two chambers, separated by a dialysis membrane. The system is left until thermodynamic equilibrium is reached, and then the distribution of the radioligand between the two chambers is measured.4Fragment binding can be evaluated by performing competition experiments, in which the ability of the candidate ligand to affect [3H]thiamine binding (KD = 1.5 μM) is monitored. In our format, fragment(s) and [3H]thiamine were placed in one chamber and RNA in the other. If the fragment disrupted thiamine–RNA interactions significantly, then the concentration of thiamine in each chamber would be very similar or, in the best cases, equal. This is expressed in practice by the ratio of [3H]thiamine present in the RNA-containing chamber and the total amount of [3H]thiamine in the system. This is then converted into the percentage of [3H]thiamine displaced by normalising against a control with no additional ligand (0%) and a control with saturating amounts of TPP (100%).23 The practical choice of using commercially available [3H]thiamine as tracer, rather than radiolabelled TPP, is supported by the consideration that a weaker ligand would be displaced more easily by weak fragment binders, as the assay is more sensitive around the KD of the displaced ligand. This method has several advantages; it discriminates between generic binders and those compounds that disrupt thiamine–RNA interactions; it is quantitative; it does not require large amounts of radioligand (100 nM for 60 μL volume competition experiments) or RNA (10 μM); and it is inexpensive and easy to perform.
To increase throughput, the fragments in our library were screened in cocktails of five (each at a final concentration of 1 mM). Those that displaced ≥30% of the [3H]thiamine were considered as hits and subsequently deconvoluted by testing the individual components separately at 1 mM. Fig. 2 shows the displacement percentage of five representative cocktail hits (C1–C5) and their deconvolution. It is clear that cocktails containing compounds that bind to the RNA can be identified. This method is in principle applicable to any RNA, provided that a radiolabelled ligand is available. In addition, the displacement percentage threshold, above which a fragment is considered a hit, can be evaluated from case to case, in order to select only the most potent compounds.
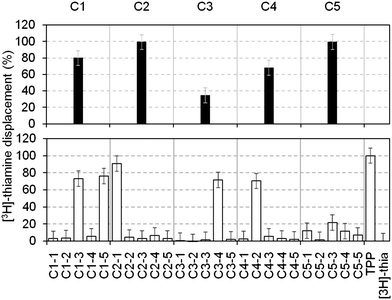 | ||
| Fig. 2 Percentages of thiamine displacement obtained by equilibrium dialysis with five representative cocktails containing five fragments each (top panel, black bars) and following deconvolution of the individual components at 1 mM (bottom panel, open bars). Cocktail 1 (C1, 80%) contained two hits (C1–3 (73%) and C1–5 (76%), subsequently numbered 4 and 3 in Table 1); cocktail 2 (C2, 99%) contained the hit 1 (99%); cocktail 3 (C3, 35%) contained the hit 5 (72%); cocktail 4 (C4, 68%) contained the hit 6 (70%). Cocktail C5 showed 99% displacement but the individual components only gave 12, 1.5, 21, 11 and 7% displacement, respectively. This might be due to synergistic effects of the fragments on the RNA structure. | ||
NMR of riboswitch ligands
In parallel with equilibrium dialysis, we employed two ligand-based NMR techniques, waterLOGSY32 and T2 relaxation-edited spectroscopy33 to detect riboswitch ligands. Both display changes in the ligand 1H signals upon binding to a macromolecule, and are easier to use than methods that monitor changes in the RNA signals, because they do not require the assignment of the RNA peaks, nor large amounts of RNA.WaterLOGSY (Ligand Observed via Gradient SpectroscopY) is based on the magnetization transfer from bulk watervia the RNA–ligand complex to the free ligand.32 As a result, the peaks related to the ligand appear negative in spectra acquired in the absence of the macromolecule, and positive in its presence. We previously showed that this method offers efficient detection of small molecules binding on the riboswitch and that it can be used to validate hits and to screen fragments in cocktails.23
T 2 Relaxation-edited NMR spectroscopy relies on a different physical principle to waterLOGSY, exploiting the different rate of transverse T2 relaxation between free and macromolecule-bound ligand.33 In the absence of binding events, the spectrum appears similar to a standard 1H NMR spectrum, with sharp and well-resolved peaks. However, when a binding macromolecule is present, the peak intensity is reduced, often to the baseline. This method proved as efficient as waterLOGSY in displaying weak small-molecule/RNA interactions both in cocktails and as individuals.
Fragment cocktails for NMR experiments can be designed in order to minimize peak overlap; Fig. 3 shows an example of waterLOGSY (panel A) and T2 relaxation-edited NMR experiments (panel B) for a cocktail of five selected fragments. Two compounds (4 and 20) show positive peaks in the waterLOGSY spectrum and no signal in the T2 relaxation edited spectrum when RNA is present, indicating binding. Two other fragments (18 and 21) display negative peaks in the waterLOGSY and sharp peaks in the T2spectra, showing no binding. The fifth compound, 19, is not visible most likely due to poor solubility.
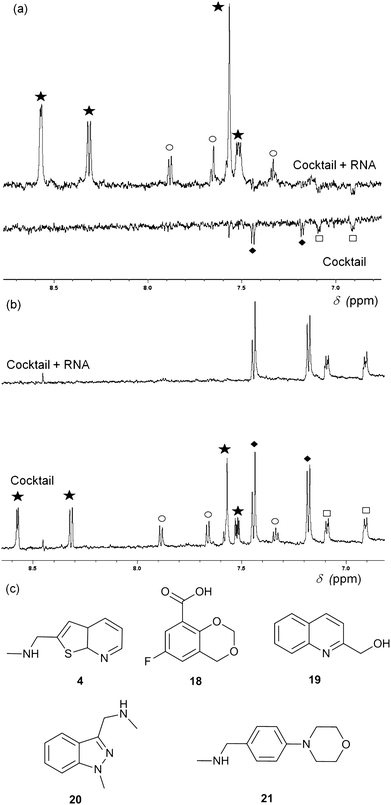 | ||
| Fig. 3 (a) WaterLOGSY NMR spectra of a cocktail of five fragments (0.5 mM each) in the presence (top) and absence (bottom) of 15 μM thiM-RS. The aromatic region of the spectra shows peaks for all fragments, with the exception of 19. Fragments 4 (star) and 20 (circle) show binding while 18 (diamonds) and 21 (square) do not. (b) Representative T2 relaxation edited spectra of a cocktail of five fragments (1 mM each) in the presence (top) and absence (bottom) of 15 μM thiM-RS. Fragments are indicated in the same way as for A. 18 and 21 do not bind while 4 and 20 bind. (c) Structures of the fragments present in the cocktail. | ||
Both waterLOGSY and T2 relaxation-edited NMR can be used independently or in conjunction to screen libraries of fragments on RNA targets and to validate hits.24T2 relaxation-edited NMR has the advantage of requiring fewer scans than waterLOGSY, allowing faster experiments and higher throughput. These NMR methods are very sensitive (detecting weakly binding fragments), however, they do not give any information about the binding affinity of the ligand or its ability to disrupt the riboswitch functionality. For example, compound 20 (Fig. 3) binds to thiM-RS, according to the NMR spectra, but it showed only 5% displacement of thiamine by equilibrium dialysis. Equilibrium dialysis was chosen as our primary screening method, because it addresses this problem.
Isothermal titration calorimetry
Isothermal titration calorimetry is the technique of choice to determine binding affinity of ligands to a macromolecule.34 The method measures the heat developed when a ligand is titrated into a solution of macromolecule, furnishing the thermodynamic parameters of the binding process. By carefully choosing the experimental conditions it is possible to measure the KD of binding. We employed this technique to validate and characterise hits obtained after the equilibrium dialysis and NMR spectroscopic screens. Riboswitch-ligand interactions are often accompanied by RNA structural rearrangements with large associated enthalpies, and so are well suited to being studied by calorimetry.35 However, when the ligand binds weakly (as most fragments do) some challenges may arise in the experimental set up and data analysis. In this case, the titration must be performed with a high RNA concentration (up to 100 μM) and high fragment concentration (>1 mM) to obtain curves with a c-value (defined by KD/M0, where M0 is the initial RNA concentration) near or within the optimal range (1–1000). At very low c-values (< 0.1), the enthalpy of binding ΔH and the stoichiometry n cannot be determined accurately. However the estimated value of KD is unaffected by errors in n, therefore this parameter can be fixed during data analysis, even if the actual stoichiometry of the reaction is not known.36 This is particularly relevant when investigating the binding of weak fragments, which could have multiple binding sites on RNA, allowing the determination of the dissociation constant with good accuracy despite the non-optimal experimental conditions. A representative ITC experiment is shown in Fig. 4a.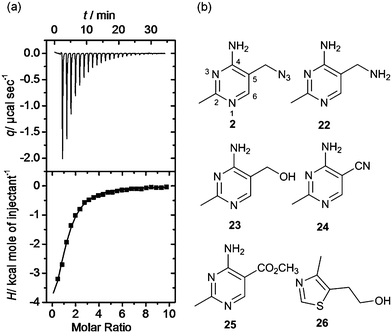 | ||
| Fig. 4 (a) Isothermal titration thermogram obtained by titrating fragment 4 (5 mM) into 100 μM thiM-RS at 25 °C. The enthalpy of binding ΔH was −5.90 kcal mol−1 and the entropy of binding ΔS was −0.53 cal K−1 mol−1. (b) Structures of fragments 2 and 22–26.43 Compound 2 shows the pyrimidine numbering system. | ||
Results of fragment screening
A library of 1300 fragments was screened in cocktails of five by competition equilibrium dialysis against the thiM-RS.23 After deconvolution and retesting, 20 hits were obtained (Table 1 and Table S1, ESI†). WaterLOGSY and T2 relaxation-edited NMR experiments confirmed binding of all 20 compounds (Table S2, ESI†), this equates to a hit rate of approximately 2%.37 The binding affinities of these hits were measured by ITC (Table 1 and Table S3, ESI†). Of these, compounds 1–17 (Table 1) have sufficiently high enthalpy of binding to allow determination of the KD. Three other fragments (ESI†) showed only weak endothermic signals, possibly indicating non-specific entropy-driven binding. These fragments were not considered further.| Hit | Structure | K D/μM | Thiamine displ. (%) | LE | Lys displ. (%) |
|---|---|---|---|---|---|
| 1 |
|
22 ± 2 | 91 | 0.58 | 90 |
| 2 |

|
49 ± 4 | 53 | 0.49 | 0 |
| 3 |
|
56 ± 6 | 76 | 0.53 | 1 |
| 4 |
|
60 ± 5 | 73 | 0.48 | 6 |
| 5 |

|
103 ± 6 | 70 | 0.42 | 9 |
| 6 |
|
202 ± 13 | 71 | 0.39 | 10 |
| 7 |
|
234 ± 23 | 72 | 0.27 | 4 |
| 8 |

|
280 ± 20 | 55 | 0.69 | 0 |
| 9 |

|
280 ± 30 | 35 | 0.48 | 14 |
| 10 |
|
320 ± 40 | 58 | 0.40 | 15 |
| 11 |
|
325 ± 50 | 41 | 0.34 | 9 |
| 12 |

|
330 ± 50 | 27 | 0.43 | 0 |
| 13 |
|
380 ± 30 | 83 | 0.31 | 71 |
| 14 |

|
400 ± 250 | 42 | 0.46 | 3 |
| 15 |

|
500 ± 100 | 63 | 0.26 | 31 |
| 16 |

|
550 ± 40 | 37 | 0.32 | 80 |
| 17 |

|
670 ± 50 | 49 | 0.43 | 0 |
The ligand efficiency (LE, defined as −ΔG/number of heavy atoms) is a parameter used to estimate the effectiveness of a binder in relation to its size.37 The LE of the hits range from 0.69 for 8 to 0.26 for 15. The fragments with higher ligand efficiency are good candidates for further elaboration into larger and more potent ligands.38
All hits were counter-screened by equilibrium dialysis against the structurally different lysine riboswitch, present in the Bacillus subtilis lysC5′ UTR,8 using L-[3H]lysine (KD = 1 μM) as the tracer ligand. Ten hits out of seventeen were found to displace <10% lysine and so they can be considered selective for the thiM-RS (Table 1). This result is encouraging as fragments might have been expected to be more promiscuous ligands.
The seventeen hits are structurally diverse, showing a variety of shapes and functional groups. Some of the fragment hits are structurally related to common nucleic acid binding motifs. The fragments 1, 6 and 15, consisting of fused benzene and pyrimidine or pyrazine rings and an exocyclic amino group, resemble well known intercalators such as acridine orange, proflavin or ethidium.39 This could indicate that they bind by stacking into double stranded regions of the RNA, disrupting its secondary fold, and might also explain why they also bound to the lysC-RS.
The compounds 5, 7, 11, 13 and 16 contain one heteroaromatic ring directly linked to a phenyl ring and are substituted with alkyl amino groups, which are likely to be protonated at physiological pH. This motif has been found in known DNA minor-groove binders such as Hoescht 33285 and in intercalators such as DAPI and diphenylfuran amidines.40,41 The binding in this case is likely to be due a combination of electrostatic interactions and/or partial intercalation.
The compounds 3, 4 and 9 share a common motif consisting of one five-membered sulfur-containing ring fused with a six-membered aromatic ring. This motif is encountered in thiazole orange, a dye able to bind non-specifically to many nucleic acids.42 It is interesting to note that 3, despite not having an amino group that could interact electrostatically with the thiM-RS, is the third most potent compound. Compounds 3 and 4, both with KD < 100 μM, also show very good selectivity towards the thiM-RS.
The fragments 8, 14 and 17 are likely to interact with the RNA structure by hydrogen bonds with exposed bases in bulges and loops. Compounds 14 and 17 contain an aminopyrimidine and a pyrimidinone, respectively, which could bind on the pyridimidine-sensing helix of thiM-RS.20 All three compounds are also selective for thiM-RS.
Compound 10 stands out for being the only fragment with no heteroaromatic ring and for bearing a methyl ester functionality, while 12 presents a very electron-deficient nitropyridine ring.
Interestingly, the azide 2, prepared from thiamine itself,43 shows good potency (KD = 49 μM) and selectivity, indicating that it might be recognised by the pyrimidine binding motif of the thiM-RS. Encouraged by this result, we tested the analogues 22, 23, 24, 25,43 that contain a modified C-5 substituent, to assess its contribution to binding (Fig. 4b). Neither the aminomethyl pyrimidine 22 or the hydroxymethyl pyrimidine 23 (which is a biosynthetic intermediate of thiamine)16 showed any thiamine displacement by equilibrium dialysis or binding by ITC. In contrast, the cyano pyrimidine 24 and methylester pyrimidine 25 had KD of 44 μM and 67 μM, respectively (Table 2 and ESI†) and displaced 80 and 98% of thiamine, respectively, in equilibrium dialysis experiments (Table 2). Assuming that these compounds bind to the pyrimidine pocket of thiM-RS,20 the difference in potency may be due to subtle differences in the electronic features of the aromatic ring. The effect of the C-5 substituents on the ring was evaluated by comparing the 13C NMR chemical shift of C-5 and the 1H NMR of H-6 of the compounds 2, 22–25 with those of thiamine (Table 2).43 In compounds 24 and 25spectra, the H-6 signals is shifted downfield and the C-5 upfield, indicating that the cyano and ester group make the pyrimidine ring more electron-deficient than that of thiamine, by both inductive and resonance effects. The chemical shifts of C-5 and H-6 of compound 2 are very similar to those of thiamine, indicating very similar electronic features of the pyrimidine ring. The spectra of the inactive compounds 22 and 23, show instead downfield shifting of the C-5 signals and to a lesser extent, upfield shifting of the H-6 signals compared to thiamine, indicative of an electron-donating effect on the ring. These observations imply that electron-deficient pyrimidines bind preferably to thiM-RS. This information could be useful for future elaboration/modification of these fragments, in the absence of more conclusive structural data, and for the development of novel compounds that target the pyrimidine binding pocket.
We also tested the thiazole 26 (also a biosynthetic intermediate of thiamine),16 which did not show any thiamine displacement by equilibrium dialysis and no binding by ITC. In contrast, WaterLOGSY spectra showed binding and subsequent partial displacement by TPP (ESI†). The most likely explanation for this behaviour is that 26 binds only very weakly into the thiamine pocket and could be displaced when a stronger ligand (TPP or thiamine) is present. This observation is consistent with the published crystal structure of the thiM-RS bound to thiamine, in which the thiazole moiety has very little interaction with the RNA backbone.20
In vitro transcription translation (IVTT) assays
Having identified a number of thiM-RS-binding fragments by the biophysical screening, it was of interest to assess if any of them was also able to interfere with riboswitch-regulated gene expression. Therefore we set out to develop a riboswitch functional assay. In vivogene expression assays (based on the expression of a reporter protein in live cells) have been previously described for riboswitches,4,19 however, an in vitro reporter assay could be an alternative or a comparison tool when testing small molecules, since problems such as poor membrane permeability, metabolic instability and off-target effects are less likely to be encountered. We investigated a system based on in vitrotranscription translation (IVTT) of the Renilla reniformisluciferase protein.44We created a DNA construct in which the thiM-RS aptamer and expression platform were fused upstream of the Renilla reniformisluciferase geneluc (ESI†).16,44 This plasmid DNA was used as template in IVTT reactions with cell-free E. coli T7/S30 extracts (containing ribosomes, T7 RNA polymerase and all the necessary components for transcription-translation) to generate the luciferase protein; the enzyme activity was then determined by adding the substrate coelenterazine and measuring the light generated upon its conversion into coelenteramide. The luminescence signal was linearly proportional to the amount of IVTT reaction used (Fig. S2, ESI†), demonstrating that the readout reflects the amount of luciferase produced and thereby the translation efficiency. The amount of luciferase produced from an IVTT reaction was then monitored over 2 h (Fig. 5a). When 100 μM TPP was included in the IVTT reaction mix, we observed up to 60% reduction of the luminescence signal. The repression factor (defined as the ratio of luminescence obtained without TPP to that obtained with TPP) was approximately 2.2 after 15 min of incubation and remained constant for a further 1.5 h during IVTT (Fig. 5b). This effect was not observed when a DNA construct without the riboswitch aptamer was used as template for IVTT (Fig. S3, ESI†). This clearly indicates that, in this system, the riboswitch can modulate gene expression.
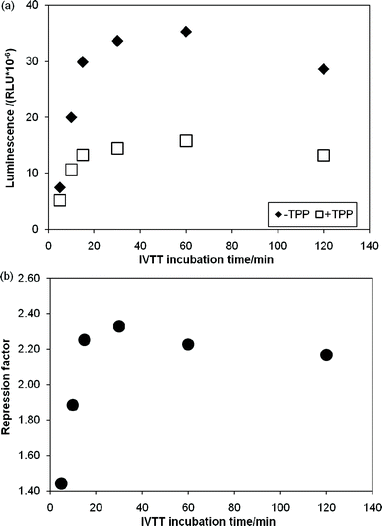 | ||
| Fig. 5 In vitro transcription translation assays of a DNA template containing the Renilla reniformisluciferase under control of the thiM-RS. (a) Time courses of IVTT reactions without TPP (◆) and with 100 μM TPP (□). The relative luminescence units are plotted vs. the IVTT incubation time. (b) Repression factor (defined as the ratio between the luminescence obtained with 100 μM TPP and without TPP) vs. the IVTT incubation time. | ||
Subsequently, the most potent fragments 1–5, and compounds 22–25 were tested using this system, both in the presence or absence of TPP. None of them showed a significant effect on gene expression, in either condition (±TPP) (Fig. S4, ESI†). The most probable explanation for this is that fragments only bind to part of the thiM-RS aptamer TPP binding site and so might not induce the conformational change required for the switching.30 Also, it has been observed that the binding affinity of a molecule for its aptamer tends to decrease when the aptamer is included in a longer RNA strand.4,6 Therefore, our fragments might bind less tightly to the longer transcripts present in the IVTT mix.
Conclusions
We describe here the use of the fragment-based approach to identify novel ligands for a riboswitch target. We have developed an efficient method to discover riboswitch-binding fragments by combining three well established biophysical techniques: equilibrium dialysis, ligand-based NMR spectroscopy, and ITC.23 For the primary screen, we chose competition equilibrium dialysis, where the fragments are selected by their ability to displace the natural riboswitch ligand (thiamine, in the case of thiM-RS). This method is well suited for riboswitches because their natural ligand or variants thereof are often available in radiolabelled form. It also has the advantage of being quantitative, allowing ranking of the fragment hits, and it does not require large amounts of RNA. Ligand-based NMR methods, such as waterLOGSY and T2 relaxation-edited spectroscopy could be used as an alternative primary screen whenever the RNA natural ligand was not available. These techniques are highly sensitive, detecting weakly binding fragments; however, they cannot discriminate between stronger and weaker ligands. On the other hand, NMR is an excellent tool to validate the hits from equilibrium dialysis screening.From a library of 1300 fragments, 17 hits have been identified, with KD values ranging from 22 to 670 μM. The most potent compounds have very high ligand efficiencies and four compounds (1–4, 24, 25) have KD < 100 μM. The fragments are structurally diverse and some show similarity to known nucleic acid ligands. The majority of them are selective for the thiM-RS over the lysC RS. This has positive implications for the possibility of finding artificial RNA ligands that are specific. We believe our hits are excellent candidates for X-ray crystallographic studies; their binding mode is currently being investigated and will provide necessary information to develop these hits further into more potent compounds.
The biophysical methods employed in the screening detect the binding of small molecules to the riboswitch. To complement this information with a functional assay, we also developed a novel IVTT reporter gene assay, which allows determination of whether a small molecule affects riboswitch-regulated gene expression. The use of the luciferase from Renilla reniformis allows for sensitive detection of small amounts of protein, which we believe is important while studying riboswitch-regulated gene expression. Using our system we did not detect complete suppression of luciferase production in the presence of the ligand TPP; this indicates that the extent of riboswitch-regulated gene expression might be affected by factors such as the length and sequence of the whole UTR or the type of RNA polymerase used (T7, in this case). Nonetheless, this assay will be a valuable tool to evaluate the effect of small molecules on riboswitch function, especially for those compounds whose in vivo behaviour is not known.
Experimental
Materials
The fragment library was assembled from various chemical commercial sources and included the Maybridge Ro3 500 Fragment Library. G-[3H]-Thiamine hydrochloride was obtained from American Radiolabelled Chemicals Inc. 4,5-[3H]-L-Lysine was purchased from Perkin Elmer. Coelenterazine was from Nanolight Technologies. All other reagents and buffers were purchased from Sigma-Aldrich, Fisher or Melford. His6-tagged T7 RNA polymerase (RNAP) was expressed and purified according to published procedures.45Urea-PAGE electrophoresis and agarose gel electrophoresis were carried out using standard techniques. All water solutions were treated with 0.1% diethyl pyrocarbonate and autoclaved prior to use. All non-sterile vessels used for RNA handling were treated with RNase-AWAY (Molecular BioProducts) prior to use.RNA preparation
The DNA encoding the thiM-RS was PCR-amplified from E. coli and cloned into pGEM-T easy vector (Promega), using standard molecular biology techniques and the identity was confirmed by sequencing (GeneService). The fragment containing the T7 promoter and thiM-RS aptamer4 was amplified by PCR to obtain the 203 bp template for in vitrotranscription (IVT). The 161 nt RNA containing the 78 nt thiMaptamer used in all the experiments was synthesised by IVT reactions containing 4 × 4 mM NTPs, 50–70 nM DNA template, 0.05–0.01 U/μl inorganic pyrophosphatase (from E. coli, Sigma Aldrich), 10 μg ml−1 T7 RNAP in 40 mM Tris pH 8.0, 20 mM MgCl2, 10 mM DTT, 2 mM spermidine, 0.01% Triton X-100. IVTs were incubated at 37 °C for 3 h, then 0.05 U/μl RQ1 DNase (RNase-free, Promega) was added and the mixture was incubated for a further 15 min. All enzymatic reactions were stopped by the addition of EDTA (50 mM) extracted with 1× volume of citrate buffered phenol pH 4.3 and 1× volume of chloroform–isoamyl alcohol 24:1 and precipitated by addition of 1× volume of isopropanol and 0.1× volume of Na acetate pH 5.0 and cooled at −20 °C. The crude RNA was purified by 6% denaturing urea-PAGE, recovered by the crush/soak method46 in 10 mM phosphate buffer pH 7.0, 1 mM EDTA, concentrated by centrifugation (Vivaspin), precipitated in ethanol and redissolved in water. RNA was quantified by measuring the absorbance at 260 nm (Nanodrop, Thermo Scientific), and stored at − 20 °C.
A 256 nt RNA containing the 176 nt Bacillus subtilislysC RS aptamer8 was prepared following the same procedures.
Fluorescence melting assays
Screening of EvaGreen®, PicoGreen®, Sybr Green I®, LC Green®, Sybr Gold®, acridine orange and proflavin dyes was performed in a Rotor-Gene 600 instrument (Corbett). Solutions contained 0.5 μM thiM-RS, 1× dye in 50 mM Tris pH 7.6, 50 mM NaCl, 2 mM MgCl2 and 50 μM TPP (in positive controls only). Duplicate samples were heated to 90 °C, cooled to 40 °C, then scanned between 40 and 70 °C at 0.1 °C min−1, λex = 460 nm, λem = 510 nm, except for SybrGold® (λex = 530 nm, λem = 550 nm). TPP concentration dependence experiments with EvaGreen® were performed on a LightCycler 480 instrument (Roche). Solutions were prepared in duplicate as previously described, with TPP concentrations from 1 mM to 100 nM. The samples were heated to 90 °C for 2 min, cooled to 37 °C for 15 min, then scanned between 37 and 90 °C, with 70 acquisitions/°C, λex = 483 nm, λem = 533 nm.Competition equilibrium dialysis
Competition equilibrium dialysis experiments were carried out in DispoEquilibrium Dialyzers, 10 kDa MWCO (Harvard Apparatus). Chamber A contained 200 nM [3H]thiamine (500 cpm pmol−1), fragment(s), 10% DMSO in 50 mM Tris pH 7.6, 50 mM NaCl, 5 mM MgCl2, 30 μL total volume. Chamber B contained 10 μM RNA in 50 mM Tris pH 7.6, 50 mM NaCl, 5 mM MgCl2, 30 μL total volume. The no-ligand control contained only DMSO and the TPP control contained 500 μM TPP. Dialyzers were equilibrated overnight at 4 °C, then 20 μL aliquots were taken from each chamber, added to ∼5 mL of Optiphase HiSafe III scintillation cocktail (Perkin Elmer) and counted (Packard Tri-Carb 2100TR). The percentage of thiamine displacement was obtained by first calculating CpmB/(CpmA + CpmB), then by normalising these values for the no-ligand control (0%) and TPP control (100%). The error on the percentages, estimated from the counting error, is approximately 9%. The equilibrium dialysis experiments on Bs LysC RS were conducted following the same procedure, but using 100 nM [3H]-L-lysine (500 cpm pmol−1) and 50 mM Tris pH 7.6, 100 mM KCl, 5 mM MgCl2 as binding buffer. The positive control contained 500 μM L-lysine.NMR spectroscopy
NMR samples contained 15 μM RNA, 750 μM fragment for individual experiments or 5 (samples) × 500 μM for cocktails, 20 μM 3-(trimethylsilyl)propionic acid-d4, in 50 mM Tris pH 7.6, 50 mM NaCl, 5 mM MgCl2, 10% D2O, DMSO-d6 (0.75% fragments, 2.5% cocktails). All NMR spectra were recorded at 278 K (5 °C) with 200 μL samples in 3 mm capillaries on a BRUKER Avance 700 Ultrashield with TXI Cryoprobe. The NMR data were analyzed using TopSPIN NMR software (Bruker).Isothermal titration calorimetry
The RNA was dialysed exhaustively in binding buffer (50 mM Tris pH 7.6, 50 mM NaCl, 5 mM MgCl2) for 18 h at 4 °C. The dialysis buffer was then used to make all subsequent dilutions and to prepare the fragment solutions. All experiments were carried out using a MicroCal ITC200 Microcalorimeter at 25 °C, with the reference power set to 5 μcal s−1, initial delay 60 s and a stirring speed of 1000 rpm. A RNA concentration of approximately 100 μM was used for fragment experiments. Fragment concentrations were 10 or 5 mM for weaker binders and 2.5 mM for stronger binders. Each titration consisted of 25 injections (1 × 0.4 μL followed by 24 × 1.5 μL), spaced 80 s apart. Both titrant and titrate contained 1% DMSO, with the exception of compounds 14, 15 and 17, which had 2, 5 and 5% DMSO, respectively. For each fragment, a control titration of compound in buffer was carried out and the resulting background curve was used to correct the RNA titrations. The data collected from each experiment were fitted with a single-site binding model using Origin ITC software (Microcal Software Inc.), from which values of n, KA, ΔH and ΔS were extrapolated. In the case of some weaker binders, the n value (number of binding sites) was fixed to 1 to fit the data. The dissociation constant KD was obtained by taking the inverse of KA, and the error ΔKD was estimated from the software calculated error ΔKA, using the relationship ΔKD = KD(ΔKA/KA). The ΔG value used to estimate the LE was calculated from the experimental KA.In vitro transcription translation (IVTT) assays
The plasmids used as DNA templates for in vitrotranscription translation (IVTT) were prepared according to standard molecular biology techniques and their identity was confirmed by sequencing (GeneService). IVTT assays were performed using a commercially available kit (Promega, E. coli T7/S30 Extracts for Circular DNA). A typical incubation, prepared according to the manufacturer instructions, contained 7 ng μL−1 of DNA template and 100 μM of compound (excluding negative controls). The IVTT reactions were incubated at 37 °C, cooled on ice, then diluted four-fold with luciferase buffer (50 mM Tris pH 7.6, 5 mM MgCl2, 2 mM DTT, 0.4 mg mL−1 of BSA). The luminescence was followed using a BMG microtitre plate reader (FLUOstar OPTIMA) equipped with a reagent injecting system. 55 μL aliquots of the diluted IVTT mix were placed in a black 96-well microtitre plate and 10 μL of 20 μM coelenterazine solution (in 200 mM HEPES pH 7.0, 1 M NaCl, 2 mM EDTA, 0.4 mg mL−1 BSA, 1% ethanol) were added to each solution after a 20 s read delay and the luminescence increase was monitored every 2 s for 80 s. To obtain the luminescence counts, the light signal was integrated over 80 s after injection.Acknowledgements
This work was supported by the UK Biotechnology and Biological Sciences Research Council. Many thanks to Dr Alessio Ciulli and Dr Karen Bromfield for assistance with NMR spectroscopy experiments and to Dr Kwasi Agyei-Owusu for providing the compounds 23–25.Notes and references
- J. R. Thomas and P. J. Hergenrother, Chem. Rev., 2008, 108, 1171–1224 CrossRef CAS
.
- S. Magnet and J. S. Blanchard, Chem. Rev., 2005, 105, 477–497 CrossRef CAS
- D. N. Wilson, F. Schluenzen, J. M. Harms, A. L. Starosta, S. R. Connell and P. Fucini, Proc. Natl. Acad. Sci. U. S. A., 2008, 105, 13339–13344 CrossRef CAS
- W. C. Winkler, A. Nahvi and R. R. Breaker, Nature, 2002, 419, 952–956 CrossRef CAS
- A. Nahvi, N. Sudarsan, M. S. Ebert, X. Zou, K. L. Brown and R. R. Breaker, Chem. Biol., 2002, 9, 1043–1049 CrossRef CAS
- W. C. Winkler, S. Cohen-Chalamish and R. R. Breaker, Proc. Natl. Acad. Sci. U. S. A., 2002, 99, 15908–15913 CrossRef CAS
- W. C. Winkler, A. Nahvi, N. Sudarsan, J. E. Barrick and R. R. Breaker, Nat. Struct. Biol., 2003, 10, 701–707 CrossRef CAS
- N. Sudarsan, J. K. Wickiser, S. Nakamura, M. S. Ebert and R. R. Breaker, Genes Dev., 2003, 17, 2688–2697 CrossRef CAS
- M. Mandal, M. Lee, J. E. Barrick, Z. Weinberg, G. Mitchell Emilsson, W. L. Ruzzo and R. R. Breaker, Science, 2004, 306, 275–279 CrossRef CAS
- W. C. Winkler, A. Nahvi, A. Roth, J. A. Collins and R. R. Breaker, Nature, 2004, 428, 281–286 CrossRef CAS
- A. Serganov, Y. R. Yuan, O. Pikovskaya, A. Polonskaia, L. Malinina, A. T. Phan, C. Hobartner, R. Micura, R. R. Breaker and D. J. Patel, Chem. Biol., 2004, 11, 1729–1741 CrossRef CAS
- W. C. Winkler and R. R. Breaker, Annu. Rev. Microbiol., 2005, 59, 487–517 CrossRef CAS
- K. F. Blount and R. R. Breaker, Nat. Biotechnol., 2006, 24, 1558–1564 CrossRef CAS
- D. A. Rodionov, A. G. Vitreschak, A. A. Mironov and M. S. Gelfand, J. Biol. Chem., 2002, 277, 48949–48959 CrossRef CAS
- J. E. Barrick and R. R. Breaker, GenomeBiology, 2007, 8, R239 CrossRef
- M. T. Croft, M. Moulin, M. E. Webb and A. G. Smith, Proc. Natl. Acad. Sci. U. S. A., 2007, 104, 20770–20775 CrossRef CAS
- A. Wachter, M. Tunc-Ozdemir, B. C. Grove, P. J. Green, D. K. Shintani and R. R. Breaker, Plant Cell, 2007, 19, 3437–3450 CrossRef CAS
- A. Rentmeister, G. Mayer, N. Kuhn and M. Famulok, Nucleic Acids Res., 2007, 35, 3713–3722 CrossRef CAS
- N. Sudarsan, S. Cohen-Chalamish, S. Nakamura, G. Mitchell Emilsson and R. R. Breaker, Chem. Biol., 2005, 12, 1325–1335 CrossRef CAS
- S. Serganov, A. Polonskaia, A. Phan, R. R. Breaker and D. J. Patel, Nature, 2006, 441, 1167–1171 CrossRef CAS
- S. Thore, M. Leibundgut and N. Ban, Science, 2006, 312, 1208 CrossRef CAS
- M. Congreve, G. Chessari, D. Tisi and A. J. Woodhead, J. Med. Chem., 2008, 51, 3661–3680 CrossRef CAS
- L. Chen, E. Cressina, F. J. Leeper, A. G. Smith and C. Abell, ACS Chem. Biol., 2010, 5, 355–358 CrossRef CAS
- A. Ciulli and C. Abell, Curr. Opin. Biotechnol., 2007, 18, 489–496 CrossRef CAS
- L. Yu, T. K. Oost, J. M. Schkeryantz, J. Yang, D. Janowick and S. W. Fesik, J. Am. Chem. Soc., 2003, 125, 4444–4450 CrossRef CAS
- E. E. Swayze, E. A. Jefferson, K. A. Sannes-Lowery, L. B. Blyn, L. M. Risen, S. Arakawa, S. A. Osgood, S. A. Hofstadler and R. H. Griffey, J. Med. Chem., 2002, 45, 3816–3819 CrossRef CAS
- M. S. Congreve, R. Carr, C. W. Murray and H. Jhoti, Drug Discovery Today, 2003, 8, 876–877 CrossRef
- G. Siegal, E. AB and J. Schultz, Drug Discovery Today, 2007, 12, 1032–1039 CrossRef CAS
- M. C. Lo, A. Aulabaugh, G. X. Jin, R. Cowling, J. Bard, M. Malamas and G. Ellestad, Anal. Biochem., 2004, 332, 153–159 CrossRef CAS
- K. Lang, R. Rieder and R. Micura, Nucleic Acids Res., 2007, 35, 5370–5378 CrossRef CAS
- F. Mao, W.-Y. Leung and X. Xin, BMC Biotechnol., 2007, 7, 76 CrossRef
- C. Dalvit, G. Fogliatto, A. Stewart, M. Veronesi and B. Stockman, J. Biomol. NMR, 2001, 21, 349–359 CrossRef CAS
- P. J. Hajduk, E. T. Olejniczak and S. W. Fesik, J. Am. Chem. Soc., 1997, 119, 12257–12261 CrossRef CAS
- N. N. Salim and A. L. Feig, Methods, 2009, 47, 198–205 CrossRef CAS
- S. D. Gilbert and R. T. Batey, Methods Mol. Biol., 2009, 540, 97–114 CAS
- J. Tellinghuisen, Anal. Biochem., 2008, 373, 395–397 CrossRef CAS
- A. L. Hopkins, C. R. Groom and A. Alex, Drug Discovery Today, 2004, 9, 430–431 CrossRef
- P. J. Hadjuk, J. Med. Chem., 2006, 49, 6972–6976 CrossRef
- E. D. Horowitz and N. V. Hud, J. Am. Chem. Soc., 2006, 128, 15380–15381 CrossRef CAS
- W. D. Wilson, L. Ratmeyer, M. Zhao, L. Strekowski and D. Boykin, Biochemistry, 1993, 32, 4098–4104 CrossRef CAS
- M. L. Zapp, D. W. Young, A. Kumar, R. Singh, D. W. Boykrin, W. Wilson and M. R. Green, Bioorg. Med. Chem., 1997, 5, 1149–1151 CrossRef CAS
- M. Krishnamurthy, N. T. Schirle and P. A. Beal, Bioorg. Med. Chem., 2008, 16, 8914–8921 CrossRef CAS
- K. M. Erixon, C. L. Dabalos and F. J. Leeper, Org. Biomol. Chem., 2008, 6, 3561–3572 RSC
- W. W. Lorenz, R. O. McCann, M. Longiaru and M. J. Cormier, Proc. Natl. Acad. Sci. U. S. A., 1991, 88, 4438–4442 CrossRef CAS
- N. Arnaud, V. Cheynet, G. Oriol, B. Mandrand and F. Mallet, Gene, 1997, 199, 149–156 CrossRef CAS
- C. A. Wakeman and W. C. Winkler, Methods Mol. Biol., 2009, 540, 173–191 CAS
Footnotes |
| † Electronic supplementary information (ESI) available: RNA and DNA constructs used in this work and NMR and ITC data for all the fragments and data from the IVTT experiments. See DOI: 10.1039/c0sc00406e |
| ‡ These authors contributed equally to this work. |
| This journal is © The Royal Society of Chemistry 2011 |