Ordered metal nanostructure self-assembly using metal–organic frameworks as templates†
Benjamin W.
Jacobs
a,
Ronald J. T.
Houk
a,
Mitchell R.
Anstey
a,
Stephen D.
House
b,
Ian M.
Robertson
*c,
A. Alec
Talin
c and
Mark D.
Allendorf
*a
aSandia National Laboratories, Mail Stop 9291, Livermore, CA, USA. E-mail: mdallen@sandia.gov; Fax: +001 925-294-3282; Tel: +001 925-294-2895
bMaterial Science and Engineering University of Illinois, 1304 W. Green St, Urbana, IL, USA
cCenter for Nanoscience and Technology, National Institute of Standards and Technology, 100 Bureau Dr, Gaithersburg, MD, USA
First published on 13th December 2010
Abstract
We demonstrate that nanoporous metal–organic frameworks (MOFs) loaded with silver can serve as templates for ordered nanostructures comprising either silver nanoparticles or nanowires. Exposure to an electron beam breaks down the template, leading to rapid silver coalescence. The geometric and chemical structure of the MOF, as well as the extent of metal loading, determine whether nanoparticles or nanowires are formed and define their size and orientation. Nanowires with diameters as small as 4 nm and aspect ratios >125 can be formed, overcoming the limitations of existing templating methods. This method is relatively simple, compatible with many materials, and proceeds by a distinct template-directed growth mechanism. Since MOFs offer an unprecedented level of synthetic flexibility, combined with highly uniform porosity as a result of their crystalline structure, this approach opens a promising new route for synthesis of self-assembled, ordered nanostructures.
Introduction
The unique, size-dependent properties of metallic nanoparticles and nanowires make these materials attractive for a variety of applications in optics, magnetics, electronics, catalysis and bio/medicine.1Assembly of these materials into two- or three-dimensional nanostructures leads to additional novel properties that stem from collective optical and electronic behavior. These properties, in principle, can be tuned by controlling the areal or spatial arrangement and can depend on the characteristics of the supporting matrix.2,3 Synthesis of component metal nanomaterials with controlled size and aspect ratio is well developed,1–4 but creating ordered assemblies is much more challenging and presents a barrier to further development of devices based on these materials. Current fabrication methods rely either on top-down approaches with limited resolution (e.g., electron-beam or nanoimprint lithography), or involve assembly methods (e.g., fluidic or electric field-driven assembly) that cannot fully overcome local potential energy variations. These obstacles make structural order difficult to control.In contrast, bottom-up self-assembly methods hold the potential for much greater control over both material properties and architecture. A common strategy for forming 2-D or 3-D assemblies of nanostructures is template-directed synthesis.5,6 Soft templates, such as inverse micelles,7 typically have a defined structure that only persists in solution and are easily deformed. Hard templates, on the other hand, such as anodized aluminium oxide,8 mesoporous silica,9 or diblock copolymers,10 maintain their shape in the solid state, and may or may not be removed depending on the desired application. The basic mechanism of template-directed synthesis is the same: growth occurs over a defined area or volume, which we generically refer to as a ‘pore’, that determines the dimensions, spacing, and placement of individual nanostructures. Three principal factors currently limit the effectiveness of templated growth: 1) pore dimensions below 10 nm are difficult to achieve by either top-down or bottom-up methods, 2) the nanoparticle surface is typically covered with ligands or encased in a solid matrix thus limiting applications such as catalysis or sensing, and 3) the resulting spatial arrangement of the pores is essentially limited to close-packed or in some cases square patterns. A simple, yet versatile bottom-up method is needed for next-generation applications that addresses these limitations and is compatible with many different materials to enable flexible, reproducible, and scalable nanostructure fabrication.
Metal organic frameworks (MOFs) are a new class of crystalline, nanoporous material that is attracting considerable interest because of their unprecedented degree of synthetic flexibility. The pore size, shape, and chemistry of MOFs can be precisely tuned, and an extensive library of synthesized structures already exists. MOFs are hybrid materials in which metal ions or clusters are connected by electron-donating “linker” groups to create a networked structure with rigid pores. This porosity creates the potential to introduce non-native functionality to a given structure by infusing the accessible volume with a second material. Both vapor-phase and solution methods developed by Fischer and others have been used to infiltrate MOFs with Pd, Pt, Au, Cu, Fe, ZnO, TiO2, and Ru,11–14 while retaining the MOF crystal structure. Other approaches, including the use of redox-active frameworks to create Ag and Au nanoparticles15 and using the MOF itself as starting material for nanoparticle synthesis,16 have also been demonstrated.
Here, we demonstrate a new concept for creating nanostructures in which MOFs preloaded with silver are exposed to an electron beam to yield not only nanoparticles, but also ordered arrays of nanowires. We recently discovered that infiltrating MOFs with an ethanolic solution of AgNO3 creates very small, sterically and chemically stabilized nanoclusters uniformly distributed within the framework (Ag@MOF).17 Electron paramagnetic resonance (EPR) measurements indicate that Ag3 clusters can form and elemental analysis of the infiltrated MOFs indicates that average cluster sizes range from Ag2 to Ag20. When exposed to a transmission electron microscope (TEM) beam, the MOF quickly breaks down, leading to Ag coalescence and the formation of larger nanoparticles. This suggests that deliberate exposure of Ag@MOFs to an electron beam can be used as a bottom-up self-assembly method to form ordered metal nanostructures. The method described here goes beyond the limits of existing MOF (and other) templating methods by using the MOF chemical structure to determine the resulting nanostructure morphology. Although the formation of silver nanoparticles18,19 and nanowires20,21 using both top-down and bottom-up approaches have been previously described, the generation of ordered arrays of silver nanoparticles and nanowires that are <10 nm in diameter using solution methods or templates remains challenging. In addition, methods such as UV22 and gamma irradiation23,24 used to reduce the silver and create nanoparticles (which are often stabilized by carboxylate groups25,26) lack the potential for extremely high-resolution nanostructure formation afforded by focused electron beams.
In contrast, we find that the rate of template breakdown and subsequent Ag coalescence depend on the crystal structure of the host MOF. Experiments confirming this hypothesis are described here, using the TEM beam as both the initiator of self assembly and as a real-time, in situprobe of the resulting nanostructures. As a result, both the geometry and chemical environment of the pores can be used to determine whether Ag nanowire arrays or nanoparticles with narrow size distributions are formed.
MOF samples
Three different MOFs were selected for this investigation to systematically probe the relationship between pore structure and Ag nanostructure formation (Table S1†): Cu(BTC), MIL-68(In), and MOF-508. Cu(BTC), which has Cu(II) atoms connected to benzenetricarboxylate (BTC) linkers, is expected to yield arrays of Ag nanoparticles due to its primitive cubic structure with enclosed spherical pore cavities connected by smaller pore apertures.27In contrast, the two types of 1-D pores within MIL-68(In) (1.8 nm and 1 nm diameter, respectively) appear to be well suited to the formation of nanowires.28 This MOF is composed of 1-D chains of In atoms connected by 1,4-benzenedicarboxylate (BDC) linkers to form a Kagomé-type lattice. The third structure, MOF-508, has an interpenetrated crystal lattice with five 1-D pores that are also geometrically well suited to nanowire formation. All three MOFs have metal-carboxylate linkages in at least two of the three crystallographic dimensions, creating common pore chemistry. MOF-508 adds an additional dimension, however. In this case, two-dimensional sheets formed by Zn2(OAc)4 paddle-wheel units and BDC linkers in the xz plane are linked to one another by 4,4′-dipyridyl (bipy) ligands.29 This gives MOF-508 reversible structural flexibility, which is characteristic of a number of MOFs. The “open” MOF-508 structure occurs in the presence of solvent, while the “dense” form occurs when the solvent is desorbed from the pores. Based on elemental analysis the Ag loadings we achieved for Ag@MIL-68(In) and Ag@MOF-508 are 3.5 Ag atoms nm−3 and 0.5 Ag atoms nm−3 for Ag@Cu(BTC).
Results and discussion
When Ag@Cu(BTC) is exposed to the TEM electron beam only Ag nanoparticles form. As seen in Fig. 1, Ag particles (confirmed by the fccselected area electron diffraction, SAED, pattern) with an average diameter of 4.3 ± 1.1 nm are observed, while no 1-D nanostructures are seen.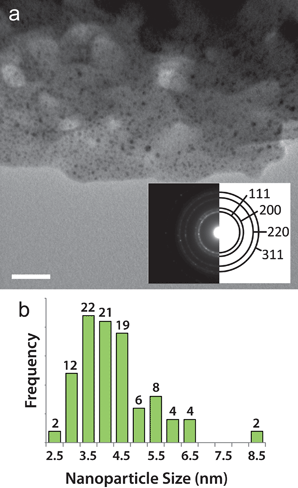 | ||
| Fig. 1 Silver nanostructure formation in Ag@Cu(BTC). (a) TEM image of Cu(BTC) after 1 min exposure to the electron beam. Dark contrast spots indicate Ag nanoparticles. Scale bar is 50 nm. The inset is a diffraction pattern taken over a circular area 1 μm in diameter that was solved for the fcc structure of Ag. (b) Size distribution histogram of the Ag nanoparticles that form after electron beam exposure in Ag@Cu(BTC). | ||
As mentioned above, the Ag loading in Cu(BTC) is low, so there are not many Ag atoms in close proximity to each other that can coalesce. In addition, the lack of constant-diameter 1-D pores and the small apertures between pore cavities are not favorable for Ag diffusion. These factors effectively confine Ag and limit particle growth. The 1-D channels of MIL-68(In) produce nanowires as well as nanoparticles when the Ag-loaded template is exposed to the electron beam. Distinct lines of dark contrast, indicated by the arrows in Fig. 2b, 2e and 2f suggest the presence of nanowires. Although Ag nanoparticles with an average size of 2.9 ± 0.47 (Fig. 2c) are prevalent throughout Ag@MIL-68(In), video obtained as the crystal is exposed to the beam clearly demonstrates the strong directionality imposed by the crystal environment that leads to nanowire formation (video S1†). Fig. 2a and 2b are two frames from the video, which show that the breakdown and subsequent formation of nanoparticles and nanowires occurs within 10 s of beam exposure. Interestingly, however, nanowires can also form at crystalline defects, as seen in Fig. S1† and video S2.†
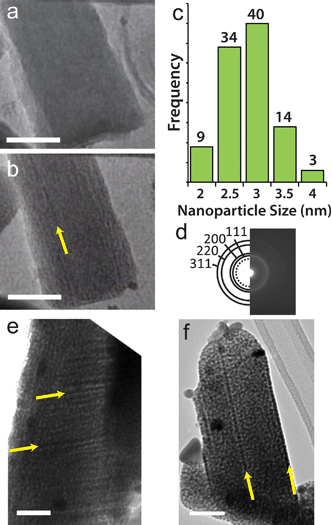 | ||
| Fig. 2 Silver nanostructure formation in Ag@MIL-68(In). (a) TEM image of Ag infiltrated MIL-68(In) after 1 s in the electron beam. (b) TEM image of the same area as in (a) after 10 s in the electron beam. The yellow arrow indicates the location of a Ag nanowire that formed in the framework. (c) Histogram showing the size distribution of Ag nanoparticles that form in Ag@MIL-68(In). (d) Diffraction pattern taken over a circular area 1 μm diameter that was solved for the fcc structure of Ag, and the dotted circle is diffraction from metallic indium. All scale bars are 50 nm. (e–f) TEM image showing Ag nanowires, indicated by yellow arrows, that form in Ag@MIL-68(In). The larger dark contrast spots are coalesced Ag nanoparticles on the surface of the MOF that form during the infiltration process. These images were taken after roughly 1 min in the electron beam. | ||
Highly ordered Ag nanowires readily form when Ag@MOF-508 is exposed to the electron beam. The TEM image in Fig. 3a reveals Ag nanowires oriented along the axes of 1-D pores in MOF-508. These nanowires are ≈4 to 13 nm in diameter and are oriented at 125° relative to each other. Such arrays are found throughout multiple samples and conform to the same geometric orientation (Fig. S2†). Arrows at the bottom of Fig. 3a indicate that parallel nanowires form at approximately 50 nm intervals. A high-resolution TEM (HRTEM) image of an individual nanowire (Fig. 3b) shows that the structure is polycrystalline. Silver nanoparticles with a narrow size distribution (3.9 ± 0.69 nm; Fig. 3c) also form in addition to nanowires and are uniformly distributed throughout the framework.
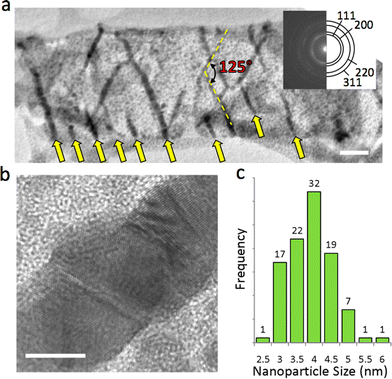 | ||
| Fig. 3 Silver nanostructure formation in Ag@MOF-508. (a) TEM image showing nanowire array that formed in the electron beam. The nanowires are oriented 125° relative to each other. Arrows at the bottom of the figure indicate where parallel nanowires have formed. More nanowires that form in this direction, suggesting that this pore is chemically preferred for nanowire formation. The scale bar is 50 nm. The inset is an electron diffraction pattern taken over a circular area 1 μm in diameter that was solved for the fcc structure of Ag. (b) High resolution TEM image of an Ag nanowire that formed in Ag@MOF-508. The scale bar is 5 nm. (c) Silver nanoparticle size distribution. | ||
We note that the SAED patterns of none of the Ag@MOF indicate the formation of metal oxides (ZnO, CuO, or In2O3). No evidence of metallic zinc is seen in the SAED pattern of Ag@MOF-508 either. However, trace amounts of indium metal are evident in the pattern from Ag@MIL-68(In), Fig. 2d. We cannot directly determine if metallic copper forms when Ag@Cu(BTC) is exposed to the beam because its diffraction pattern overlaps with that of Ag. Instead, we applied scanning TEM (STEM) EDS analysis to probe individual Ag nanoparticles in Ag@Cu(BTC) and in Ag@MIL-68(In) to determine their purity (Fig. S3 and S4†). A trace of Cu is observed in the Ag@Cu(BTC) nanoparticles; however, the amount present is not higher than the background level detected in the surrounding matrix (which contains no identifiable nanoparticles). This signal could also be a spurious result of fluorescence from matrix Cu excited by higher energy Kα photons emitted from Ag. Consequently, we conclude that the silver nanoparticles formed from Ag@Cu(BTC) contain at most a trace of Cu. The picture is more clear in the case of the Ag nanoparticles and nanowires formed from Ag@MIL-68(In), for which no In is detected by EDS.
Bond scission by means of secondary electron generation from the electron beam is the most likely cause of MOF breakdown and Ag coalescence. However, electron beam-induced heating can also damage organic materials, so we used Bethe's formula to estimate the increase in local temperature during nanostructure formation.30 This analysis indicates that the sample temperature increases only ≈10 K above room temperature during the experiment, not enough to damage the MOF (see electronic supplementary information for details†). Alternatively, electron ionization mass spectra of carboxylic acids show that dehydroxylation and decarboxylation are the first and most abundant fragmentation events (Fig. S5†). Fourier transform infrared spectroscopy (FTIR) indicates the infiltrated Ag is located near the metal-carboxylate bonds in each framework (Fig. S6†).17 Thus, nanoparticle destabilization is likely to occur quickly, releasing the small clusters to diffuse and coalesce. The remaining hydrocarbon fragments polymerize, forming carbonaceous material as indicated by Raman spectroscopy (Fig. S7†).
The liquid-phase infiltration process induces no detectable distortion of the CuBTC or MIL-68(In) structures based on powder XRD (PXRD) data (Fig. S8†), indicating that these structures are intact in the infiltrated versions. In contrast, PXRD of Ag@MOF-508 (Fig. S8†) indicates a crystal structure that differs from the starting material. Previous work by Chen et al.29 shows that MOF-508 is a flexible structure that shifts from a “dense” to an “open” form in the presence of dimethylformamide (DMF). This structural change is accompanied by substantial changes in the unit cell volume, but the metal-linker connectivity remains intact. The flexibility of MOF-50831 leads us to conclude that either the Ag(I) ions or the resulting silver nanoparticles that nucleate within the pores induces a structural change that traps them within the framework (extensive solvent exchange does not cause the structure to revert to its pre-infiltrated form). Nevertheless, as will be seen below, the orientation of the silver nanowires formed by electron-beam exposure indicates that Ag@MOF-508 most closely resembles the dense form described by Chen et al.
The morphology of the Ag nanostructures that form in the MOFs can be linked to the surrounding chemical environment within the pores. In MOF-508 there are five distinct 1-D pores large enough to accommodate a Ag atom. Three of these pores (Fig. S9†) are unfavorable for nanowire formation because solvent evacuation transforms MOF-508 into its dense form, rendering these pores discontinuous. These closed pores are likely nucleation sites for the nanoparticles that are observed. The remaining two pore types, oriented along the green (xz pore) and red (x pore) lines in Fig. 4a and 4b, respectively, remain open after solvent evacuation (Fig. S10†) and are the likely hosts for nanowire formation. These two channels intersect at an angle of 128° (Fig. 4c), which closely matches the observed angle between nanowires (Fig. 3a). Although both pores are nearly the same dimension (0.41 × 0.41 nm) and are larger than the van der Waals diameter of a Ag atom (0.34 nm), we expect the μ2-O coordination of Ag enabled by short (0.37 nm) carboxylate-carboxylate distances across the xz pore to be particularly favorable for nanowire formation (Fig. 5). Indeed, TEM images strongly suggest there is a preferred pore for nanowire formation (arrows in Fig. 3a). In contrast, the larger carboxylate separation in the x pore (0.78 nm) should allow predominantly monodentate binding (Fig. 5), both pores have carboxylate spacings large enough to accommodate the Ag3 clusters observed by EPR (0.6 nm along the length of the xz pore and 0.61 nm across the x pore).17
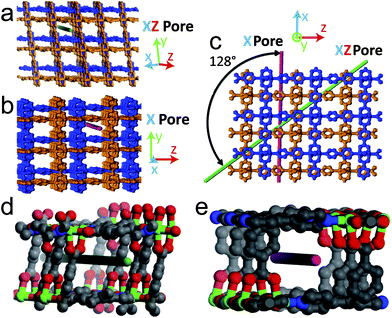 | ||
| Fig. 4 Dependence of Ag nanostructure formation on MOF-508 crystal structure. The interpenetrated sublattices of MOF-508 are distinguished by the blue and orange color. (a) MOF-508 crystal oriented along the xz direction. The green line shows the orientation of a 1-D pore (xz pore) favorable for nanowire formation. (b) MOF-508 crystal oriented 128° relative to (a) along the x direction. The red line shows the orientation of the other 1-D pore (x pore) favorable for nanowire formation. (c) MOF-508 crystal oriented perpendicular to pores in (a) and (b), the angle between pores is 128°. (d) Close up of the xz pore. Gray: carbon; red: oxygen; blue: nitrogen; green: zinc. (e) Close up of the pore from (b). The color coding is the same as in (d). | ||
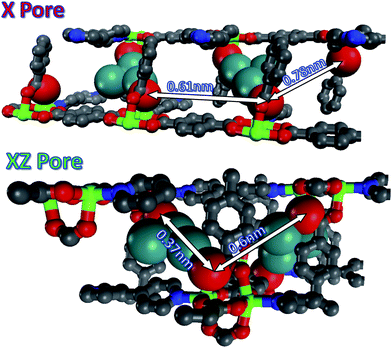 | ||
| Fig. 5 Spacing between accessible SBUs along the x pore and xz pore in MOF-508. Colors scheme; gray: carbon; red: oxygen; blue: nitrogen; green: zinc; teal: silver. The Ag is larger because the van der Waals radii are represented here. They are interacting with oxygen atoms, red, which are also represented by their van der Waals radii. All other atoms are smaller for visualization purposes. In the x pore both silver clusters form monodentate bonds and in the xz pore μ2-O and monodentate bonds form. | ||
The chemical and geometric environment of the pores in MIL-68(In) and Cu(BTC) make it clear why nanowires are less likely to form in these templates. The 1-D pores of MIL-68(In) are much larger than those in MOF-508 and contain many oxygen sites that can stabilize Ag (Fig. 6a). However, the pore walls are defined by the aromatic rings of the carboxylate linkers (Fig. S11†), leaving little space for Ag to diffuse from adjacent pores and leading primarily to nanoparticle formation. This is in stark contrast to MOF-508. The crystal structure of MOF-508 is much more open than MIL-68(In), allowing Ag to readily diffuse in three dimensions. Radial diffusion in Cu(BTC) is similarly inhibited by the enclosed, isotropic pore structure and high number of carboxylate oxygen ions surrounding the pore (Fig. 6b). Thus, Cu(BTC) acts as a zero-dimensional template rather than a 1-D template.
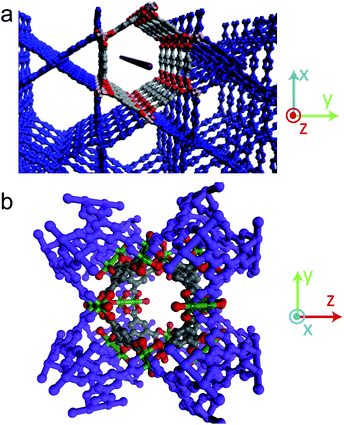 | ||
| Fig. 6 Dependence of MIL-68(In) and Cu(BTC) crystal structure on Ag nanostructure formation, with atoms surrounding the pore highlighted. Gray: carbon; red: oxygen; peach: indium; green: copper. (a) The red line shows the orientation of the 1-D pores in MIL-68(In). The larger of the two pore types is highlighted. (b) Crystal structure of Cu(BTC), in which approximately spherical pores are connected by smaller pore openings. | ||
Two timescales are important in Ag nanostructure formation: the nucleation time and the time available for growth prior to MOF collapse, which effectively freezes the structure. Since the thermodynamic driving force to condensation is very large for Ag, we expect the Ag nanostructure nucleation rate to be determined by the local density of Ag within the pore, which at the relatively low loadings used here is controlled by the local density of stabilizing oxygen atoms. On this basis, the nucleation rates should be similar for the three MOFs, which all have roughly the same number of oxygen atoms (10 oxygen atoms nm−3). Using the mobility reported for Ag atoms in viscous epoxy polymers (3 × 10⁻¹² cm2s−1),32 we estimate that a Ag atom can diffuse 10 nm in ≈80 ms. Our TEM video images suggest the following times are necessary for framework collapse under the electron beam current density used here (10.3 A m−2): Cu(BTC) ≈1 s; MIL-68(In) ≈2 s; and MOF-508 ≈5 s. Thus, Ag has more time to diffuse and coalesce in MOF-508 than in the other two MOFs, leading to larger nanostructures spaced further apart. The reason for the enhanced robustness of MOF-508 relative to the other two may result from the fact that the “dense” form of this structure has both a higher density and a higher number of inter-linker interactions, making the two open channels more stable than they would be in a less dense structure such as Cu(BTC).
Elemental analysis of the infiltrated MOFs provides additional quantitative insight into the dynamics of Ag nanostructure formation in MOF-508. Using the average loading in MOF-508 (3.5 Ag atoms nm−3) and the unit cell volume (1.68 nm3), we calculated that a 10 nm diameter nanowire 50 nm long would require Ag from ≈70,000 neighboring unit cells. Assuming uniform radial Ag diffusion toward the nanowire, this corresponds to diffusion from unit cells up to ≈19 nm away from the nanowire axis. Therefore, the core-to-core nanowire spacing should be ≈38 nm. This agrees reasonably well with the relatively constant 50 nm spacing between nanowires observed in the MOF-508 array. It appears that nanowire formation occurs not only by atom-by-atom growth, but also by nanocluster agglomeration. The HRTEM results (Fig. 3b) show that Ag nanowires are polycrystalline with grain sizes similar to Ag nanoparticles that form (2–5 nm diameter). This implies that nanowire formation is a two step process. In the first step, Ag nanoclusters nucleate and grow to form primary nanoparticles 1 to 5 nm in diameter within 0.1–1 s. In the second step, the primary particles diffuse and coalesce into continuous nanowires. This occurs on a longer time scale, because larger Ag particles are not as mobile as single Ag atoms or small molecular-scale clusters. Based on the video images (Fig. S12 and video S3†), nanoparticles in MOF-508 can diffuse up to 5 nm in just 4 s, which is less than the template lifetime (≈5 s). We estimate the nanoparticle diffusion constant based on these values to be 1.6 × 10⁻¹⁴ cm2s−1, consistent with previous reports.33Nanowire growth in Ag@MIL-68(In) occurs by a similar mechanism in those instances when nanoparticles coalesce before the framework collapses.
Conclusions
In summary, the bottom-up self assembly approach described here produces arrays of Ag nanoparticles or nanowires with dimensions as small as 2 nm and nanowire aspect ratios >125. Morphology can be controlled by judicious choice of the MOF and the extent of metal loading. A major advantage of this method over other templates is that the uniform nanoporosity imposed by the MOF crystal structure enables nanostructure feature sizes ≪10 nm to be produced. Moreover, unlike many other templates, in which size alone determines the properties of the resulting structures, MOFs provide both chemical and steric constraints that can be tailored to achieve specific patterns, sizes and shapes. Although the size of the exposed area in our proof-of-concept experiments was limited by the diameter of the TEM beam, both high-resolution writing and broad-area exposure are possible using currently available instrumentation. Extension of this method to other metals should be straightforward using previously reported infiltration techniques. Demonstrated layer-by-layer MOF surface growth on planar substrates enables infiltration and patterning that can be integrated into devices.34 Finally, fabrication of 3-D architectures is plausible, since epitaxial growth of layered structures composed of MOFs with different pore sizes has been shown.35Acknowledgements
The authors would like to thank Drs Patrick Feng and Raghunandan Bhakta for their technical assistance with various aspects of this project. This work was supported by the Laboratory Directed Research and Development Program at Sandia National Laboratories and at the University of Illinois by the Metal Hydrides Center of Excellence, Office of Energy Efficiency and Renewable Energy, U.S. Department of Energy under grant No. DE-FC36-05GO15064. Sandia is a multiprogram laboratory operated by Sandia Corporation, a Lockheed Martin Company, for the United States Department of Energy's National Nuclear Security Administration under Contract DE-AC04-94AL85000. Certain commercial equipment, instruments, or materials are identified in this paper to foster understanding. Such identification does not imply recommendation or endorsement by the National Institute of Standards and Technology, nor does it imply that the materials or equipment identified are necessarily the best available for the purpose.Notes and references
- C. Burda, X. B. Chen, R. Narayanan and M. A. El-Sayed, Chem. Rev., 2005, 105, 1025–1102 CrossRef CAS.
- G. A. Ozin and A. C. Arsenault, Nanochemistry: a chemical approach to nanomaterials, Royal Society of Chemistry, Cambridge, 2005 Search PubMed.
- H. Y. Fan, K. Yang, D. M. Boye, T. Sigmon, K. J. Malloy, H. F. Xu, G. P. Lopez and C. J. Brinker, Science, 2004, 304, 567–571 CrossRef CAS.
- C. J. Brinker, MRS Bull., 2004, 29, 631–640 CAS.
- Z. S. Zhang, S. Y. Zhang and W. R. Li, Prog. Chem., 2004, 16, 26–34 Search PubMed.
- L. M. Bronstein, Top. Curr. Chem., 2003, 226, 55–89 CAS.
- Q. S. Huo, D. I. Margolese, U. Ciesla, P. Y. Feng, T. E. Gier, P. Sieger, R. Leon, P. M. Petroff, F. Schuth and G. D. Stucky, Nature, 1994, 368, 317–321 CrossRef CAS.
- C. R. Martin, Science, 1994, 266, 1961–1966 CrossRef CAS.
- G. T. Li, S. Bhosale, T. Y. Wang, Y. Zhang, H. S. Zhu and K. H. Fuhrhop, Angew. Chem., Int. Ed., 2003, 42, 3818–3821 CrossRef CAS.
- R. Ruiz, H. M. Kang, F. A. Detcheverry, E. Dobisz, D. S. Kercher, T. R. Albrecht, J. J. de Pablo and P. F. Nealey, Science, 2008, 321, 936–939 CrossRef CAS.
- S. Turner, O. I. Lebedev, F. Schroder, D. Esken, R. A. Fischer and G. Van Tendeloo, Chem. Mater., 2008, 20, 5622–5627 CrossRef CAS.
- M. Muller, X. N. Zhang, Y. M. Wang and R. A. Fischer, Chem. Commun., 2009, 119–121 RSC.
- D. Esken, X. Zhang, O. I. Lebedev, F. Schroder and R. A. Fischer, J. Mater. Chem., 2009, 19, 1314–1319 RSC.
- M. Muller, O. I. Lebedev and R. A. Fischer, J. Mater. Chem., 2008, 18, 5274–5281 RSC.
- H. R. Moon, J. H. Kim and M. P. Suh, Angew. Chem., Int. Ed., 2005, 44, 1261–1265 CrossRef CAS.
- B. W. Jacobs, R. J. T. Houk, B. M. Wong, A. A. Talin and M. D. Allendorf, J. Am. Chem. Soc., 2010 Search PubMed , submitted.
- R. J. T. Houk, B. W. Jacobs, F. El Gabaly, N. N. Chang, A. A. Talln, D. D. Graham, S. D. House, I. M. Robertson and M. D. Allendorf, Nano Lett., 2009, 9, 3413–3418 CrossRef CAS.
- A. Henglein, Chem. Rev., 1989, 89, 1861–1873 CrossRef CAS.
- Y. Xia, Y. J. Xiong, B. Lim and S. E. Skrabalak, Angew. Chem. Int. Edit., 2009, 48, 60–103 CrossRef CAS.
- Y. G. Sun, B. Gates, B. Mayers and Y. N. Xia, Nano Lett., 2002, 2, 165–168 CrossRef CAS.
- G. Sauer, G. Brehm, S. Schneider, K. Nielsch, R. B. Wehrspohn, J. Choi, H. Hofmeister and U. Gosele, J. Appl. Phys., 2002, 91, 3243–3247 CrossRef CAS.
- Y. Lu, Y. Mei, M. Schrinner, M. Ballauff and M. W. Moller, J. Phys. Chem. C, 2007, 111, 7676–7681 CrossRef CAS.
- T. Linnert, P. Mulvaney, A. Henglein and H. Weller, J. Am. Chem. Soc., 1990, 112, 4657–4664 CrossRef CAS.
- H. S. Shin, H. J. Yang, S. B. Kim and M. S. Lee, J. Colloid Interface Sci., 2004, 274, 89–94 CrossRef CAS.
- K. Huber, T. Witte, J. Hollmann and S. Keuker-Baumann, J. Am. Chem. Soc., 2007, 129, 1089–1094 CrossRef CAS.
- B. G. Ershov and A. Henglein, J. Phys. Chem. B, 1998, 102, 10663–10666 CrossRef CAS.
- S. S. Y. Chui, S. M. F. Lo, J. P. H. Charmant, A. G. Orpen and I. D. Williams, Science, 1999, 283, 1148–1150 CrossRef CAS.
- C. Volkringer, M. Meddouri, T. Loiseau, N. Guillou, J. Marrot, G. Ferey, M. Haouas, F. Taulelle, N. Audebrand and M. Latroche, Inorg. Chem., 2008, 47, 11892–11901 CrossRef CAS.
- B. L. Chen, C. D. Liang, J. Yang, D. S. Contreras, Y. L. Clancy, E. B. Lobkovsky, O. M. Yaghi and S. Dai, Angew. Chem., Int. Ed., 2006, 45, 1390–1393 CrossRef CAS.
- T. Zhenyu and H. Yancai, Scanning, 2002, 24, 46–51.
- B. Q. Ma, K. L. Mulfort and J. T. Hupp, Inorg. Chem., 2005, 44, 4912–4914 CrossRef CAS.
- G. A. Gaddy, A. S. Korchev, J. L. McLain, B. L. Slaten, E. S. Steigerwalt and G. Mills, J. Phys. Chem. B, 2004, 108, 14850–14857 CrossRef CAS.
- K. Akamatsu, N. Tsuboi, Y. Hatakenaka and S. Deki, J. Phys. Chem. B, 2000, 104, 10168–10173 CrossRef CAS.
- R. A. Fischer and C. Woll, Angew. Chem., Int. Ed., 2009, 48, 6205–6208 CrossRef CAS.
- S. Furukawa, K. Hirai, K. Nakagawa, Y. Takashima, R. Matsuda, T. Tsuruoka, M. Kondo, R. Haruki, D. Tanaka, H. Sakamoto, S. Shimomura, O. Sakata and S. Kitagawa, Angew. Chem., Int. Ed., 2009, 48, 1766–1770 CrossRef CAS.
Footnote |
| † Electronic supplementary information (ESI) available: Detailed description of experimental and synthesis methods; large table showing the structure of each MOF crystal; Raman spectroscopy; calculations to determine increase in heat due to electron beam interaction with the materials; Mass loss spectrum; Infrared spectroscopy; additional TEM images of the MOFs; additional images of the MOF structure; expanded discussion of the findings. See DOI: 10.1039/c0sc00377h |
| This journal is © The Royal Society of Chemistry 2011 |
