Polyaniline nanofibres for fluorescent nucleic acid detection†
Sen
Liu
a,
Lei
Wang
a,
Yonglan
Luo
a,
Jingqi
Tian
ab,
Hailong
Li
ab and
Xuping
Sun
*a
aState Key Lab of Electroanalytical Chemistry, Changchun Institute of Applied Chemistry, Chinese Academy of Sciences, Changchun, 130022, Jilin, China. E-mail: sunxp@ciac.jl.cn; Fax: (+86) 431-85262065; Tel: (+86) 431-85262065
bGraduate School of the Chinese Academy of Sciences, Beijing, 100039, China
First published on 13th January 2011
Abstract
In this communication, we demonstrate for the first time that conducting polymer polyaniline (PANI) nanofibres can serve as a novel fluorescent sensing platform for nucleic acid detection with a high selectivity down to single-base mismatch.
During the past years, the detection of nucleic acids has drawn much attention due to their various applications in gene expression profiling, clinical disease diagnostics and treatment;1 thus developing rapid, cost-effective, sensitive and specific detection methods for nucleic acid detection is highly desired.2 The increasing availability of nanostructures has created widespread interest in their use in biotechnological systems for diagnostic applications.2 Indeed, numerous nanostructures with various compounds have been successfully developed to detect nucleic acid.3 Recently, homogeneous fluorescence assays based on fluorescence resonance energy transfer (FRET) or quenching mechanisms have been paid considerable attention for nucleic acid detection.4 It is established that the selection issue of a fluorophore–quencher pair is eliminated from the assay if nanostructures are used as a quencher for a fluorophore dye because the same nanostructure is capable of quenching dyes of different emission frequencies.4,5 Up to now, however, there are only a few papers demonstrating the successful application of limited nanostructures including gold nanoparticles, single-walled carbon nanotubes, and graphene in this assay.4–6 More recently, we have found that multi-walled carbon nanotubes, mesoporous carbon microparticles, and carbon nanoparticles can also be used as an effective sensing platform for nucleic acid detection.7 On the other hand, polyaniline (PANI), as one of the most studied conducting polymers, is important in many areas of technology, such as in electromagnetic interference shielding, organic optoelectronic devices, and catalysis etc.8 To the best of our knowledge, the use of PANI as a fluorescent sensing platform for nucleic acid detection has not been explored so far. Herein, we demonstrate a novel application of PANI nanofibres as an effective fluorescent sensing platform for nucleic acid detection with a high selectivity down to single-base mismatch. The nucleic detection is accomplished by the following steps: (1) PANI absorbs and quenches a dye-labeled single-stranded DNA (ssDNA) probe. (2) The subsequent hybridization of the probe with its target produces double-stranded DNA (dsDNA) which detaches from PANI, leading to the recovery of dye fluorescence.
All chemically synthesized oligonucleotides were purchased from Shanghai Sangon Biotechnology Co. Ltd. (Shanghai, China). The DNA concentration was estimated by measuring the absorbance at 260 nm. All the other chemicals were purchased from Aladin Ltd. (Shanghai, China) and used as received without further purification. The water used throughout all experiments was purified through a Millipore system. PANI nanofibres were prepared using a modified oxidative template method (see ESI†).9Scanning electron microscopy (SEM) measurements were made on a XL30 ESEM FEG scanning electron microscope at an accelerating voltage of 20 kV. Fluorescent emission spectra were recorded on a RF-5301PC spectrofluorometer (Shimadzu, Japan). Zeta potential measurements were performed on a Nano-ZS Zetzsozer ZEN3600 (Malvern Instruments Ltd., U.K.). Oligonucleotide sequences are listed below (mismatch underlined):
PHIV (FAM dye-labeled ssDNA):
5′-FAM-AGT CAG TGT GGA AAA TCT CTA GC-3′
T1 (complementary target):
5′-GCT AGA GAT TTT CCA CAC TGA CT-3′
T2 (single-base mismatched target):
5′-GCT AGA GAT T![[G with combining low line]](https://www.rsc.org/images/entities/char_0047_0332.gif) T CCA CAC TGA CT-3′
T CCA CAC TGA CT-3′
T3 (non-complementary target):
5′-TTT TTT TTT TTT TTT TTT TTT TT-3′
Fig. 1 shows the SEM images of the PANI products thus formed. The low magnification image indicates that the products consist of a large number of fibres, as shown in Fig. 1a. A close view of these fibers (Fig. 1b) further reveals that they are nanofibres. We further determined the chemical composition of nanofibres by collecting the corresponding energy-dispersed spectrum (EDS) shown in Fig. S1.† The peaks of C and N elements are observed, indicating these nanofibres are formed from aniline (Fig. S1a†), and the other peaks of O, Na, Mg, Si, In and Ca elements originate from the indium tin oxide (ITO)-coated glass substrate used (Fig. S1b†). All these observations indicate the formation of PANI nanofibres by this modified oxidative template method.9
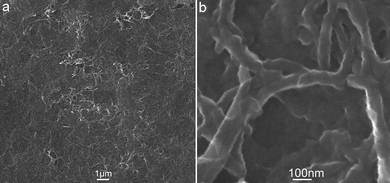 | ||
| Fig. 1 (a) Low and (b) high magnification SEM images of PANI nanofibres thus formed. | ||
We first explored the feasibility of employing PANI nanofibres as a sensing platform for fluorescence-enhanced nucleic acid detection with the use of an oligonucleotide sequence associated with human immunodeficiency virus (HIV) as a model system. Fig. 2 shows the fluorescence emission spectra (excitation at 480 nm) of PHIV, the FAM-labeled probe, at different conditions. It is clearly seen that the fluorescence spectrum of PHIV exhibits strong fluorescence emission due to the presence of the fluorescein-based dye in the absence of PANI (curve a). However, about 92.5% quenching of the fluorescence emission is observed after addition of PANI (curve c), indicating the PANI nanofibres can adsorb ssDNA and subsequently quench the fluorescent dye very effectively. It should be noted that the addition of T1 to PHIV without the presence of PANI has a very small influence on the the fluorescence of the free PHIV (curve b). On the other hand, the PHIV–PANI complex exhibits significant fluorescence enhancement upon its incubation with complementary target T1 over a period of 10 min, as is evidenced by a 94.4% fluorescence recovery (curve d). It is also observed that the PANI sample itself exhibits no fluorescence emission (curve e) and thus makes no contribution to the whole fluorescence intensity of each PANI-involved sample measured. The Fig. 2 inset illustrates the fluorescence intensity changes (F/F0 − 1) of the PHIV–PANI complex upon addition of different concentrations of T1, where F0 and F are FAM fluorescence intensities at 517 nm in the absence and the presence of T1, respectively. In the DNA concentration range of 2.5–1000 nM, a dramatic increase of FAM fluorescence intensity is observed, suggesting that the PANI/DNA assembly approach is effective in probing biomolecular interactions.
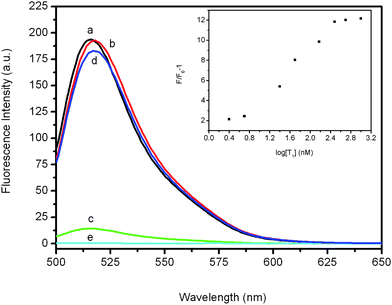 | ||
| Fig. 2 Fluorescence emission spectra of PHIV (50 nM) at different conditions: (a) PHIV; (b) PHIV + 300 nM T1; (c) PHIV + PANI; (d) PHIV + PANI + 300 nM T1. Curve e is the emission spectra of the PANI sample. Inset: fluorescence intensity ratio of PHIV–PANI complex with F/F0 − 1 (where F0 and F are the fluorescence intensity without and with the presence of T1, respectively) plotted against logarithm of the T1 concentration. All measurements were performed in Tris-HCl buffer in the presence of 5 mM Mg2+ (pH: 7.4). Excitation was at 480 nm, and the emission was monitored at 517 nm. | ||
The ζ-potential of the PANI nanofibres was measured to be about 33.8 mV, indicating they have highly positively charged surfaces. Therefore, there should be electrostatic attractive interactions between PANI and negatively charged backbone of ssDNA. Furthermore, there also should be very strong π–π interactions between DNA bases and π-rich conjugated PANI8,10 As a result, ssDNA can adsorb on PANI nanofibres very strongly. In contrast, PANI should have weak binding with dsDNA because there are no π-stacking effects between them in the absence of free nucleobases and nucleosides. The basic idea of the PANI-based nucleic acid detection lies in the facts that single-stranded DNA adsorbs very strongly on PANI while double-stranded DNA does not and PANI effectively quenches dye fluorescence. A schematic illustrating the nucleic acid detection is presented in Scheme 1. The detection is accomplished by the following two steps: (1) PANI binds dye-labeled ssDNA and quenches the fluorescence of the dyevia photoinduced electron transfer from nitrogen atom in PANI to the excited fluorophore11 due to their very close proximity. (2) The subsequent incubation of the ssDNA–PANI complex with the target leads to fluorescence recovery due to the formation of dsDNA which detaches from PANI.
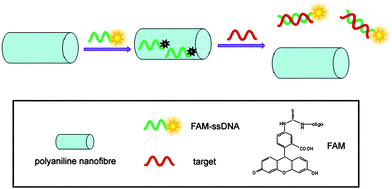 | ||
| Scheme 1 A schematic (not to scale) illustrating fluorescence-enhanced nucleic acid detection using PANI nanofibre as a sensing platform. | ||
It is worthwhile mentioning that the sensing platform described herein can well differentiate perfect complementary and mismatched sequences. Fig. 3 shows the fluorescence responses of the PHIV–PANI complex toward the perfect complementary target T1, the single-base mismatched target T2, and the non-complementary target T3. It is observed that the F/F0 value obtained (where F0 and F are the fluorescence intensity without and with the presence of target, respectively) upon addition of 300 nM of T2 is about 37.1% of the value obtained upon addition of 300 nM of T1 into the PHIV–PANI complex. The addition of T3, however, only leads to a slight change of fluorescence intensity. The Fig. 3 inset shows the corresponding fluorescence intensity histograms with error bars. Such observations indicate that the present system has a high selectivity down to single-base mismatch and the results exhibit good reproducibility.
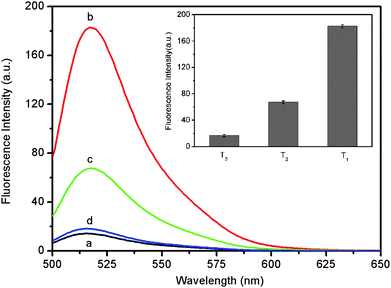 | ||
| Fig. 3 Fluorescence emission spectra of PHIV (50 nM) at different conditions: (a) PHIV–PANI complex; (b) PHIV–PANI complex + 300 nM T1; (c) PHIV–PANI complex + 300 nM T2; (d) PHIV–PANI complex + 300 nM T3. Inset: the corresponding fluorescence intensity histograms. All measurements were performed in Tris-HCl buffer in the presence of 5 mM Mg2+ (pH: 7.4). Excitation was at 480 nm, and the emission was monitored at 517 nm. | ||
To get further insight into the kinetics of the fluorescence quenching and recovery, we collected the time-dependent fluorescence spectra of PHIV and PANI, as well as of the PHIV–PANI complex with T1. Fig. 4a shows the fluorescence quenching of PHIV by PANI as a function of incubation time. In the absence of the target, the curve exhibits a rapid reduction in the first 2 min and reaches equilibrium over a period of 10 min. Fig. 4b shows the fluorescence recovery of PHIV–PANI by T1 as a function of time. In the presence of the target T1, the curve shows a fast increase in the first 1.5 min, and the best fluorescence response is obtained over a period of 10 min. All the above observations indicate that the fluorescence quenching and the subsequent recovery process in our present system takes place much faster than in systems involving carbon nanostructures.5,6g,6h,7
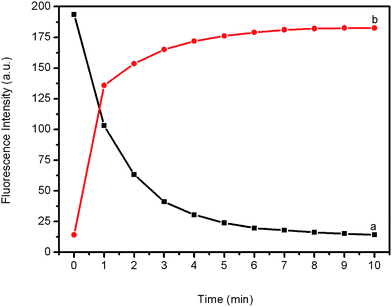 | ||
| Fig. 4 (a) Fluorescence quenching of PHIV (50 nM) by PANI and (b) fluorescence recovery of PHIV–PANI by T1 (300 nM) as a function of incubation time. All measurements were performed in Tris-HCl buffer in the presence of 5 mM Mg2+ (pH: 7.4). Excitation was at 480 nm, and the emission was monitored at 517 nm. | ||
In conclusion, we demonstrate that PANI nanofibres can be used as an effective sensing platform for fluorescence-enhanced nucleic acid detection with a high selectivity down to single-base mismatch for the first time. Our present observations are significant for the following two reasons: (1) it is the first example demonstrating the new application of PANI for nucleic acid detection; (2) this sensing platform is promising for universal and effective fluorescence-enhanced detection sensitive and selective to the target molecule.
Acknowledgements
This work was supported by the National Basic Research Program of China (No. 2011CB935800).Notes and references
- D. Gresham, D. M. Ruderfer, S. C. Pratt, J. Schacherer, M. J. Dunham, D. Botstein and L. Kruglyak, Science, 2006, 311, 1932 CrossRef CAS.
- R. Brayner, Nano Today, 2008, 3, 48 CrossRef.
- N. L. Rosi and C. A. Mirkin, Chem. Rev., 2005, 105, 1547 CrossRef CAS.
- P. C. Ray, G. K. Darbha, A. Ray, J. Walker and W. Hardy, Plasmonics, 2007, 2, 173 CrossRef CAS.
- R. Yang, Z. Tang, J. Yan, H. Kang, Y. Kim, Z. Zhu and W. Tan, Anal. Chem., 2008, 80, 7408 CrossRef CAS.
- (a) B. Dubertret, M. Calame and A. J. Libchaber, Nat. Biotechnol., 2001, 19, 365 CrossRef CAS; (b) D. J. Maxwell, J. R. Taylor and S. Nie, J. Am. Chem. Soc., 2002, 124, 9606 CrossRef CAS; (c) H. Li and L. Rothberg, Anal. Chem., 2004, 76, 5414 CrossRef CAS; (d) S. Song, Z. Liang, J. Zhang, L. Wang, G. Li and C. Fan, Angew. Chem., Int. Ed., 2009, 48, 8670 CrossRef CAS; (e) D. Li, S. Song and C. Fan, Acc. Chem. Res., 2010, 43, 631 CrossRef CAS; (f) R. Yang, J. Jin, Y. Chen, N. Shao, H. Kang, Z. Xiao, Z. Tang, Y. Wu, Z. Zhu and W. Tan, J. Am. Chem. Soc., 2008, 130, 8351 CrossRef CAS; (g) C. Lu, H. Yang, C. Zhu, X. Chen and G. Chen, Angew. Chem., Int. Ed., 2009, 48, 4785 CrossRef CAS; (h) S. He, B. Song, D. Li, C. Zhu, W. Qi, W. Wen, L. Wang, S. Song, H. Fang and C. Fan, Adv. Funct. Mater., 2010, 20, 453 CrossRef.
- (a) H. Li, J. Tian, L. Wang, Y. Zhang and X. Sun, J. Mater. Chem., 2011, 21, 824–828 RSC; (b) S. Liu, H. Li, L. Wang, J. Tian and X. Sun, J. Mater. Chem., 2011, 21, 339–341 RSC; (c) H. Li, Y. Zhang, L. Wang, J. Tian and X. Sun, Chem. Commun., 2011, 47, 961–963 RSC.
- (a) S. Güunes, H. Neugebauer and N. S. Sariciftci, Chem. Rev., 2007, 107, 1324 CrossRef; (b) Q. Pei, G. Yu, C. Zhang, Y. Yang and A. G. Heeger, Science, 1995, 269, 1086 CrossRef CAS.
- Z. Liu, X. Zhang, S. Poyraz, S. P. Surwade and S. K. Manohar, J. Am. Chem. Soc., 2010, 132, 13158 CrossRef CAS.
- N. Varghese, U. Mogera, A. Govindaraj, A. Das, P. K. Maiti, A. K. Sood and C. N. R. Rao, ChemPhysChem, 2009, 10, 206 CrossRef CAS.
- V. Bernard (Ed.) Molecular fluorescence: Principles and applications, 2001, Wiley-VCH Search PubMed.
Footnote |
| † Electronic supplementary information (ESI) available: Experimental details for the preparation of PANI nanofibres and EDS data. See DOI: 10.1039/c0nr00873g |
| This journal is © The Royal Society of Chemistry 2011 |
