A chelating dendritic ligand capped quantum dot: preparation, surface passivation, bioconjugation and specific DNA detection†
Dejian
Zhou
*a,
Yang
Li
b,
Elizabeth A. H.
Hall
c,
Chris
Abell
b and
David
Klenerman
b
aSchool of Chemistry and the Astbury Centre for Structural Molecular Biology, The University of Leeds, Woodhouse Lane, Leeds LS2 9JT, United Kingdom. E-mail: d.zhou@leeds.ac.uk; Fax: +44 (0)113 3436565; Tel: +44 (0)113 3436230
bDepartment of Chemistry, University of Cambridge, Lensfield Road, Cambridge, CB2 1EW, United Kingdom
cDepartment of Chemical Engineering and Biotechnology, University of Cambridge, Tennis Court Road, Cambridge, CB2 1QT, United Kingdom
First published on 3rd November 2010
Abstract
Herein we report the synthesis of a new chelating dendritic ligand (CDL) and its use in the preparation a compact, stable and water-soluble quantum dot (QD), and further development of specific DNA sensor. The CDL, which contains a chelative dihydrolipoic acid moiety for strong QD surface anchoring and four dendritic carboxylic acid groups, provides a stable, compact and entangled hydrophilic coating around the QD that significantly increases the stability of the resulting water-soluble QD. A CDL-capped CdSe/ZnS core/shell QD (CDL-QD) has stronger fluorescence than that capped by a monodendate single-chain thiol, 3-mercapto-propionic acid (MPA-QD). In addition, the fluorescence of the CDL-QD can be enhanced by 2.5-fold by treatments with Zn2+ or S2− ions, presumably due to effective passivation of the surface defects. This level of fluorescence enhancement obtained for the CDL-QD is much greater than that for the MPA-QD. Further, by coupling a short single-stranded DNA target to the QD via the CDL carboxylic acid group, a functional QD-DNA conjugate that can resist non-specific adsorption and hybridize quickly to its complementary DNA probe has been obtained. This functional QD-DNA conjugate is suitable for specific quantification of short, labelled complementary probes at the low DNA probe:QD copy numbers via a QD-sensitised dye fluorescence resonance energy transfer (FRET) response with 500 pM sensitivity on a conventional fluorimeter.
Introduction
Fluorescent semiconductor nanocrystals known as quantum dots (QDs) have been of a focus for research over the past two decades because of their unique, size-dependent, strong and extremely photo-stable fluorescence.1–3 They have been used widely in a range of biological applications, which include imaging, cell tracking, trafficking, biosensing and multiplexed sensors.2–7 In addition, their broad absorption and narrow symmetric emission spectra make them especially attractive for applications in Förster resonance energy transfer (FRET) based sensors.7–28 This is because such spectral characteristics allow the choice of a wide range of excitation wavelengths to reduce the acceptor direct excitation, and also proper narrow bandpass filters for the effective separation of donor–acceptor emissions. This leads to significantly reduced fluorescence background and greatly increased sensitivity.Since the FRET efficiency (E) is strongly dependent on the donor–acceptor distance (r) and decreases dramatically with the increasing r values: E = 1/[1+(r/R0)6], where R0 is the Förster radius of a given donor–acceptor pair under which E = 50%; it is thus critical to reduce the r value in order to achieve high E (sensitivity), i.e. a compact QD-bioconjugate structure is essential to highly-sensitive QD FRET based sensors.7,22 The strict requirement of small r for high sensitivity has posed a significant challenge for QD FRET-based sensors because the QD fluorescent cores are relatively large, e.g. the radii vary from 1.6 to 2.9 nm for 490 to 620 nm emission commercial CdSe/ZnS core/shell QDs (Evidots).29 Further, the fluorescent cores are capped by a layer of stabilising ligands, whose thickness can vary from 0.5 to 20 nm. Thus the overall radius of the QD donor alone is often comparable or even greater than the R0 of most QD-dye FRET systems (e.g. 4–7 nm) even before bioconjugation.7 This has been a major limiting factor for achieving high sensitivity for QD-FRET based sensors, especially at the low target:QD copy numbers. Although a high E can be achieved by increasing the number of acceptors attached to each QD (i.e. by increasing target:QD copy numbers, n, since E = 1/[1+(r6/nR06)] in a single donor-multiple acceptor FRET system),25–27 such systems however, are inefficient for situations of low target:QD copy numbers (e.g. 1![[thin space (1/6-em)]](https://www.rsc.org/images/entities/char_2009.gif) :1) because of the small FRET changes obtainable.
:1) because of the small FRET changes obtainable.
Another essential requirement for QD-FRET based sensors is that the QDs should be stable and soluble in aqueous media because this is where most of the sensing applications are carried out. Although stable, compact, water-soluble core QDs (e.g.CdTe, CdS etc.) can be prepared directly by an aqueous route,30–32 these core-only QDs are very sensitive to their environment, liable to chemical and photo-oxidation and more critically, they can loose their fluorescence significantly on bioconjugation,‡ which together significantly limit their usefulness and robustness as biosensors. In contrast, core/shell (e.g.CdSe/ZnS) QDs, where the fluorescent core is protected by an epitaxially grown, higher band-gap inorganic shell, are more stable and less environmentally sensitive, especially those with really thick shells (e.g. the giant multishell QDs) whose fluorescence has shown to be completely insensitive to the environment.33 These core/shell QDs are better-suited for sensing applications. Although it should be noted that despite a very high stability, the very thick shell QDs are presumably inefficient in FRET based sensing applications because of their big core/shell crystal sizes (e.g. 15–20 nm).33 Most QD-FRET based sensors reported so far have been based on CdSe/ZnS core/shell QDs with moderate shell thicknesses.6–28
Because most high quality CdSe/ZnS core/shell QDs are prepared by a high temperature organometallic route,34,35 they are capped with hydrophobic ligands which make them water-insoluble. Consequently they have to be made water-soluble prior to use for sensing applications. Several strategies have been developed to make these hydrophobic QDs water-soluble, which include wrapping with amphiphilic polymers,36,37 capping with polyethylene glycol (PEG)ylated phospholipid micelles,38 coating with silica shells,39,40 and via ligand-exchange with hydrophilic ligands (e.g. hydrophilic thiols, the most often used ligands in ligand exchange).7–24,41–48 Although QDs capped by amphiphilic polymers or phospholipids (as is the case for most commercial water-soluble QDs) are highly stable and water-soluble, the resulting large hydrodynamic radii (HR) can significantly limit their FRET efficiency (sensitivity), e.g.HRs for the amphiphilic polymer (T1) and phospholipids (T2) capped QDs (Evitags) are ∼20 and 12.5 nm, respectively.29
On the other hand, ligand-exchange with functional thiols is easy and cheap to carry out. Moreover it can provide compact QDs (e.g.HR < 5 nm) that are important for high-sensitivity in QD-FRET based sensors. However, conventional (mono) thiol capped water-soluble QDs often have a relatively low stability (days to weeks, e.g. a cysteine capped core/shell QD is stable for only 24 h at 4 °C in PBS without additional reducing reagent),44 presumably because of the relatively weak binding between the QD and the monodentate thiolate which is prong to dissociation and chemical oxidation.44 Also a significant quantum yield reduction (often > 50%) after the ligand exchange is commonly observed, and the extent of the reduction is variable, depending on experimental conditions such as solvents, pH, temperature, shell thickness and composition,43,44 which can lead to batch-to-batch variations. Capping the QDs with chelate ligands (e.g. those containing two thiolate groups) has been shown to significantly enhance the stability of the resulting water-soluble QDs.45–49 While from the geometric point of view, a dendritic ligand could provide an even better match to the requirement of a dense, entangled hydrophilic coating that can provide enhanced stability of the resulting water-soluble QDs.50
Herein, we combine chelative binding and dendritic surface capping to design and synthesize a new chelating dendritic ligand (CDL, Fig. 1a). Each CDL ligand contains a chelate moiety (a dihydrolipoic acid, DHLA) for strong QD binding, and a dendritic moiety with four carboxylic acids to create a dense, compact hydrophilic coating on the QD surface for water-solubility and high stability. We found that the CDL capped water-soluble CdSe/ZnS core/shell QD (CDL-QD) is more stable and retains more fluorescence than that capped by a monodentate single-chain thiol, e.g.3-mercaptopropionic acid (MPA). Moreover, the fluorescence of the CDL-QD (with a relatively thin ZnS shell) can be enhanced by over 2.5 folds by treatments with Zn2+ or S2− ions, presumably due to the effective passivation of surface defects. Further, by coupling a short single-stranded DNA target to the QD via the CDL carboxylic acid group, the resulting QD-DNA conjugate hybridizes quickly and specifically to its complementary DNA probe, and is suitable for detection of specific DNA probes at low DNA probe:QD copy numbers with sub-nanomolar sensitivity on a conventional fluorimeter.
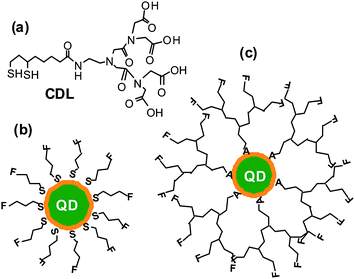 | ||
| Fig. 1 (a) Chemical structure of the chelating dendritic ligand (CDL). Schematics of a core/shell QD capped with conventional monodentate single-chain thiols (b) and with the chelating dendritic ligands (CDL, c). A: chelate group (e.g.dihydrolipoic acid), F: functional group. | ||
Results and discussion
Fig. 1 shows the chemical structure of the CDL ligand and the schematics of a core/shell QD capped by monodentate single-chain thiols and the CDL ligands. Compared to mono-dentate single-chain thiolate ligands, the CDL ligands can provide a strong, dense and entangled hydrophilic coating surround the QD surface that can significantly enhance the stability of the resulting QD and prevent chemical oxidants, e.g. O2, from directly interacting and oxidising the QD core or the thiolate groups.50 Oxidisation of the thiolates to disulfides has been regarded as a major factor for the limited stability of thiolate ligands capped QDs.44Scheme 1 shows the synthetic route to the CDL ethyl ester (CDL-ester). Briefly, bromoacetylbromide reacts with diethyl iminodiacetate gives 1 in 92% yield. The bromoester 1 then reacts with mono Boc-protected ethylenediamine in N,N′-dimethylformaldehyde gives 2 in 78% yield. Deprotection of the Boc group by trifluoroacetic acid gives the amine 3, which is then coupled to D/L-lipoic acid using dicyclohexyl-carbodiimide (DCC)-mediated amide coupling with a catalytic amount of dimethylaminopyridine to give 4 in 73% yield. Finally, the dithiolate ring in 4 is opened by dithiothreitol (DTT) reduction to give the chelating dendritic ligand ethyl ester (CDL-ester) in 50% yield. All compounds have been characterised by 1H and 13C NMR as well as HR-MS to confirm their chemical structures (see experimental section).
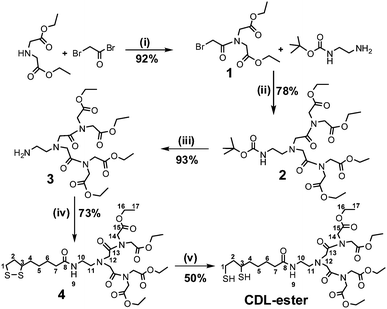 | ||
| Scheme 1 The synthetic route to the chelating dendritic ligand ethyl ester (CDL-ester). The numbers given in compound 4 and CDL-ester show the C and H registries in the NMR data assignment, and the experimental conditions are: (i) EtOAc/0 °C, then reflux 30 min; (ii) K2CO3, DMF, 60 °C, 24 h; (iii) TFA/DCM, RT, 4 h; (iv) DCC/DMAP, DCM, 0 °C, 1.5 h, then RT, 24 h; (v) DTT, aq. K2CO3, H2O/EtOH, RT, 10 min. | ||
Water-soluble QDs (with EM at 540 and 600 nm) capped with the CDL or MPA ligands (CDL- or MPA-QDs) were prepared by ligand exchange of TOPO-capped CdSe/ZnS core/shell QDs with the functional thiols (CDL-ester or MPA) in a mixed CHCl3/EtOH solution following our earlier protocols.21,22 The CDL-ethyl esters on the QD surface cap were then hydrolysed to carboxylic acid groups under reflux in a mixed EtOH/Na2CO3 aqueous solution (1:1 v/v). The absorption spectra of the CDL- and MPA-QDs (540 nm EM) are very similar (ESI,† Fig. S1), with the first exciton peak (∼526 nm) effectively unchanged from the parent TOPO-QD. Fluorescence spectra of the CDL- and MPA-QDs are narrow (full width at half maximum, FWHM ∼30 nm) and symmetric (see ESI,† Fig. S2), showing little difference from the parent TOPO-QDs, suggesting that the emission is from exciton recombination. The CDL-QD emission peak shows a small red-shift (∼3 nm) compared to the MPA-QD, and its intensity is considerably stronger (∼40%) than the later (ESI,† Fig. S2) at identical concentrations. The fluorescence intensities of the MPA- and CDL- QDs (in Tris buffer) are ∼20% and ∼28% that of the parent QD (with native ligands in hexane). This suggests that capping the QD with the CDL ligands leads to a smaller reduction of the QD quantum yield (QY) than that does to the MPA. A significant reduction of QY after ligand exchange is not unusual for CdSe/ZnS core/shell QDs and has been widely reported in the literature. For example, both the Bawendi and Yan groups have reported a ∼4-fold reduction of the QY for a CdSe/ZnS core/shell QD after ligand exchange with MPA.43,44 This is likely due to the creation of some new surface defects during the ligand exchange that can trap the exciton carriers (see later discussion). The CDL-QD aqueous solution is very stable, no changes in absorption or fluorescence were observed over 1 year when stored at dark at 4 °C, whereas the MPA-QD was stable for ∼4 weeks under similar conditions. The enhanced stabilisation by the CDL is assumed to be due to the strong chelative binding and a dense, entangled hydrophilic surface coating that can effectively prevent chemical oxidants, i.e. O2, from interacting and oxidising the ligand thiolates and the QD core. Compared to a water-soluble QD (the same batch) capped by the chelative DHLA ligand (DHLA-QD), the CDL-QD appeared to have similar storage stabilities (the DHLA-QD could also be stored for over 1 year without precipitation). Given both the CDL and DHLA bind the QD via the same chelative moiety (the DHLA unit), and also use the same electrostatic stabilization mechanism for water-dispersion (via de-protonated carboxylic acid groups), the pH stability of both QDs are expected to be similar, i.e. stable over the pH 7–12 range.45 A distinct advantage of the CDL-QD over the DHLA-QD however, is its ability to resist DNA non-specific adsorption. Strong FRET signal resulting from non-specific adsorption was observed on mixing a labelled DNA with the DHLA-QD, in contrast, no FRET signal was observed for the CDL-QD-DNA conjugate if the DNA sequence is non-complementary (see ESI,† Fig. S6 and below), suggesting that the CDL-QD was able to resist non-specific adsorption. Thus the dense and entangled surface packing of CDL dendritic structure appeared to be key to resist DNA non-specific adsorption, an essential requirement for specific DNA sensing.
Introduction of S2− ions to the CDL-QD (EM 540 nm) solution was found to significantly enhance the fluorescence intensity of the QD. Fig. 2A shows the fluorescence spectra of the CDL-QD (100 nM) in tris buffer (10 mM Tris.HCl, pH 7.6) with different concentrations of added Na2S. It is clear that the QD fluorescence increases significantly with the increasing Na2S concentration with little change of the spectral shape. An enhancement factor of 2.2 fold is observed at 1 mM Na2S. In contrast, the MPA-QD showed a very different behaviour: its fluorescence initially showed a small increase (∼25%) up to 100 μM Na2S, however, as the Na2S concentration was increased further to 1 mM, its intensity actually decreased back to its original value (ESI,† Fig. S3). Fig. 2B compares the absolute fluorescence intensities of the CDL- and MPA- QDs (both at 100 nM) at different Na2S concentrations. The CDL- and MPA-QDs clearly showed a markedly different dependence on the Na2S concentration: the intensity ratio (ICDL-QD/IMPA-QD, where ICDL-QD and IMPA-QD are the intensities of the CDL- and MPA- QDs, respectively) increases significantly with the increasing Na2S concentration, from an initial ratio of ∼1.4 (at 0 mM) to ∼ 5.0 at 1 mM Na2S.
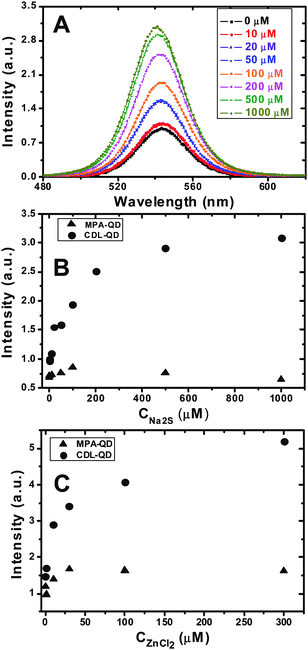 | ||
| Fig. 2 (A) Fluorescence spectra of the CDL-QD (EM 540 nm) in Tris (10 mM tris.HCl, pH 7.60) with different concentrations of Na2S. (B and C) The effect of added Na2S (B) and ZnCl2 (C) concentrations on the fluorescence intensities of the CDL- (solid circles) and MPA- (triangles) QDs in Tris buffer. All experiments were carried out with a fixed QD concentration of 100 nM. | ||
Addition of Zn2+ ions (ZnCl2) to the CDL-QD system also had a significant impact: the CDL-QD fluorescence is enhanced significantly with the increasing Zn2+ concentration, reaching a maximum enhancement of ∼2.5-fold at 300 μM ZnCl2 (Fig. 2C). In contrast, addition of Zn2+ ions to the MPA-QD had a much smaller effect, where a maximum fluorescence increase of up to only 40% is observed (Fig. 2C). The fluorescence intensity of the CDL-QD is 3.2 times that of the MPA-QD in 300 μM ZnCl2, confirming that the CDL a much better ligand for making stable, high-quality, water-soluble QDs than the MPA. It is noteworthy that under optimum conditions (i.e. with 300 μM Zn2+ or 1 mM S2−), the CDL-QD retained ∼90% of the parent TOPO-QD fluorescence which is significantly higher than that for the MPA-QD (ca. 20–25%).
Although there have been several reports51–58 showing that the QD fluorescence can be enhanced by several different ways, photo-brightening, treatments with metal ions and/or using different ligands capping, most of these reports have related to the core-only QDs (e.g. CdS, CdSe, CdTe).51–57 It has been very rare to observe significant fluorescence enhancement (e.g. > 2-fold) with the core/shell QDs (e.g.CdSe/ZnS here) by treatments with metal and/or other ions. The observed enhancement following treatment with S2− ion appears novel. The fluorescence enhancement was found to be specific for the Zn2+ or S2− ions: addition of NaCl (1 mM) did not produce any observable changes to the CDL-QD fluorescence under identical conditions. The fact that the CDL-QD fluorescence is significantly enhanced with moderate Zn2+ or S2− ion concentration indicates that the CDL-QD may be used as a potential sensor for Zn2+ and S2− ions with μM sensitivity.
The QDs used here are CdSe/ZnS core/shell based, where the fluorescent CdSe core is protected by a higher band-gap ZnS shell that can confine the exciton in the core to enhance the quantum yield (QY). Therefore the quality of the shell is critical to the QY of the QD. A significant reduction of QY commonly observed for CdSe/ZnS core/shell QDs following ligand exchange is probably due to the creation of some new surface defects arising from the loss of some Zn2+ and S2− ions (i.e. ion vacant sites, Fig. 3) on the ZnS shell. These defects can trap the exciton carriers, preventing them forming emissive re-combinations at the QD core. This is supported by observations that the fluorescence of CdSe core only QD (without an inorganic shell) is often completely diminished after ligand exchange with hydrophilic thiols, whereas for very thick shell (e.g. 19-molecular layer) coated giant CdSe/CdS core/shell QDs, the fluorescence is completely insensitive to solvents and does not change after ligand exchange.33 Conventional core/shell QDs of moderate shell thicknesses are in between the former two cases.41–48 These differences are likely due to fact that the surface defects induced by ligand exchange are directly located on the fluorescent core in the core-only QDs, making them very effective in trapping exciton carriers, whereas for giant core/shell QDs, the excitons are exclusively confined in the fluorescent core by a very thick shell, so any surface defects created on the outmost shell can not trap carriers.
 | ||
| Fig. 3 Schematic show of possible defect passivation process of a CdSe/ZnS core/shell QD (the CdSe core is shown in green and ZnS shell in orange, and organic ligands are omitted for simplicity). (A) A parent core/shell QD; (B) surface defects (ion vacant sites) arising from the loss of Zn2+ (black dots) and S2− (white dots) are created on the ZnS shell after ligand exchange; (C) addition of Zn2+ ions passivates the Zn2+ vacant sites on the ZnS shell, leading to significant fluorescence enhancement. | ||
Introducing Zn2+ or S2− ions to the CdSe/ZnS QD system may play two different roles: 1) they may bind to the surface defects (Zn2+ or S2− vacant sites) to passivate them and so enhance fluorescence (Fig. 3C); and 2) they may compete with the QD for the capping ligands or vice versa. As the binding between the QD and thiolate ligands is mainly via coordination of the thiolates to QD surface Zn2+ ions,14–24 the added S2− ions may compete with the ligands for binding to the QD surface Zn2+, while the added Zn2+ ions may compete with QD surface Zn2+ for binding to the ligands. As a result, some capping ligands may be stripped off the QD surface, which may lead to QD aggregation. Since the capping ligands are essential for stable dispersion of the QDs in solution, this may cause fluorescence to decrease. The net result will depend on the balance of the two effects. For strong ligands, the ligand-QD binding may not dissociate even at high Zn2+ or S2− concentrations, which would allow effective passivation of the defects and thus significant fluorescence enhancement. This is supported by a preliminary AFM topographic imaging (tapping mode in air) study where the CDL-QDs deposited on ultra-flat template stripped gold (TSG) surfaces59–61 appeared to have similar heights (4–5 nm) before and after the treatment with 300 μM Zn2+ (see ESI,† Fig. S4). Whereas for weak ligand capped QDs, the first effect may dominate at low Zn2+/S2− ion concentrations, allowing partial passivation of the defects and a small fluorescence enhancement. As the ion concentration is increased, the second effect may become more important, leading to QD fluorescence to decrease. It is therefore not too surprising that the CDL-QD exhibits a much greater fluorescence enhancement than the MPA-QD because the chelative binding between the CDL and the QD is much stronger than that for mono-dentate MPA, so the CDL ligands can still bind to the QD without dissociation at high Zn2+ or S2− concentrations, whereas significant amount of the MPA ligands may dissociate from the QD under similar conditions.
We noticed that there was some variation in the degree of fluorescence enhancement with different batches of CdSe/ZnS QDs, possibly due to different ZnS shell thicknesses. However results from the same batch of QD were always consistent and repeatable. Fluorescence enhancement by addition of Zn2+ has been reported before for CdS and CdTe core-only QDs,51–53 where the maximum enhancement occurred at a Zn2+:QD ratio of < 1. While in our case, the maximum enhancement happens at the much higher Zn2+:QD ratio of ca 3000 (e.g. 100 nM QD solution with 300 μM Zn2+), which agrees well with our proposed mechanism of multiple Zn2+ ions binding to multiple Zn2+ vacant sites on each QD for effective surface defect passivation and hence maximum fluorescence enhancement. This mechanism is different from those proposed previously for core-only QDs, for example, a cysteine coated CdS QD where the formation of a Zn-cysteine complex on the CdS QD surface that requires at most one Zn2+ ion per QD was proposed to be responsible for the observed fluorescence enhancement.51
The effects of the added Zn2+ and S2− ions on the CDL-QD fluorescence enhancement can be well-described by a typical Langmuir adsorption model (Fig. 4, see experimental section for details of the fitting process).51 Both fits are highly linear (R > 0.995) and the fits give binding constants of 9.6 and 34.9 for the Zn2+ and S2− ions respectively. The binding constant values are at least an order of magnitude greater than that for the CdS core-only QDs.51
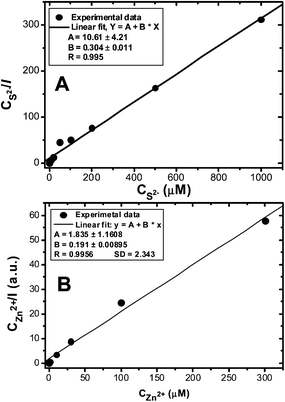 | ||
| Fig. 4 Langmuir adsorption plots for the CDL-QD in tris buffer (10 mM Tris-HCl, 100 mM NaCl, pH 7.4) with different concentrations of added Na2S (A) or ZnCl2 (B). | ||
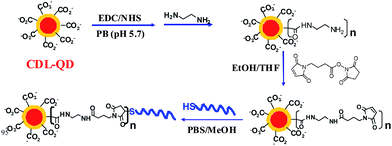
The excellent stability of the CDL-QD makes it very attractive for developing robust QD-FRET based biosensors. To investigate this potential, a short single-stranded DNA target (DNA-T, 5′-ATC GCA AGA ATT CCA TGA CCA ACC TGC ACT-3′, with 5′ modified with a HSC6H12 linker) was conjugated to the CDL-QD to make a functional QD-DNA-T conjugate sensor for detection of its complementary DNA probe (Alexa 647 labelled). A CDL-QD (EM = 600 nm) was used because its emission has good spectral overlap to the Alexa 647 acceptor (see ESI,† Fig. S5) which is important for increasing the FRET efficiency (sensitivity). Although the use of the EM 540 nm QD could benefit from a smaller crystal radius that may lead to a smaller donor–acceptor distance (r) and hence higher FRET efficiency, our calculation however, indicates that this potential benefit is completely out-weighted by a much shorter R0 resulting from the significantly smaller spectral overlap (see ESI,† Fig. S5). Attempts to direct couple the CDL-QD with a 5′ H2NC6H12-modified DNA-T (identical sequence to DNA-T) using the EDC/NHS mediated covalent coupling by our previously described procedures were unsuccessful.22 Therefore a modified strategy (Scheme 2) that first transformed some of the surface COOH groups into amines, followed by reaction with a hetero-functional cross linker (4-maleimidobutanoic acid NHS ester) to introduce maleimide groups, and finally by reaction with the thiolated DNA-T, was developed and successfully used to prepare the QD-DNA-T conjugate (see Experimental Section for detailed procedures). The average copy number of the DNA-T molecules attached to each QD was estimated to be ∼4 using our previous established method,22 assuming that any DNA-Ts not in the final clear supernatant were attached to the QD (see Experimental Section).
 | ||
| Scheme 2 Schematics route for the preparation of CDL-QD-DNA-T conjugate as a DNA sensor. | ||
To confirm whether the QD-DNA-T conjugate is functional and available for specific DNA hybridization, a solution of the QD-DNA-T conjugate (50 nM, final concentration) was mixed with a labelled complementary DNA probe, DNA-1 (500 nM) in PBS for 30 mins. The resulting fluorescence spectrum is shown in the ESI,† Fig. S6a. Hybridisation of DNA-1 to the QD-DNA-T conjugate brings the Alexa 647 dye on DNA-1 into the close proximity to the QD donor, therefore when the QD is excited, it can transfer energy to the dyevia FRET. Since FRET can only happen at small distances (e.g. < 10 nm), any free DNA-1 not bound to the QD-DNA-T conjugate does not contribute to the FRET signal. It is clear from Fig. S6a that when DNA-1 is introduced, a signficant quenching of the QD emission at ∼600 nm with simultaneous ehancement of Alexa-647 emission at ∼670 nm were observed, confirming that the DNA-1 probe has sucessfully hybridised to the QD-DNA-T conjugate. As a control, a noncomplementary DNA (also labelled with Alexa-647), DNA-NC, was also added to the QD-DNA-T conjugate under identical conditions. This produced almost no detecable Alexa-647 FRET signal (ESI,† Fig. S6b), indicating no non-specific adsorption of DNA-NC to the QD-DNA-T conjugate. The fluorescence intensity ratios of Alexa 647 FRET signal to that of the QD, IDye/IQD, for the DNA-1 and DNA-NC were calculated to be 13.3% and 0.39%, respectively (see ESI,† Fig. S6). This gave an impressive fluorescence signal selectivity of ca. 34 (e.g. 13.3%/0.39%), which is an order of magnitude higher than several other recently reported QD-DNA conjugate based FRET sensors for short-stranded DNA probes (see Table 1). This control experiment confirms that the CDL-QD can eliminate non-specifc adsorption of the DNA and that the observed FRET signal is specific for the complementary DNA probe. Therefore the QD-DNA-T conjugate is suitable for specific DNA detection.
| System | Target/length | Specificity | LOD (nM) | Ref. |
|---|---|---|---|---|
| a BRET: bioluminescence resonance energy transfer. b LOD: Limit of detection. c Specificity: specific fluorescence response ratio of complementary to non-complementary DNA. | ||||
| BRET | DNA/22 mer | ? | 20 | 62 |
| FRET | DNA/19 mer | <2 | 40 (1 μM QD) | 24 |
| FRET | DNA/24 mer | <2 | 12 (0.06 μM QD) | 24 |
| FRET | DNA/25 mer | ∼3 | 200 | 63 |
| FRET | DNA/18–32 mer | 2-3 | ∼5 | 20 |
| FRET | DNA/30 mer | 34 | 0.5 | This work |
Fig. 5A shows the evolution of the fluorescence spectra of the QD-DNA-T conjugate (3.3 nM) upon addition of DNA-1 (16.5 nM, DNA-1:QD ratio = 5:1). It is clear that the decrease of QD fluorescence and increase of dye FRET signal are observed simultaneously, confirming the successful DNA hybridisation that leads to QD sensitised dye FRET signal. Fig. 5B shows the detailed time-dependent fluorescence intensities of both the QD and the dye, and provides a clearer indication of the simultaneous QD fluorescence decrease and dye FRET signal increase. A rapid change of the QD and dye fluorescence was observed just after the DNA-1 addition, and the rate of the change gradually slows down and finally reaches equilibrium at ∼60 min. This experiment shows that the DNA-1 and QD-DNA-T hybridization reaction reaches completion in ∼60 min at a low nM DNA concentrations.
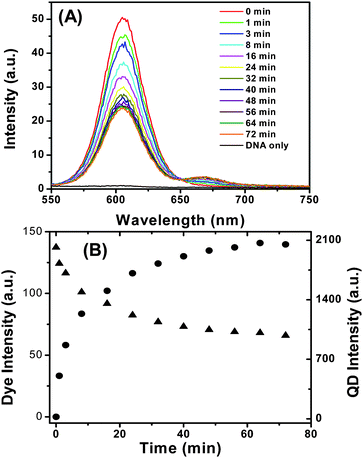 | ||
| Fig. 5 (A) Time-dependent fluorescence spectra evolution of the QD-DNA-T (3.3 nM) after mixing with DNA-1 (16.5 nM). The DNA only sample is collected with 16.5 nM of DNA-1 without the QD. (B) Plot of the fluorescence intensities of the Alexa 647 (solid circles) and the QD (solid triangles) versus the incubation time. | ||
Having confirmed that the QD-DNA-T conjugate can hybridize to its complementary DNA probe quickly and specifically, we went on to investigate its sensitivity. To do this, a series of samples, each containing 4 nM of QD-DNA-T conjugate and different concentrations of DNA-1 in PBS buffer were prepared and allowed to hybridize for 2 h. The resulting fluorescence spectra are shown in Fig. 6A. It is clear that the Alexa 647 FRET signal is significantly enhanced with the increasing concentration of the DNA-1, suggesting the successful hybridisation that leads to QD-sensitized dye FRET signal. Although the absolute fluorescence intensity of the QD donor in Fig. 6A does not always follow a simple decreasing trend with the increasing DNA-1 concentration, possibly due to some QD fluorescence QY change at different DNA-1 concentrations, a ratiometric analysis of the data provides a clear trend, where the IDye/IQD is plotted against the DNA-1 concentration and the result is shown in Fig. 6B.
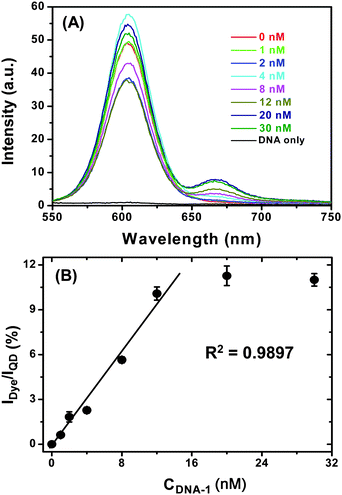 | ||
| Fig. 6 (A) A representative fluorescence spectra of a series of QD-(DNA-T)n (4 nM) samples after hybridization with different concentrations of DNA-1 in PBS. The DNA only sample is recorded with 30 nM DNA-1 in PBS without the QD. (B) A plot of Dye FRET signal to QD fluorescence intensity ratio (IDye/IQD) v.s. the DNA-1 concentration. The last two data points (with highest DNA-1 concentration) are masked from the linear fit. The error bars show the standard deviation from three parallel tests. | ||
A good linear relationship between (R2 ∼ 0.99) the IDye/IQD the DNA-1 concentration is observed up to 12 nM, after which the ratio remains broadly constant throughout the DNA-1 concentration range studied. The IDye/IQD signal saturation is probably an indication of all accessible DNA-Ts on the QD being hybridised to their labelled probes. Thereafter, any added DNA-1s can no longer hybridise to the QD and thus remain “free” in solution. Since FRET only happens over short distances (< 10 nm), these “free” DNA-1s do not participate FRET with the QD and therefore do not contribute to the observed FRET signal. This is a particular advantage for FRET based sensors, which only detect species in close proximity, any free molecules not bound to the donor (e.g. QD in this case) do not interfere with the detection. Since the FRET signal used here for analysis is ratiometric, it is potentially insensitive to instrument noise and signal flucations, and thus can provide accurate and reliable measurement.7 This result clearly shows that the QD-DNA-T conjugate sensor is well suited for the quantification of specific, labelled complementary DNA probes.
A magnification of the dye FRET spectral region (e.g. 640–750 nm) clearly shows that addition of 1 nM DNA-1 to the QD-DNA-T conjugate can produce a clear distinguishable FRET signal from that of the QD-DNA-T only sample, and also that the dye FRET signal is not due to the direct excitation of the dye (see ESI,† Fig. S7). The detection limit for the QD-DNA-T system under this condition is estimated to be ∼500 pM for DNA-1 on a conventional fluorimeter, which is at least an order of magnitude better than several other recently reported QD-FRET systems for short-stranded DNA probes under similar conditions (see Table 1), presumably due to a more stable QD-DNA conjugate that can retain more QD fluorescence.24 In addition, our system also exhibited an order of magnitude higher signal selectivity compared to these recent literature examples (see Table 1), highlighting the advantage of the CDL-QD in potential biosensing applications.
Conclusion
In conclusion, we have shown that by combining the chelative binding and dendritic structure, the CDL ligands can provide a strong, compact and entangled hydrophilic coating on the QD which can significantly enhance the stability of the resulting water-soluble QD and lead to a smaller reduction of QD QY compared to a monodentate thiol ligand, MPA. The excellent stability of the CDL-QD has enabled effective passivation of the surface defects caused by ligand exchange by treatments with Zn2+ or S2− ions, which gives a water-soluble QD with fluorescence comparable to that of the parent QD in native ligands. This opens a new opportunity of making high-quality, stable, compact, water-soluble QDs with potentially reduced batch-to-batch variations. Further, by coupling a short DNA target to the QD, a functional QD-DNA conjugate that hybridizes quickly and specifically to its complementary DNA has been prepared. This QD-DNA conjugate is well-suited for the quantification of specific, complementary DNA probes at low DNA:QD copy numbers via the QD-sensitised dye FRET signal with 500 pM sensitivity on a conventional fluorimeter. The sensitivity and specificity of this system compare very favourably over several other recently reported QD-DNA conjugate based FRET sensors for short-stranded DNA probes (see Table 1). Extension of the DNA target to DNA/RNA aptamers will allow the development of a general QD-aptamer sensing technology suitable for a wide range of targets, from disease protein and DNA biomarkers, toxic food residues, street drugs to harmful environmental pollutants.64,65 Work on these aspects of applications are currently underway in our laboratory.Experimental section
Materials and reagents
All CdSe/ZnS core/shell QDs (first exciton peaks, 525 and 585 nm, and EM ∼540 and 600 nm) were purchased from Evident Technologies Inc (Troy, USA). They were supplied in toluene solutions capped with trioctylphosphine oxide (TOPO) ligands with average crystal core diameters of 2.4 and 4.0 nm respectively. N,N′-dicyclohexylcarbodiimide (DCC) was purchased from Acros Organics (Loughborough, UK). N-(3-dimethylaminopropyl)-N-ethyl-carbodiimide hydrochloride (EDC.HCl,99%), N-hydroxysuccinimide (NHS, 98%), sodium bicarbonate, 3-mercaptopropionic acid (>99%), lipoic acid (>98%), dithiothreitol (DTT, >98%), 4-maleimidobutanoic acid NHS ester, bromoacetylbromide (98%), diethyl imino-diacetate (98%), trifluoroacetic acid (>99%), Tris base, DNAse and RNAse free NaCl, Na2HPO4, Na2S.9H2O (>98%), ZnCl2 (>99%) and other chemicals were all purchased from Sigma-Aldrich (Dorset, UK). Solvents were obtained from Fisher Scientific (Loughborough, UK) and used as received. Thin layer chromatography (TLC) was performed with commercial silica gel plates with fluorescent backing. The plates were visualised by fluorescence under UV 254 nm irradiation or by iodine staining. Column chromatography was performed using 230–400 mesh silica gel purchased from Breckland Scientific Supplies (Thetford, UK). All DNAs used were purchased from IBA GmbH (Göttingen, Germany). The thiol modified DNA target (DNA-T, 5′-ATC GCA AGA ATT CCA TGA CCA ACC TGC ACT-3′, with 5′ modified with a HSC6H12 linker) is of HPLC grade, and the dye-labelled complementary DNA (DNA-C, 3′-TAG CGT TCT TAA GGT ACT GGT TGG ACG TGA-5′, 3′ labelled with Alexa 647) and noncomplementary DNA (DNA-NC, 3′-AGC TCA CAC AAC GCC CTG ATG TTA CCG AAC-5′, 3′ end labelled with Alexa 647) are double HPLC purified by the supplier. 10 × PBS buffer (100 mM phosphate, 1.50 M NaCl, pH 7.2), phosphate buffer (PB, 20 mM phosphate, pH 5.7), Na2CO3 aqueous solution (1 M) and tris buffer (10 mM tris.HCl, 100 mM NaCl, pH 7.4) were all prepared with ultra-pure MilliQ water (resistance > 18 MΩ.cm−1).Synthesis of the chelating dendritic ligand-ethyl ester
The synthesis of the CDL-ethyl ester ligand was carried out by following a literature procedure with modifications shown schematically in Scheme 1.501: Bromoacetylbromide (0.11 mol) was added dropwise into a solution of diethyl iminodiacetate (10 g, 0.052 mol) in 40 mL ethyl acetate under stirring cooled over an ice-bath over 15 mins. The reaction mixture was then allowed to warm up to RT and refluxed for a further 30 min. The solvent and excess of bromoacetylbromide were removed under reduced pressure. Then CHCl3 was added and the resulting organic layer was washed with aqueous 5% NaHCO3 solution and then with saturated brine. The organic phase was separated and dried with anhydrous Na2SO4 and the solvent was removed under reduced pressure to give a light brown liquid 1 in 98% yield. ESI-MS (m/z): 357 (M + H+). 1H NMR (400 MHz, CDCl3): δ (ppm) 1.24 (m, 6H, CH3), 4.17 (m, 10H, CH2).
2: N-Boc-Ethylenediamine (0.970 g, 6.05 mmol), 1 (3.740 g, 12.1 mmol), anhydrous K2CO3 (1.659 g, 12.0 mmol) and DMF (13 mL) were mixed together and stirred vigorously under nitrogen at 60 °C for 24 h. The solid in the reaction mixture was filtered off, and the solvent was removed under reduced pressure (2 mmHg, 40 °C, 30 min). The residue was dissolved in ethylacetate (60 mL). The solution was then washed with water (3 × 10 mL), brine (3 × 10 mL) and dried over MgSO4. The solvent was removed to give a crude product, which was purified by flash column chromatography (MeOH:CHCl3 1:25), giving the desired carbamate (3) (2.93 g, 78%) as a viscous yellow liquid. TLC (MeOH/CHCl3 1:25) Rf 0.21. 1H-NMR (400 MHz): δ (ppm) 5.73 (t, br, J = 4.5, 1H, H9), 4.32 (s, 4H, H14), 4.21 (q, J = 7.2, 4H, H16), 4.17 (q, J = 7.1, 4H, H16), 4.12 (s, 4H, H14), 3.49 (s, 4H, H12), 3.18 (q, J = 5.1, 2H, H10), 2.73 (t, J = 5.7, 2H, H11), 1.43 (s, 9H, Hx), 1.28 (t, J = 7.1, 6H, H17), 1.25 (t, J = 7.1, 6H, H17). 13C-NMR (100 MHz): δ (ppm) 170.79 (C, C13), 169.05 (C, C15), 169.02 (C, C15), 156.31 (C, Cz), 78.69 (C, Cy), 61.61 (CH2, C16), 61.24 (CH2, C16), 55.86 (CH2, C12), 53.52 (CH2, C11), 49.80 (CH2, C14), 48.20 (CH2, C14),38.04 (CH2, C10),28.38 (CH3, Cx), 14.08 (CH3, C17). HR-MS: calcd m/z for C27H46N4O12Na (M + Na)+ 641.3010, found 641.3011.
3: A mixture of 2 (1.126 g, 1.820 mmol), trifluoroacetic acid (5.5 mL) and CH2Cl2 (5.5 mL) was stirred under a nitrogen atmosphere for four hours at 25 °C. The solvent was removed. Aqueous solution (1 M) of sodium carbonate was added to neutralise the mixture, which was then extracted with CHCl3 (4 × 10 mL). The organic extract was washed with brine (1 × 15 mL) and dried with MgSO4. The solvent was removed to give the crude compound 3 (0.882 g, 93%) as a viscous yellow liquid. The crude product was used for the next step without purification. TLC (MeOH/CHCl3 1:25) Rf 0.05. 1H-NMR (400 MHz): δ (ppm) 4.31 (s, 8H, H14), 4.17 (q, J = 7.1, 8H, H16), 3.46 (s, 4H, H12), 2.80 (m, 4H, H10, H11), 1.21 (t, J = 7.2, 12H, H17). 13C-NMR (100 MHz): δ (ppm) 171.07 (C, C15), 169.01 (C, C13), 61.20 (CH2, C16), 56.26 (CH2, C11), 50.13 (CH2, C12), 48.21 (CH2, C14), 39.20 (CH2, C10), 14.08 (CH3, C17). HR-MS: calcd m/z for C22H38N4O10Na+ (M + Na+)+ 541.2486, found 541.2518.
4: A solution of lipoic acid 5 (0.308 g, 1.49 mmol), and 3 (0.773 g, 1.49 mmol) and 4-dimethylaminopyridine (0.017 g, 1.6 mmol) in CH2Cl2 (3 mL) was cooled to 0 °C under a nitrogen atmosphere. To this mixture a solution of dicyclo-hexylcarbodiimide (0.339 g, 1.64 mmol) in CH2Cl2 (3 mL) was added dropwise over 5 min. The reaction mixture was stirred for 1.5 h at 0 °C, then warmed to 25 °C and stirred for 24 h. The precipitate formed was filtered out. The reaction mixture was washed with brine and dried with magnesium sulfate. The solvent was removed to give a crude product, which was then purified by column chromatography (MeOH/CHCl3 1:25), giving 4 (0.78 g, 73%) as a viscous yellow liquid. TLC (MeOH/CHCl3 1:25) Rf 0.19. 1H-NMR (400 MHz): δ (ppm) 7.49 (s, br, 1H, H9), 4.25 (s, 8H, H14), 4.20 (q, J = 7.3, 8H, H16), 4.14 (s, 4H, H12), 3.58 (m, 1H, H3), 3.26 (q, J = 5.0, 2H, H10), 3.13 (m, 2H, H1), 2.79 (t, J = 5.2, 2H, H11), 2.46 (m, 1H, H2), 2.25 (t, J = 7.5, 2H, H7), 1.91 (m, 1H, H2), 1.70 (m, 4H, H4, H6), 1.47 (m, 2H, H5), 1.27 (t, J = 7.2, 12H, H17). 13C-NMR (100 MHz): δ (ppm) 173.42 (C, C8), 171.15 (C, C15), 168.78 (C, C13), 61.35(CH2, C16), 56.45 (CH, C3), 55.45 (CH2, C11), 52.91 (CH2, C12), 48.28 (CH2, C14), 40.18 (CH2, C2), 38.40 (CH2, C10), 37.21 (CH2, C1), 36.13 (CH2, C4), 34.61 (CH2, C7), 28.93 (CH2, C5), 25.38 (CH2, C6), 14.12 (CH3, C17). HR-MS: calcd m/z for C30H50N4O11S2Na (M + Na)+ 729.2815, found 729.2847.
:25). CDL-ester was collected as a viscous colourless liquid (0.200 g, 50%). TLC (MeOH/CHCl3 1:25) Rf 0.17. 1H-NMR (400 MHz): δ (ppm) 7.43 (s, br, 1H, H9), 4.24 (s, 8H, H14), 4.19 (q, J = 7.2, 8H, H16), 4.13 (s, 4H, H12), 3.57 (s, br, 2H, H10), 2.92 (m, 1H, H3), 2.69 (m, 2H, H1), 2.23 (t, J = 7.4, 2H, H7), 1.88 (m, 1H, H2), 1.78–1.39 (m, 7H, H2, H4–H6), 1.34 (t, J = 8.0, 1H, Ha), 1.29 (d, J = 7.3, 1H, Hb), 1.26 (t, J = 7.2, 12H, H17). 13C-NMR (100 MHz): δ (ppm) 172.97 (C, C8), 170.89 (C, C15), 168.54 (C, C13), 61.40 (CH2, C16), 55.38 (CH2, C11), 52.68 (CH2, C12), 48.31 (CH2, C14), 42.77 (CH2, C2), 39.40 (CH, C3), 39.09 (CH2, C10), 38.82 (CH2, C4), 36.21 (CH2, C7), 26.72 (CH2, C5), 25.27 (CH2, C6), 22.27 (CH, C1), 14.13 (CH3, C17). HR-MS: calcd m/z for C30H52N4O11S2Na (M + Na+) 731.2972, found 731.2980.
Preparation of water-soluble QDs by ligand exchange
The ligand exchange reactions of the QDs with functional thiols were carried out following our earlier procedures.22 Briefly, the TOPO capped CdSe/ZnS core/shell QD was precipitated by adding ∼1 mL of the toluene solution to ∼10 mL of ethanol, and the resulting mixture was then centrifuged at 14,000 rpm for 5 mins. The clear supernatant was discarded. The pellet was dissolved in ∼0.5 mL toluene and precipitated by ethanol for another time. This process was used to remove any uncapped free TOPO ligand that may interfere with the ligand exchange. The pellet was then dissolved in 1 mL CHCl3, into which 1 mL ethanol solution of the functional thiol ligands (1 M for MPA, or 40 mM for CDL-ester) and tetramethylammonium hydroxide (2 mole equivalent of ligands) were added. The resulting mixed solution was refluxed for 4 h under a N2 atmosphere. After which the solvent was removed under reduced pressure. The solid was then dissolved in ∼0.5 mL EtOH, and CHCl3 was added to precipitate the MPA-QDs followed by centrifugation at 14000 rpm for 10 mins. The dissolving, precipitation and centrifugation process was repeated three times to remove any uncapped free ligands. The pellet was air dried and finally dissolved in ∼2 mL of MilliQ water to make the MPA-QD stock solution.
A modified procedure was used to make CDL-QDs. After the initial ligand exchange and removal of solvents as above, the solid was dissolved in CHCl3 and hexane was added to precipitate the CDL-ester capped QDs followed by centrifugation. The process was repeated twice to remove any uncapped free ligands. The CDL ester ligands on the QD were hydrolysed to carboxylic acids by dissolving the pellet in a mixed solution of EtOH (1 mL) and K2CO3 aqueous solution (1 M, 1 mL), the resulting solution was refluxed for 2 h to obtain a precipitate which was collected after centrifugation. It was then dissolved in water (∼0.2 mL) and precipitated by EtOH and followed by centrifugation to remove the clear supernatent. The process was repeated three times and finally the pellet was dissolved in 2 mL of pure water to make the stock CDL-QD solution.
All water-soluble QD stocks were stored in pure water in the dark at 4 °C. They were only mixed with salt containing buffers just before the measurements. The concentrations of the stock QDs were calculated from their absorbance at their exciton peaks at 525 or 585 nm using absorption extinction coefficients of 6.7 × 10⁴ (for 540 QD) or 2.6 × 10⁵ M−1cm−1 (for 600 QD) provided by Evident Technologies Inc.29
Preparation of the QD-DNA-T conjugate
EDC (30 mg) and NHS (15 mg) were dissolved in 500 μL phosphate buffer (20 mM, pH 5.7) into which CDL-QD (4 μM, 250 μl, 1 nmol) was added and the resulting solution was thoroughly mixed and allowed to stand at RT for 1 h. After which it was centrifuged, and the clear supernatant was removed. The pellet was carefully washed with water (200 μL) and then ethylenediamine aqueous solution (1 M, 500 μl) was added. The resulting solution was briefly sonitated to break up the pellet, and then allowed to react at 4 °C for 2 h. After which the sample was centrifuged to remove the clear supernatant, and the pellet was washed with water (2 × 200 μL). Then pellet was mixed with 4-maleimidobutanoic acid NHS ester in EtOH/THF (1:1 v/v, 4 mg in 1 mL) and the resulting suspended solution was sonicated for 5 min to break up the pellet, and the resulting solution was allowed to react at 4 °C overnight. After which the solution was centrifugated to discard the clear supernatant, the pellet was washed three times with EtOH/THF (1:1 v/v. 3 × 200 μL) to remove free 4-maleimidobutanoic acid NHS ester and then with water (1 × 200 μL). Finally the pellet with mixed with DNA-T (100 μM, 200 μL, 20 nmole, DNA-T:CDL-QD ratio = 20:1) in PBS (10 mM phosphate, 150 mM NaCl, pH 7.2) and the resulting mixture was sonicated for 5 min to break up the pellet and the resulting solution was allowed to react for 24 h at 4 °C. After that, the solution was centrifuged and the clear supernatant which contained the unreacted DNA-T was carefully removed (checked with an UV lamp to ensure it did not contain any QDs). The pellet was carefully washed with 200 μL PBS and an absorption spectrum was taken on the combined clear supernatant/wash and the absorbance at 260 nm was used to calculate the amount of DNAs not conjugated to the QD, which gave a value of ∼16 nmol. Therefore there were 4 nmol of the DNA-T conjugated to the CDL-QD (1 nmol), so the DNA-T copy numbers attached to each QD was estimated to be ∼4. Finally, the pellet was dissolved in 0.5 mL of pure water to obtain a clear QD-DNA-T stock solution and stored in the dark at 4 °C.
Fitting of Zn2+ and S2− fluorescence enhancement by the Langmuir adsorption model.51
The CDL-QD fluorescence intensity is found to increase with the increasing Zn2+ or S2− ion concentrations, but levels off when all binding sites are occupied. According to the Langmuir adsorption model, the QD surface contains a finite number of binding sites. Each of the binding sites can absorb one ion from the solution. The fraction of occupied sites is defined as η. The rate of ion binding to the QD surface is proportional to the ion concentration C in solution and to the fraction of available binding sites 1 - η. The rate of ion binding, Ra, to the surface is expressed as:| Ra = KaC(1 − η) | (1) |
The rate of desorption, Rd, of bound ions from the surface depends on the fraction of occupied binding sites as
| Rd = Kd η | (2) |
At equilibrium, the rate of binding equals to the rate of desorption. Therefore
| Kd η = KaC(1 − η) | (3) |
The equation can be solved for η as a function of the ratio, K= Ka/Kd.
| η = (KC)/(1 + KC) | (4) |
Assuming the QD fluorescence intensity ratio obtained at a given ion concentration I and the maximum intensity Imax is proportional to the fraction of occupied binding sites, η
| η = I/Imax | (5) |
Then an expression that relates the ion concentration, C, to the signal intensity can be written as:
| I/Imax = (KC)/(1 + KC) | (6) |
This equation can be linearized as,
| C/I = 1/(K Imax) + C/Imax | (7) |
All of the data fittings were carried out using eqn (7) and the results are given in Fig. 3.
Fluorescence measurement and FRET calculation
Fluorescence spectra were recorded on a Cary Eclipse fluorescence spectrophotometer. The emission spectra (480–750 nm range) were recorded under a fixed excitation of 450 nm (to minimize direct excitation of the Alexa 647 dye). The spectra were corrected for direct dye excitation using the same dye-labeled DNA as reference. The fluorescence intensity used here was the integrated fluorescence.22 The FRET signals were obtained by using the integrated fluorescence of the whole spectrum subtracting the QD fluorescence, assuming that the QD fluorescence maintained the same shape as the QD-DNA-T conjugate only sample, and that the integrated intensity was proportional to the height of the QD emission peak (the Alexa 647 acceptor did not fluoresce at the QD emission peak).Acknowledgements
We would like to thank the Royal Society (RG 2009R1), the University of Leeds and the Cambridge-ETRI (Korea) international joint research collaboration for funding this project.Notes and references
- A. P. Alivisatos, Science, 1996, 271, 933 CrossRef CAS.
- A. P. Alivisatos, Nat. Biotechnol., 2004, 22, 47 CrossRef.
- X. Michalet, F. F. Pinaud, L. A. Bentolila, J. M. Tsay, S. Doose, J. J. Li, G. Sundaresan, A. W. Wu, S. S. Gambhir and S. Weiss, Science, 2005, 307, 538 CrossRef CAS.
- M. Y. Han, X. Gao, J. Z. Su and S. Nie, Nat. Biotechnol., 2001, 19, 631 CrossRef CAS.
- J. M. Klostranec and W. C. W. Chan, Adv. Mater., 2006, 18, 1953 CrossRef CAS.
- S. C. Somers, M. G. Bawendi and D. G. Nocera, Chem. Soc. Rev., 2007, 36, 579 RSC.
- I. L. Medintz and H. Mattoussi, PhysChemChemPhys., 2009, 11, 17 RSC.
- A. R. Clapp, I. L. Medintz, J. M. Mauro, B. R. Fisher, M. G. Bawendi and H. Mattoussi, J. Am. Chem. Soc., 2004, 126, 301 CrossRef CAS.
- L. Shi, V. D. Paoli, N. Rosenzweig and Z. Rosenzweig, J. Am. Chem. Soc., 2006, 128, 10378 CrossRef CAS.
- B. Bakalova, Z. Zhelev, H. Ohba and Y. Baba, J. Am. Chem. Soc., 2005, 127, 11328 CrossRef CAS.
- M. J. Ruedas-Rama, X. Wang and E. A. H. Hall, Chem. Commun., 2007, 1544 RSC.
- I. Potapova, R. Mruk, C. Hübner, R. Zentel, T. Basché and A. Mews, Angew. Chem., Int. Ed., 2005, 44, 2437 CrossRef CAS.
- S. F. Lee and M. Osborne, J. Am. Chem. Soc., 2007, 129, 8936 CrossRef CAS.
- D. J. Zhou, A. Bruckbauer, C. Abell, D. Klenerman and D.-J. Kang, Adv. Mater., 2005, 16, 1243 CrossRef.
- I. L. Medintz, A. R. Clapp, H. Mattoussi, E. R. Goldman, B. Fisher and J. M. Mauro, Nat. Mater., 2003, 2, 630 CrossRef CAS.
- I. L. Medintz, J. H. Konnert, A. R. Clapp, I. Stanish, M. E. Twigg, H. Mattoussi, J. M. Mauro and J. R. Deschamps, Proc. Natl. Acad. Sci. U. S. A., 2004, 101, 9612 CrossRef CAS.
- T. Pons, I. L. Medintz, X. Wang, D. S. English and H. Mattoussi, J. Am. Chem. Soc., 2006, 128, 15324 CrossRef CAS.
- K. Susumu, H. T. Uyeda, I. L Medintz, P. Thomas, J. B. Delehanty and H. Mattoussi, J. Am. Chem. Soc., 2007, 129, 13987 CrossRef CAS.
- Q. Wang, Y. Liu, Y. Ke and H. Yan, Angew. Chem., Int. Ed., 2008, 47, 316 CrossRef CAS.
- H. Peng, L. Zhang, T. H. M. Kjallman, C. Soeller and J. Travas-Sejdic, J. Am. Chem. Soc., 2007, 129, 3048 CrossRef CAS.
- D. J. Zhou, J. P. Piper, C. Abell, D. Klenerman, D.-J. Kang and L. M. Ying, Chem. Commun., 2005, 4807 RSC.
- D. J. Zhou, L. M. Ying, X. Hong, E. A. H. Hall, C. Abell and D. Klenerman, Langmuir, 2008, 24, 1659 CrossRef CAS.
- W. R. Algar and U. J. Krull, Langmuir, 2006, 22, 11346 CrossRef CAS.
- W. R. Algar and U. J. Krull, Anal. Chim. Acta, 2007, 581, 193 CrossRef CAS.
- C. Y. Zhang, H. C. Yeh, M. T. Kuroki and T. H. Wang, Nat. Mater., 2005, 4, 826 CAS.
- E. Oh, M. Y. Hong, D. Lee, S. H. Nam, H. C. Yoon and H. S. Kim, J. Am. Chem. Soc., 2005, 127, 3270 CrossRef CAS.
- S. Hohng and T. Ha, ChemPhysChem, 2005, 6, 956 CrossRef CAS.
- M. Levy, S. F. Cater and A. D. Ellington, ChemBioChem, 2005, 6, 2163 CrossRef CAS.
- Product specification for Evidots nanomaterials and Evitags from Evident Technologies Inc.
- N. N. Mamedova, N. A. Kotov, A. L. Rogach and J. Studer, Nano Lett., 2001, 1, 281 CrossRef CAS.
- S. J. Byrne, S. A. Corr, T. Y. Rakovich, Y. K. Gun'ko, Y. P. Rakovich, J. F. Donegan, S. Mitchellc and Y. Volkov, J. Mater. Chem., 2006, 16, 2689 Search PubMed.
- Y. Zheng, S. Gao and J. Y. Ying, Adv. Mater., 2007, 19, 376 CrossRef CAS.
- Y. Chen, J. Vela, H. Htoon, J. L. Casson, D. J. Werder, A. A. Bussian, V. I. Klimov and J. A. Hollingsworth, J. Am. Chem. Soc., 2008, 130, 5026 CrossRef CAS.
- C. B. Murrey, D. J. Norris and M. G. Bawendi, J. Am. Chem. Soc., 1993, 115, 8706 CrossRef CAS.
- Z. A. Peng and X. Peng, J. Am. Chem. Soc., 2001, 123, 183 CrossRef CAS.
- X. Wu, H. Liu, J. Liu, K. N. Haley, J. A. Treadway, J. P. Larson, N. Ge, F. Peale and M. P. Bruchez, Nat. Biotechnol., 2003, 21, 41 CrossRef CAS.
- W. W. Yu, E. Chang, J. C. Falkner, J. Zhang, A. M. Al-Somali, C. M. Sayes, J. Johns, R. Drezek and V. L. Colvin, J. Am. Chem. Soc., 2007, 129, 2871 CrossRef CAS.
- B. Dubertret, P. Skourides, D. J. Norris, V. Noireaux, A. H. Brivanlou and A. Libchaber, Science, 2002, 289, 1759 CrossRef.
- M. Bruchez Jr., M. Moronne, P. Gin, S. Weiss and A. P. Alivisatos, Science, 1998, 281, 2013 CrossRef CAS.
- D. Gerion, F. Pinaud, S. C. Williams, W. J. Parak, D. Zanchet, S. Weiss and A. P. Alivisatos, J. Phys. Chem. B, 2001, 105, 8861 CrossRef CAS.
- W. C. W. Chan and S. Nie, Science, 1998, 281, 2016 CrossRef CAS.
- H. Y. Zhang, P. G. Stockley and D. J. Zhou, Faraday Discuss., 2010, 149, 10.1039/c005373b.
- Q. Wang, Yang. Xu, X. Zhao, Y. Chang, Y. Liu, L. Jiang, J. Sharma, D. K. Seo and H. Yan, J. Am. Chem. Soc., 2007, 129, 6380 CrossRef CAS.
- W. Liu, H. S. Choi, J. P. Zimmer, E. Tanake, J. V. Frangioni and M. Bawendi, J. Am. Chem. Soc., 2007, 129, 14530 CrossRef CAS.
- A. R. Uyeda, I. L. Medinitz, J. K. Jaiswal, S. M. Simon and H. Mattoussi, J. Am. Chem. Soc., 2005, 127, 3870 CrossRef CAS.
- K. Susumu, B. C. Mei and H. Mattoussi, Nat. Protoc., 2009, 3, 424 Search PubMed.
- F. Dubois, B. Mahler, B. Dubertret, E. Doris and C. Mioskowski, J. Am. Chem. Soc., 2007, 129, 482 CrossRef CAS.
- S. Pathak, S. K. Choi, N. Arnheim and M. E. Thompson, J. Am. Chem. Soc., 2001, 123, 4103 CrossRef CAS.
- C. Querner, P. Reiss, J. Bleuse and A. Pron, J. Am. Chem. Soc., 2004, 126, 11574 CrossRef CAS.
- Y. A. Wang, J. J. Li, H. Chen and X. Peng, J. Am. Chem. Soc., 2002, 124, 2293 CrossRef CAS.
- Y. Cheng and Z. Rosenzweig, Anal. Chem., 2002, 74, 5132 CrossRef CAS.
- K. M. Gattás-Asfura and R. M. Leblanc, Chem. Commun., 2003, 2684 RSC.
- J. Li, D. Bao, X. Hong, D. Li, J. Li, Y. Bai and T. Li, Colloids Surf., A, 2005, 257–258, 267 CrossRef CAS.
- H. Asami, Y. Abe, T. Ohtsu, I. Kamiya and M. Hara, J. Phys. Chem. B, 2003, 107, 12566 CrossRef CAS.
- E. Jang, S. Jun, Y. Chung and L. Pu, J. Phys. Chem. B, 2004, 108, 4597 CrossRef CAS.
- S. F. Wuister, C. D. M. Donega and A. Meijerink, J. Am. Chem. Soc., 2004, 126, 10397 CrossRef CAS.
- N. Gaponik, D. V. Talapin, A. L. Rogach, K. Hoppe, E. V. Shevchenko, A. Kornowski, A. Eychmu1ller and H. Weller, J. Phys. Chem. B, 2002, 106, 7177 CrossRef CAS.
- S. Jeong, M. Achermann, J. Nanda, S. Ivanov, V. I. Klimov and J. A. Hollingsworth, J. Am. Chem. Soc., 2005, 127, 10126 CrossRef CAS.
- D. Zhou, A. Bruckbauer, L. Y. Ying, C. Abell and D. Klemernan, Nano Lett., 2003, 3, 1517 CrossRef CAS.
- D. J. Zhou, K. Sinniah, C. Abell and T. Rayment, Angew. Chem., Int. Ed., 2003, 42, 4934 CrossRef CAS.
- D. S. Liu, A. Bruckbauer, C. Abell, D.-J. Kang, S. Balasubramanian, D. Klenerman and D. J. Zhou, J. Am. Chem. Soc., 2006, 128, 2067 CrossRef CAS.
- K. A. Cissell, S. Campbell and S. K. Deo, Anal. Bioanal. Chem., 2008, 391, 2577 CrossRef CAS.
- J. Lee, Y. Choi, J. Kim, E. Park and R. Song, ChemPhysChem, 2009, 10, 806 CrossRef CAS.
- D. H. J. Bunka and P. G. Stockley, Nat. Rev. Microbiol., 2006, 4, 588 Search PubMed.
- J. Liu, Z. Cao and Y. Lu, Chem. Rev., 2009, 109, 1948 CrossRef CAS.
Footnotes |
| † Electronic Supplementary Information (ESI) available: Absorption and fluorescence spectra of the CDL- and MPA-QDs (EM 540 nm), the AFM topographic images of the CDL-QD with and without Zn2+, spectral overlaps of the EM 540 and 600 nm CDL-QDs with Alexa 647 and details of their Förster radius calculations, fluorescence spectra of the control experiments and the magnified FRET region of the QD-DNA sensor. See DOI: 10.1039/c0nr00462f/ |
| ‡ H. Y. Zhang and D. J. Zhou, unpublished results. We found that an MPA-capped CdTe core only QD synthesised by an aqueouse route in our laboratory (EM ∼530 nm, quantum yield ∼27%) completely lost its fluorescence using standard EDC/NHS activation in a phosphate buffer (20 mM phosphate, pH 6.0). |
| This journal is © The Royal Society of Chemistry 2011 |