Pore-scale modeling of two-phase transport in polymer electrolyte fuel cells—progress and perspective
Partha P.
Mukherjee†
*a,
Qinjun
Kang
a and
Chao-Yang
Wang
b
aLos Alamos National Laboratory, Los Alamos, NM, USA. E-mail: mukherjeepp@ornl.gov; Fax: +1-865-241-4811; Tel: +1-865-574-3647
bElectrochemical Engine Center (ECEC), Department of Mechanical and Nuclear Engineering, Pennsylvania State University, University Park, PA, USA
First published on 18th October 2010
Abstract
Recent years have witnessed an explosion of research and development efforts in the area of polymer electrolyte fuel cells (PEFC), perceived as the next generation clean energy source for automotive, portable and stationary applications. Despite significant progress, a pivotal performance/durability limitation in PEFCs centers on two-phase transport and mass transport loss originating from suboptimal liquid water transport and flooding phenomena. Liquid water blocks the porous pathways in the gas diffusion layer (GDL) and the catalyst layer (CL), thus hindering oxygen transport from the flow field to the electrochemically actives sites in the catalyst layer. Different approaches have been examined to model the underlying transport mechanisms in the PEFC with different levels of complexities. Due to the macroscopic nature, these two-phase models fail to resolve the underlying structural influence on the transport and performance. Mesoscopic modeling at the pore-scale offers great promise in elucidating the underlying structure-transport-performance interlinks in the PEFC porous components. In this article, a systematic review of the recent progress and prospects of pore-scale modeling in the context of two-phase transport in the PEFC is presented. Specifically, the efficacy of lattice Boltzmann (LB), pore morphology (PM) and pore network (PN) models coupled with realistic delineation of microstructures in fostering enhanced insight into the underlying liquid water transport in the PEFC GDL and CL is highlighted.
 Partha P. Mukherjee | Partha P. Mukherjee received his PhD in Mechanical Engineering from the Pennsylvania State University (PSU) in 2007, and is currently a Staff Scientist at Oak Ridge National Laboratory (ORNL). Before joining ORNL, he was a Director's Research Fellow at Los Alamos National Laboratory. He worked as a Consulting Engineer for 4 years in Fluent India Pvt. Ltd, a fully owned subsidiary of Ansys Inc., USA, prior to starting his Ph.D. studies at PSU in 2003. His research interests include transport and materials aspects of battery and fuel cell systems, physicochemical transport phenomena in porous media, mesoscopic modeling and virtual materials design. |
 Qinjun Kang | Qinjun Kang is a Staff Scientist in the Earth and Environmental Sciences Division at the Los Alamos National Laboratory. He received his PhD in Mechanical Engineering from The Johns Hopkins University in 2004. His current research focuses on pore scale modeling of multiphase flow and reactive transport in porous media, and on multi-scale modeling bridging pore and continuum scale models, with applications in a broad spectrum of energy and environmental research, including geological storage of carbon dioxide and nuclear wastes, fate and transport of underground contaminants, and transport phenomena in energy conversion devices, such as fuel cells and batteries. |
 Chao-Yang Wang | Dr Chao-Yang Wang received his PhD in Mechanical Engineering from the University of Iowa in 1994, and he is currently a Distinguished Professor of Mechanical and Chemical Engineering at the Pennsylvania State University. He has been the founding director of Penn State Electrochemical Engine Center (ECEC) since 1997. Dr Wang's research interests cover the transport, materials, and manufacturing aspects of batteries and fuel cells. |
Broader contextIn the current global initiative toward a sustainable energy future, fuel cells are being considered as a critical and enabling technology for clean energy conversion. Among the different types of fuel cells, the polymer electrolyte fuel cell (PEFC) has emerged as a promising power source for varied applications. A pivotal performance/durability limitation in PEFCs revolves around suboptimal liquid water transport and resulting flooding phenomena in the constituent porous components. In this perspective article, we provided a detail overview of the importance of pore-scale modeling techniques in elucidating the microstructure-transport-performance interlinks and the potential for improved design via transport phenomena optimization in PEFCs. |
1. Introduction
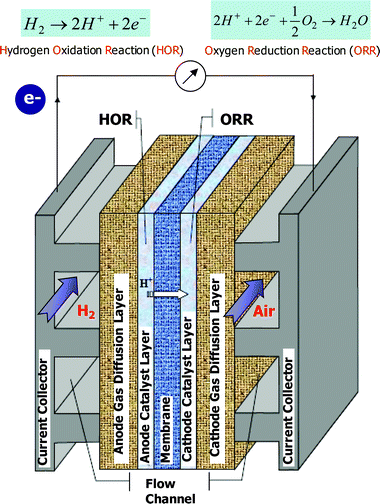
In the present scenario of a global quest toward a clean and sustainable energy future, fuel cells, owing to their high energy efficiency, environmental friendliness and minimal noise, are widely considered as the 21st century energy-conversion devices for automotive, stationary and portable power. Among the different types of fuel cells, the polymer electrolyte fuel cell (PEFC) has emerged as a promising power source for a wide range of applications.A typical PEFC, schematically shown in Fig. 1, exhibits a layered architecture and consists of the anode and cathode compartments, separated by a proton conducting polymeric membrane. The anode and cathode sides each includes gas channel, gas diffusion layer (GDL) and catalyst layer (CL). Usually, two thin catalyst layers are coated on both sides of the membrane, forming a membrane-electrode assembly (MEA). Humidified hydrogen comprises the anode feed, whereas humidified air is fed into the cathode. Hydrogen and oxygen combine electrochemically within the active catalyst layers to produce electricity, water and waste heat. The gas diffusion layer allows the transport of reactants to and products out from the reaction sites and also conducts electrons and heat. Gottesfeld and Zawodzinski1 provided a comprehensive overview of the PEFC function and operation. The hydrogen oxidation reaction (HOR) occurring at the anode catalyst layer has orders of magnitude higher reaction rate than the oxygen oxidation reaction (ORR) in the cathode catalyst layer. The ORR is therefore a potential source of large voltage loss and hence the cathode catalyst layer is the electrode of primary importance in a PEFC. Due to the acid nature of the polymer membrane and low-temperature operation, Pt or Pt-alloys are the best-known catalysts for PEFCs.
The performance of a PEFC is characterized by the polarization curve giving the relation between cell voltage and current density. Fig. 2 shows a typical polarization curve for a PEFC with three distinct voltage loss regimes. At low current density operation, the voltages loss is primarily due to the sluggish ORR at the cathode catalyst layer and is referred to as the “kinetic loss” or “activation loss”. At intermediate current densities, the voltage loss characterized by resistance to ion transport in the polymer electrolyte membrane and the catalyst layers dominates and is known as “ohmic loss”. At high current density operation, “mass transport limitations” come into play due to the excessive liquid water build up mainly in the cathode side. Liquid water blocks the porous pathways in the CL and GDL thus causing hindered oxygen transport to the reaction sites as well as covers the electrochemically active sites in the CL thereby increasing surface overpotential. This phenomenon is known as “flooding” and is perceived as the primary mechanism leading to the limiting current behavior in the cell performance.
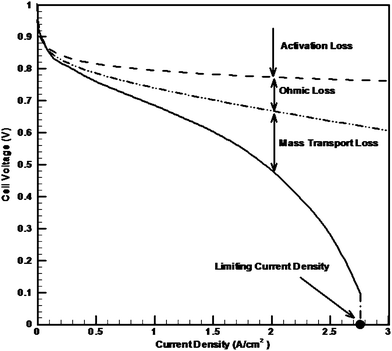 | ||
| Fig. 2 Typical polarization curve of a PEFC. | ||
Despite tremendous recent progress in enhancing the overall cell performance, a pivotal performance/durability limitation in PEFCs centers on liquid water transport and resulting flooding in the constituent components.2–4 The catalyst layer and gas diffusion layer, therefore, play a crucial role in the PEFC water management aimed at maintaining a delicate balance between reactant transport from the gas channels and water removal from the electrochemically active sites.
Water management research has received wide attention in recent years, as evidenced by the development of several macroscopic computational models5–19 and visualization techniques20–31 for liquid water transport in PEFCs. Comprehensive overview of the various PEFC models is furnished by Wang3 and Weber and Newman.4 The macroscopic models, reported in the literature, are based on the theory of volume averaging and treat the catalyst layer and gas diffusion layer as macrohomogeneous porous layers. Due to the macroscopic nature, the current models fail to resolve the influence of the structural morphology of the CL and GDL on the underlying two-phase dynamics. Additionally, there is serious scarcity of two-phase correlations, namely capillary pressure and relative permeability as functions of liquid water saturation, as constitutive closure relations for the two-phase PEFC models tailored specifically for the CL and GDL microstructures. Current two-phase fuel cell models often employ a capillary pressure – saturation relation for modeling liquid water transport in hydrophobic gas diffusion media adapted by Pasaogullari and Wang6 and Nam and Kaviany16 from Udell's work32 in the form of Leverett-J function.33 Very recently few attempts to experimentally evaluate the capillary pressure for the PEFC GDL have been reported in the literature,34–37 while the CL still remains experimentally intractable. Furthermore, experimental efforts to measure relative permeability for both GDL and CL, a more important parameter for two-phase transport than capillary pressure, are still exceedingly difficult. Most recently, Hussaini and Wang38,39 have reported the measurement of relative permeability as a function of liquid water saturation for the PEFC GDL. In addition, in the macroscopic two-phase fuel cell models, the site coverage effect in the CL and the pore blockage effect in the CL and GDL owing to liquid water are taken into account through an electrochemically active area reduction model and the Bruggeman type correction for the effective oxygen diffusivity, respectively. These two empirical correlations cannot be separately discerned through experimental techniques. Despite substantial research, both theoretical and experimental, there is serious paucity of fundamental understanding regarding the overall structure-transport-performance interactions and underlying two-phase dynamics in the catalyst layer and the gas diffusion layer.
Mesoscopic modeling, which combines the porous media microstructure and the underlying transport phenomena, is particularly promising in unveiling the structure-transport interactions at the pore-scale. This paper presents a systematic review of the recent efforts in mesoscopic modeling at the pore-scale in order to gain fundamental insight into two-phase transport and flooding behavior in PEFCs.
2. Pore-scale modeling
Pore-scale models for solving multiphase flow and transport through porous media can be broadly classified into rule-based and first-principle-based models.40Rule-based models try to capture physical processes by incorporating adequate physics on top of an idealized network representation of the porous medium. Percolation models, diffusion-limited aggregation (DLA) models and anti-DLA models belong to this category. Such models, based on diluted physical description, nonetheless provide useful predictions of the transport properties of a given medium or network. Simulations based on these models are generally faster since there is no need to solve large systems of equations. The most prominent among these rule-based models is the pore-network (PN) modeling approach. In the PN models, a porous medium is represented by a lattice of wide pores connected by narrower constrictions called throats. The original PN model is credited to the pioneering works by Fatt,41–43 who computed capillary pressure and relative permeability in a network of interconnected pores. Since then, the PN model has continued to incorporate multi-physicochemical processes, physically-realistic and topologically-equivalent pore-network structures to study a variety of processes in porous media, including, dispersion,44 two-phase relations,45,46 three-phase displacement,47,48 reactive transport,49–51 heat transfer,52 drying,53,54CO2 sequestration55 to name a few. While the PN models were primarily developed to address flows in low-porosity and low-permeability geologic porous media, Thompson56 expanded the applicability to high-porosity and high-permeability fibrous media. Recent efforts in advancing the PN models also include extraction of realistic network representations57–61 corresponding to actual porous media morphologies using experimental imaging and mathematical morphology analysis. However, majority of the PN models still rely on simplified idealized network delineations of the porous media, e.g. spherical pores connected by cylindrical throats.
Unlike the rule-based approaches, the first-principle-based methods resolve the underlying transport processes by solving the governing equations, namely the Navier–Stokes (NS) equations. The governing equations can be solved by employing either the fine-scale conventional computational fluid dynamics (CFD) methods, the so-called “top-down approach” or by the coarse-grain approach i.e. the “bottom-up” approach, shown schematically in Fig. 3.62 The molecular dynamics (MD), lattice gas (LG) and, lattice Boltzmann (LB) methods fall under the “bottom-up” approach category. With a given set of suitable boundary conditions, the governing differential equations can be properly discretized on a computational grid using standard CFD techniques, namely finite difference, finite volume or finite element methods. However, the lack of versatility of implementing the boundary conditions for arbitrary grain shapes precludes the application of CFD methods in a porous medium involving two-phase flow. Even though several CFD-based two-phase models, such as front-capturing63–66 and front-tracking67,68 approaches have been developed, the applicability of fine-scale CFD yet remains a challenge to simulate two-phase flow in complex porous media. On the other hand, molecular dynamics approach69,70 takes into account the movements and collisions of all individual molecules constituting the fluid with detail description of the inter-molecular interactions and thereby providing realistic equations of state characterizing the real fluid. However, the complexity of interactions as well as the number of molecules representative of the actual fluid make the molecular dynamics models computationally prohibitive for application to macroscopic flows in porous media.
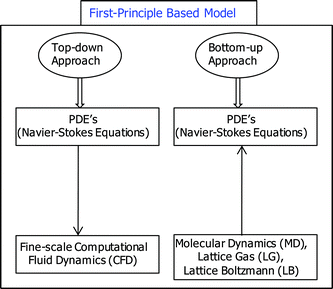 | ||
| Fig. 3 Top-down and bottom-up numerical approach. | ||
The Lattice Boltzmann method, instead of tracking all the individual molecules, considers the behavior of a collection of particles, comprised of large number of molecules, moving on a regular lattice, thereby reducing the degrees of freedom of the system and making the pore-scale simulation computationally tractable. Owing to its numerical stability and constitutive versatility, the LB method has developed into a powerful technique for simulating complex flows in recent years.71 Unlike the conventional Navier–Stokes solvers based on the discretization of the macroscopic continuum equations, LB methods consider flows to be composed of a collection of pseudo-particles residing on the nodes of an underlying lattice structure which interact according to a velocity distribution function. The lattice Boltzmann method is an ideal scale-bridging numerical scheme which incorporates simplified kinetic models to capture microscopic or mesoscopic flow physics and yet the macroscopic averaged quantities satisfy the desired macroscopic equations.71 Due to its underlying kinetic nature, the LB method has been found to be particularly useful in fluid flow applications involving interfacial dynamics and complex boundaries, e.g. multiphase or multicomponent flows in porous medium. As opposed to the front-tracking and front-capturing multiphase models in traditional CFD, due to its kinetic nature, the LB model incorporates phase segregation and surface tension in multiphase flows through interparticle force/interactions, which are difficult to implement in traditional methods. Therefore, compared to the conventional CFD methods, the LB modeling approach better represents the pore morphology of the actual porous medium and incorporates more rigorous physical description of the flow processes. Although in some cases it is computationally more demanding, this can be compensated by high performance computing, since the LB algorithm is inherently parallel. Several two-phase LB models have been presented in the literature. The first immiscible multiphase LB model proposed by Gunstensen et al.72 uses red- and blue- colored particles to represent two kinds of fluids. The phase separation is then produced by the repulsive interaction based on the color gradient and color momentum. The model proposed by Shan and Chen73,74 imposes a non-local interaction between fluid particles at neighboring lattice sites. The interaction potentials control the form of the equation of state (EOS) of the fluid. Phase separation occurs automatically when the interaction potentials are properly chosen. The free-energy based approach proposed by Swift et al.75,76 relies on the description of non-equilibrium dynamics, such as Cahn-Hilliard's approach. The free energy model has a sound physical basis, and, unlike the S–C model, the local momentum conservation is satisfied. However, this model does not satisfy Galilean invariance leading to unphysical effects in the simulation.77 In the multiphase model proposed by He, Chen and Zhang,78,79 two sets of probability distribution functions (PDF) are employed. The first PDF set is used to simulate pressure and velocity fields and another PDF set is used to capture the interface only, which makes this approach essentially close to the interface capturing methods in spirit. This approach is thermodynamically more consistent, however shows numerical instability. Among the afore-mentioned two-phase LB models, the S–C model is widely used80–85 due to its simplicity in implementing boundary conditions in complex porous structures, versatility in terms of handling fluid phases with different densities, viscosities and wettabilities, as well as the capability of incorporating different equations of state. Recent advancements in LBM include modeling of multicomponent, reactive transport (chemical reaction) phenomena leading to the evolution of porous microstructure86–88 and poroelastic behavior to study genesis and propagation of fractures, pore wall rugosity, and morphological change due to the coupling between applied stress and fluid pressure89,90 in subsurface porous media.
Another type of pore-scale model is the pore morphology (PM) approach91,92 based on the mathematical morphology analysis of the digital representation of an actual porous medium. The PM model aims to link the macroscopic measures of a porous medium, e.g. capillary pressure - saturation relation, to an accurate representation of the porous medium through direct input of the morphological information. This heuristic approach is credited to the original work by Hazlett91 for simulating quasi-static two-phase flow based upon a size and connectivity analysis of the digital pore space. Hilpert and Miller92 extended this method to account for the accurate porous medium morphology for quasi-static drainage in water-wet porous media using concepts from mathematical morphology to obtain the fluid distributions. This approach of quasi-static fluid phase distributions by Hilpert and Miller92 relies on the discretization of the pore space by a set of voxels residing on a cubic lattice and the simulated fluids are both represented by voxels. The interfacial area represented by a set of voxels is slightly over-estimated and the pore-space voxelization renders the simulated capillary pressures to assume discrete values.92,93 In a recent paper, Adalsteinsson and Hilpert94 further extended the PM model, which does not treat the solid phase and the pore space as voxels but rather as a discretization of an underlying continuous representation for drainage simulation. The pore morphology model is computationally very attractive and yields reasonable agreement with experimental data.92 This approach can be perceived as a middle ground between the computationally intensive LB model and the idealized pore morphology based PN model, especially for quasi-static flows in complex porous media.
The afore-mentioned pore-scale modeling approaches offer excellent versatility in the fundamental investigation of transport phenomena owing to the detailed information available at the microscopic scale. Specifically, pore-scale modeling shows tremendous prospect in the following aspects.
➢ Pore-scale modeling provides unique opportunities to understand the underlying processes, e.g. multiphase dynamics occurring within the complex porous structure, which are still unknown due to the scarcity of the viable experimental methods as well as the difficulty to predict the inherent structure-performance dependence;
➢ Pore-level simulation tool offers excellent flexibility in designing numerical experiments conforming to the experimental operating conditions in order to evaluate constitutive closure relations, e.g. two-phase correlations in terms of capillary pressure and relative permeability as functions of saturation, which are otherwise difficult to obtain by laboratory experiments.
Recent advances in microstructure generation techniques, allowing accurate representation of the underlying pore-morphology, and quantum jump in computational power are the major proponents in the explosion of interest in predictive pore-scale modeling. Suffice to say that the pore-scale modeling caters to the mesoscopic modeling framework, which includes the effects of the pore morphology and mesoscale physics on the macroscopic transport behavior.
In this paper, different pore-scale modeling techniques are discussed with the objective to understand the structure-wettability influence on the underlying two-phase dynamics in the PEFC catalyst layer and gas diffusion layer.
3. Microstructure generation
Detailed description of a porous microstructure is an essential prerequisite to pore-scale modeling. The 3-D volume data of a porous sample can be obtained either by experimental imaging or by stochastic simulation method. Several experimental techniques can be deployed to image the pore structure in three dimensions. Earlier attempts include destructive serial sectioning95,96 of pore casts to reconstruct the complex pore space. Recently, non-invasive techniques such as X-ray microtomography,97 magnetic resonance imaging98 and confocal microscopy99 are the preferred choices over the earlier destructive methods. Additionally, 3-D porous structure can be generated using stochastic simulation technique, originally developed by Joshi100 in two dimensions and later extended to three dimensions by Quiblier.101 The stochastic reconstruction method creates 3-D replicas of the microstructure based on specified statistical information (e.g. porosity, two-point correlation function) of a porous sample. Adler and Thovert102 and Torquato103 provided comprehensive overviews of the stochastic reconstruction techniques along with statistical description of porous microstructures. The low cost and high speed of data generation make the stochastic generation methods an attractive alternative and often a preferred choice over the experimental imaging techniques. In the following sections, the generation of the PEFC catalyst layer and gas diffusion layer microstructures is discussed.3.1. Catalyst layer microstructure
For the electrochemical reaction to occur, the state-of-the-art catalyst layer of a PEFC is a three-phase composite comprising of: (1) ionomer, i.e. the ionic phase which is typically Nafion® to provide a passage for protons to be transported in or out, (2) Pt catalysts supported on carbon (C-Pt) i.e. the electronic phase for electron conduction, and (3) pores for the reactant to be transferred in and product water out. Fig. 4 shows a high resolution transmission electron microscope (TEM) image of a conventional PEFC CL104 with the three-phase interface. The CL, being only 10–15 μm thick and owing to the resolution constraints of the state-of-art computed microtomography techniques (e.g. 1–5 μm per voxel), the stochastic reconstruction method is as yet the only viable technique for the PEFC CL microstructure generation.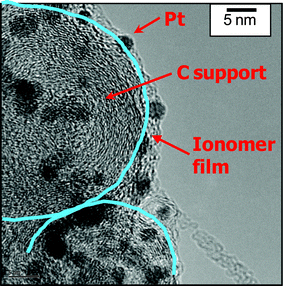 | ||
| Fig. 4 High resolution TEM image of a PEFC catalyst layer microstructure.104 | ||
Mukherjee and Wang105 were the first to reconstruct a 3-D realization of the PEFC CL microstructure using the stochastic generation method with porosity and two-point autocorrelation function as the input statistical parameters. This method is based on the stochastic simulation method reported by Adler et al.106,107 and Bentz and Martys.108 In brief, the stochastic reconstruction method is based on the idea that an arbitrarily complex porous structure can be described by a binary phase function which assumes a value 0 in the pore space and 1 in the solid matrix. The porosity is the probability that a voxel is in the pore space. The two-point autocorrelation function is the probability that two voxels at a specific distance are both in the pore space. The catalyst layer was delineated as a two-phase (pore/solid) structure consisting of the gas phase (i.e. the void space) and a mixed electrolyte/electronic phase (i.e. the solid matrix). This assumption was due to the unavailability of high resolution 2-D CL micrographs with distinct delineation of the constituent three phases (C-Pt, ionomer and pore) in order to evaluate the corresponding dual phase autocorrelation functions. The mixed electrolyte/electronic phase assumption is however well justified from the perspective of ion transport in the electrolyte phase as the limiting mechanism as compared to the electron conduction via the electronic (C-Pt) phase within the CL.105 The stochastic simulation method starts with a Gaussian distribution which is filtered with the two-point autocorrelation function and finally thresholded with the porosity, which creates the 3-D realization of the CL structure. The autocorrelation function is computed from a 2-D TEM image of an actual CL based on the image processing technique originally proposed by Berryman.109 The porosity is evaluated by converting the mass loading data of the constituent components available from the CL fabrication process.110 Details about the Gaussian field stochastic reconstruction method for the CL microstructure generation are elaborated by Mukherjee and Wang.105 This reconstruction method was further extended for the generation of bi-layer CL structures with varying pore and electrolyte volume fractions by Mukherjee and Wang.111Fig. 5 shows the reconstructed microstructure of a typical catalyst coated membrane (CCM) CL with nominal porosity of 60% and thickness of 10 μm along with the input TEM image and the evaluated cross-section averaged pore and electrolyte phase volume fraction distributions across the CL thickness.105 The cross-section averaged pore/electrolyte volume fraction distribution illustrates the local tortuosity variation along the electrode thickness.
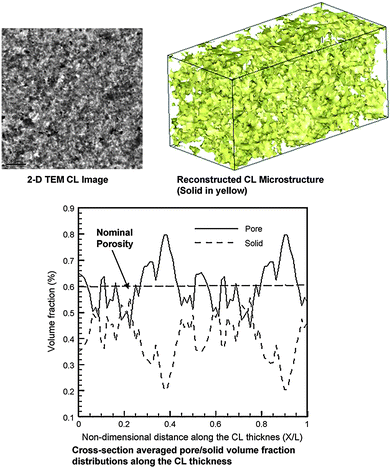 | ||
| Fig. 5 Reconstructed catalyst layer microstructure along with pore and electrolyte phase volume fractions distribution.105 | ||
Rong and co-workers112 later utilized the afore-mentioned reconstruction method to genarate 2-D realizations of the CL microstructure with three-phase description using different autocorrelation functions for C-Pt/pore and ionomer/pore combinations. Recently, Kim and Pitsch113 developed the simulated annealing reconstruction method, based on the original work by Yeong and Torquato,114 for the CL microstructure generation. In the simulated annealing method,114 a digitized representation of a porous medium is used and a continuous interchange of voxels is performed to find a minimum energy state. Energy of a system is defined as the sum of the square difference of the correlation functions for the reference and reconstructed systems.113,114 The simulated annealing method offers flexibility in terms of incorporating higher order statistical moments (e.g. second-order surface correlation) for reconstruction.103 Kim and Pitsch,113 in their work, considered a sphere-based simulated annealing algorithm with two-point autocorrelation function (first-order statistical moment) as input. The model starts with a reference two-point autocorrelation function and adjusts it subsequently till the reconstructed microstructure attains the desired macroscopic feature, e.g.pore size distribution (PSD). The reconstructed 3-D CL includes a thin layer of ionomer phase evenly distributed around the C-Pt spherical agglomerates. Fig. 6 shows a 3-D reconstructed CL microstructure from the sphere-based simulated annealing method along with the predicted PSD.113
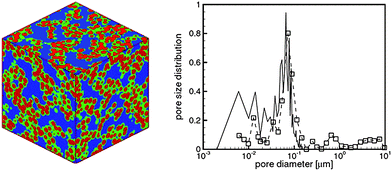 | ||
| Fig. 6 Reconstructed catalyst layer microstructure along with pore size distribution by the sphere based simulated annealing method.113 | ||
3.2. Gas diffusion layer microstructure
The multi-faceted functionality of a GDL includes reactant distribution, liquid water transport, electron transport, heat conduction and mechanical support to the membrane-electrode-assembly. Carbon-fiber based porous materials, namely non-woven carbon paper and woven carbon cloth with thickness ∼200–300 μm, have received wide acceptance as materials of choice for the PEFC GDL owing to high porosity (∼70% or higher) and good electrical/thermal conductivity. Mathias et al.115 provided a comprehensive overview of the GDL structure and functions.Schulz and co-workers116 were the first to develop a stochastic simulation technique to reconstruct 3-D realization of the non-woven carbon paper GDL based on structural inputs, namely fiber diameter, fiber orientation and porosity which can be obtained either directly from the fabrication specifications or indirectly from the SEM (scanning electron microscope) micrographs or by experimental techniques. The GDL microstructure reconstruction is based on the non-woven structure generation technique originally proposed by Schladitz et al.117 The specific assumptions made in the non-woven GDL reconstruction method, which are well justified by inspecting the corresponding carbon paper GDL SEM micrographs, include:117 (1) the fibers are long compared to the sample size and their crimp is negligible; (2) the interaction between the fibers can be neglected, i.e., the fibers are allowed to overlap; and (3) the fiber system, owing to the fabrication process, is macroscopically homogeneous and isotropic in the material plane, defined as the xy plane. With these assumptions, the stochastic reconstruction technique is adequately described as a Poisson line process with one-parametric directional distribution where the fibers are realized as circular cylinders with a given diameter and the directional distribution provides in-plane/through-plane anisotropy in the reconstructed GDL microstructure.116Fig. 7 shows the reconstructed microstructure of a typical non-woven, carbon paper GDL116 with porosity around 72% and thickness of 180 μm along with the structural parameters in terms of the estimated pore size distribution and the anisotropy in the in-plane vs. through-plane permeability values. Wiegmann and co-workers118 have also extended the reconstruction formalism for woven microstructures generation with fiber bundle dimensions and pleat waviness as inputs. Fig. 8 shows a representative 3D reconstructed woven carbon cloth GDL microstructure as originally highlighted in the work by Mukherjee et al.119 Inoue et al.120 have used a stochastic reconstruction method similar to that by Schulz et al.116 and presented the evaluation of pore size distribution, permeability and tortusoity of simulated carbon paper GDL microstructures.
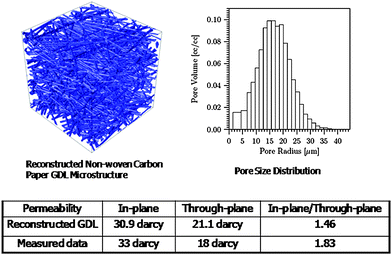 | ||
| Fig. 7 Reconstructed non-woven carbon paper GDL microstructure along with the evaluated structural properties.116 | ||
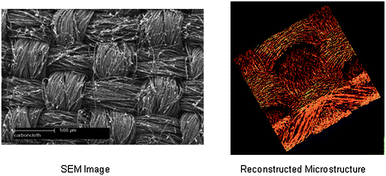 | ||
| Fig. 8 SEM micrograph and 3-D reconstructed microstructure of a woven carbon cloth GDL.119 | ||
In another effort, Thiedmann et al.121 reported a stochastic reconstruction method, which is similar in spirit to the method by Schulz et al.,116 to generate 3-D non-woven carbon paper GDL microstructures. This model relies on stacking thin sections of fiber layers with each fiber approximated by a straight cylinder. The thin sections of the GDL are represented by planar random line tessellations, which are built by intersecting lines located at random in the material plane.121 These lines are dilated in 3-D, and each dilated line tessellation represents a thin fiber-layer section. Finally, a certain number of such dilated line tessellations are stacked together to generate the 3-D GDL microstructure. The segmentation of thin section from SEM images mimics the anisotropy in the in-plane direction and builds into the 3-D structure from the stacking of thin fiber layers. In the model by Schulz et al.,116 the anisotropy parameter is adjusted to achieve the desired in-plane vs. through-plane anisotropy. Thiedmann et al.121 also incorporated the binder material in the reconstructed GDL microstructure. The fibers of the GDL are adhered by means of a binder, which is introduced in the manufacturing process and can be recognized in the SEM images as thin films. They have considered two variants of binder filling: (1) as thin horizontal films filling the area among fiber entangles, known as Bernoulli filling; and (2) as spherical filling the pores. The sphere filling method is, however, a gross approximation of the binder filling. The Bernoulli filling also creates large blockage of horizontal fiber thin sections, which is otherwise not observed in SEM images. Schulz et al.,122 in a predecessor paper, included the binder in the GDL microstructure via capillary filling concept, where the binder is considered as a hydrophilic fluid which fills the two-fiber intersections based on the overall binder volume fraction, which is generally very low. Fig. 9 shows the reconstructed 3-D GDL microstructures with binder from these works.121,122 Thiedmann et al.123 in a recent follow-up paper also presented the evaluation of the microstructure characteristics (e.g., tortusosity, pore size and connectivity) of simulated and experimentally imaged 3D non-woven GDL structures.
Pore size distribution (PSD) can be evaluated by repeatedly probing the reconstructed microstructure with spheres of increasing radii, as explained by Schulz et al.116 Thiedmann et al.123 employed a 3-D graph representation of the pore space. The pore size (radius) is the largest spherical distance of a pore center (vertex in the graph representation) to the solid phase. The PSD is evaluated by taking into account only the largest pores belonging to the respective pore centers for varying radii (spherical distance).123
Recent efforts also include 3-D experimental imaging of the PEFC GDL microstructure using X-Ray computed tomography. Garzon and co-workers124 have recently demonstrated the reconstruction of 3-D GDL non-woven and woven microstructures using X-Ray microtomography. Ostadi et al.125,126 also reported their preliminary attempts of the X-Ray tomography reconstruction of the woven carbon cloth and non-woven carbon paper GDL microstructures. Becker et al.127,128 used 3-D tomography non-woven carbon paper GDL microstructures for the evaluation of the intrinsic microstructural parameters, namely permeability, diffusivity and thermal conductivity. Fig. 10 shows representative 3-D GDL carbon paper microstructures with and without microporous layer (MPL) using X-Ray microtomography.124 Berenjov et al.129 demonstrated an inexpensive optical reconstruction of the carbon paper GDL structure using a standard bright-field microscope. Most recently, Mukherjee and co-workers130,131 have presented 3-D reconstruction of non-woven GDL microstructures using digital volume imaging (DVI), which is a block-face fluorescence imaging technique.132,133 In this technique, the porous sample, embedded in a polymeric resin, is repeatedly sectioned and imaged.132,133 These 2-D cross-sectional images are then combined to reconstruct the 3-D microstructure. Unlike the conventional laborious serial sectioning methods, serial sectioning in DVI is fully automated. The DVI technique is a destructive imaging method as opposed to the non-invasive X-Ray tomography method. However, the 3-D image obtained from the DVI technique is envisioned to provide meaningful microstructural information for inputs into high-fidelity direct numerical simulation methods for two-phase transport. It is worth mentioning that these recent efforts in generating 3D microstructures using experimental imaging show great promise toward more realistic structural delineation and pore-scale modeling of two-phase transport in the PEFC GDLs.
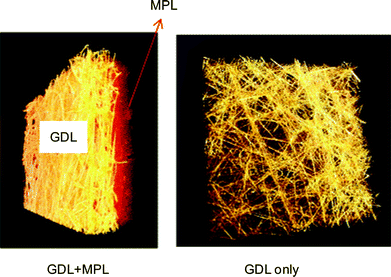 | ||
| Fig. 10 Nonwoven carbon paper GDL microstructure using X-Ray tomography.131 | ||
4. Two-phase transport in the PEFC CL and GDL
Surface forces become dominant as compared to the gravity, viscous and inertia forces for two-phase flow through the porous catalyst layer and the fibrous gas diffusion layer in a PEFC, characterized by significantly small pore size, e.g. ∼0.1 μm in the CL and ∼20 μm in the GDL. A simple estimate of the values of the non-dimensional numbers governing the underlying transport in the PEFC CL could further emphasize the importance of the surface forces;U2 and μ2 are the non-wetting phase velocity and dynamic viscosity respectively; σ is the surface tension and g is the gravitational acceleration. Similarly, the afore-mentioned non-dimensional parameters exhibit significantly low values in the GDL within comparable order of magnitude variations. In this article, the non-wetting phase is identified with subscript 2 and the wetting phase with 1. From the Bond number, defined as the ratio of gravitational force to the surface tension force, it is evident that the effect of gravity is negligible with respect to the surface tension force, thus indicating strong capillary force dominance. Also within PEFC electrodes, velocity, U2 is significantly small. Now, from the Reynolds number, representing the ratio of inertia force to viscous force, it is obvious that the inertial effect is negligible, as compared to the viscous force. Combining the implications of low Reynolds and Bond numbers, it can be inferred that the density difference, which is ∼1000 for air–water two-phase flow for the PEFC operation, should have negligible influence on the overall transport in the CL and GDL. Now, from the Capillary number, Ca, which represents the ratio of viscous force to the surface tension force, it can be observed that the effect of viscous force is also negligible as compared to the surface tension force. Apart from these non-dimensional numbers, the Weber number, (We), defining the ratio of inertial force to the surface tension force, which is also a product of Re and Ca, emphasizes the fact that the effects of inertia and viscous forces are truly insignificant as compared to the surface tension force representative of two-phase transport in the PEFC CL and GDL. It should be noted that the viscosity ratio for the non-wetting and wetting phases in a fuel cell operating at 80 °C is estimated to be, M = μ2/μ1 ∼ 18. Based on the calculated representative viscosity ratio and capillary number values, the typical operating two-phase regime for the CL and GDL belongs to the capillary fingering zone on the “phase diagram” proposed by Lenormand et al.,125 and is shown in Fig. 11. The notion of the “phase diagram”, proposed by Lenormand et al.,134 is based on their experiment, involving immiscible displacement of a wetting phase by a non-wetting phase, in a flat and horizontal porous medium where gravity forces were neglected. This phase diagram further bolsters the hypothesis that for air–water two-phase flow in the CL and GDL of a PEFC, the viscous forces are truly negligible and the principal force is owing to the action of capillarity, which would consequently lead to capillary fingering type displacement pattern. Viscous fingering pattern is observed at low viscosity ratio (M), where the principal force is the viscous force of the resident fluid and the capillary force and pressure drop in the displacing fluid can be neglected. In the stable displacement flow regime, representative of high M and high Ca, the principal force is due to the viscosity of the displacing fluid and capillary effects in the resident fluid are negligible. Typical fluid displacement patterns pertaining to the three flow regimes are also shown in Fig. 11 along with the phase diagram and are adapted from the work by Ewing and Berkowitz,135 The effect of gravity force in the overall fuel cell system, let alone in the porous catalyst layer and gas diffusion layer, has also been shown to be truly insignificant.20 Most recently, Medici and Allen136 experimentally characterized air/water two-phase behavior in the non-woven carbon paper GDL for different combinations of capillary number and viscosity ratio corresponding to the drainage phase diagram134 in an ex situ setup. They emphasized the existence of capillary fingering owing to the low capillary number and transition toward stable displacement pattern at higher saturation in the PEFC GDL.
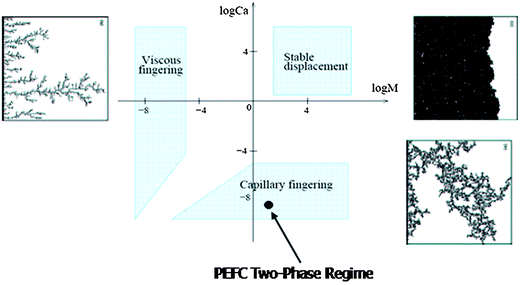 | ||
| Fig. 11 Phase diagram along with fluid displacement patterns.119 | ||
5. Lattice Boltzmann modeling
The interaction-potential based two-phase lattice Boltzmann model (LBM) by Shan and Chen,73,74 henceforth referred to as the S–C model, has been primarily deployed in the PEFC research.5.1. Methodology
In brief, the S–C model73,74 introduces k distribution functions for a fluid mixture comprising of k components. Each distribution function represents a fluid component and satisfies the evolution equation. The non-local interaction between particles at neighboring lattice sites is included in the kinetics through a set of potentials. The evolution equation for the kth component can be written as: | (1) |
The continuity and momentum equations can be obtained for the fluid mixture as a single fluid using Chapman-Enskog expansion procedure in the nearly incompressible limit:
 | (2) |
 | (3) |
5.2. Two-phase simulation studies
Mukherjee and co-workers119,139,140 deployed the S–C LBM to study two-phase transport and flooding behavior in the PEFC CL and GDL. The CL and GDL microstructures were reconstructed using stochastic simulation techniques developed in ref. 105 and 116, respectively. This study focused on understanding the structure-wettability-transport interactions in the PEFC CL and GDL in the low Capillary number (Ca) regime. Details can be found in ref. 139, 140.Fig. 12 displays the steady state invading liquid water fronts corresponding to increasing capillary pressures from the primary drainage simulation in the reconstructed CL microstructure characterized by slightly hydrophobic wetting characteristics with a static contact angle of 100°, as reported in ref. 140. Primary drainage141 refers to the displacement of a wetting fluid by an invading non-wetting fluid. At lower capillary pressures, the liquid water saturation front exhibits finger like pattern, similar to the displacement pattern observed typically in the capillary fingering regime. The displacing liquid water phase penetrates into the body of the resident wetting phase (i.e. air) in the shape of fingers owing to the surface tension driven capillary force. However, at high saturation levels, the invading non-wetting phase tends to exhibit a somewhat flat advancing front. This observation, as highlighted in Fig. 12(b), indicates that with increasing capillary pressure, even at very low Capillary number, several penetrating saturation fronts tend to merge and form a stable front. The invasion pattern transitions from the capillary fingering regime to the stable displacement regime and potentially lies in the transition zone in between. In an operating fuel cell, the resulting liquid water displacement pattern pertaining to the underlying pore-morphology and wetting characteristics would play a vital role in the transport of the liquid water and hence the overall flooding behavior.
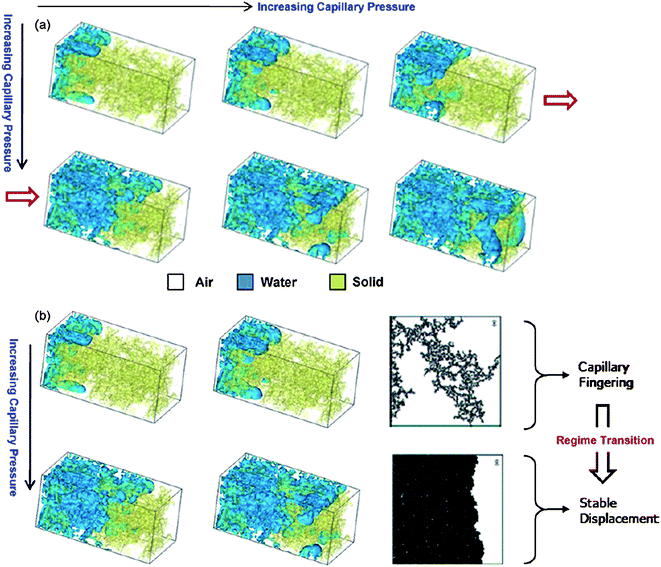 | ||
| Fig. 12 Advancing liquid water front with increasing capillary pressure through the initially air-saturated reconstructed CL microstructure from the primary drainage simulation using LBM.140 | ||
Fig. 13 shows the liquid water distribution as well as the invasion pattern from the primary drainage simulation with increasing capillary pressure in the initially air-saturated reconstructed carbon paper GDL characterized by hydrophobic wetting characteristics with a static contact angle of 140° from the LBM work by Mukherjee et al.140 The reconstructed GDL structure used in the two-phase simulation consists of 100 × 100 × 100 lattice points in order to manage the computational overhead to a reasonable level. At the initially very low capillary pressure, the invading front overcomes the barrier pressure only at some preferential locations depending upon the pore size along with the emergence of droplets owing to strong hydrophobicity. As the capillary pressure increases, several liquid water fronts start to penetrate into the air occupied domain. Further increase in capillary pressure exhibits growth of droplets at two invasion fronts, followed by the coalescence of the drops and collapsing into a single front. This newly formed front then invades into the less tortuous in-plane direction. Additionally, emergence of tiny droplets and subsequent growth can be observed in the constricted pores in the vicinity of the inlet region primarily due to strong wall adhesion forces from interactions with highly hydrophobic fibers with the increasing capillary pressure. One of the several invading fronts finally reaches the air reservoir, physically the GDL/channel interface, at a preferential location corresponding to the capillary pressure and is also referred to as the bubble point. It is worth mentioning that the LB simulation is indeed able to capture the intricate liquid water dynamics including droplet interactions, flooding front formation and propagation through the hydrophobic fibrous GDL structure.
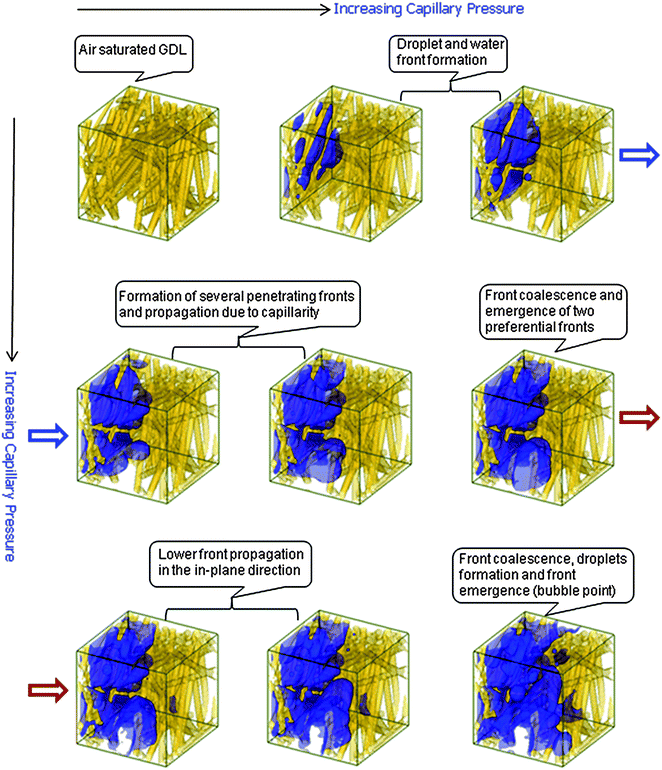 | ||
| Fig. 13 Advancing liquid water front with increasing capillary pressure through the initially air-saturated reconstructed GDL microstructure from the primary drainage simulation using LBM.140 | ||
In another effort, Mukherjee and Wang,139,142,143 studied the effects of liquid water on the catalytic site coverage and pore blockage, which otherwise cannot be discerned separately via experiments, in the PEFC CL. They used the two-phase S–C LBM to study the liquid water site coverage and pore blockage effects in a reconstructed CL microstructure and also evaluated the relative permeability relation as a function of liquid water saturation. They demonstrated that these two-phase relations can be incorporated into macroscopic two-phase computational fuel cell models in order to capture the polarization behavior of the CL in the mass transport control regime. Fig. 14 displays the two-phase distributions from the LBM simulations along with the catalytic site coverage, pore blockage and relative permeability relations as functions of liquid water saturation. In this work, the effect of electrochemical reaction is not considered explicitly. Liquid water, generated owing to the electrochemical reaction, manifests in terms of liquid water saturation distribution in the porous catalyst layer microstructure, leading to the pore blockage and surface coverage effects. In this regard, it is important to mention that the direct numerical simulation (DNS) modeling of electrochemically reactive transport in the CL microstructure at the pore-scale was first demonstrated by Mukherjee and Wang.105 This electrochemistry coupled DNS model is a fine-scale CFD (“top-down”) approach, which solves the species (oxygen and water vapor) and charge transport equations along with interfacial electrochemical reaction directly in the CL microstructure within a single-domain finite volume modeling (FVM) framework. The DNS model provides the 3-D spatial distribution of the reaction current in the CL and is ideally suited for composition optimization (e.g. functionally graded structure with pore and electrolyte volume fractions distribution).105,111 However, the DNS model doesn't include the effect of two-phase transport. Additionally, notable recent efforts in pore-scale multicomponent, reactive (chemical reaction) transport modeling in porous media in subsurface environments include lattice Boltzmann modeling by Kang et al.86–88 and pore network modeling by Celia and co-workers.50,51 However, none of these pore-scale models (e.g. electrochemistry coupled DNS model, chemically reactive LBM and PNM formalisms) include multiphase transport.
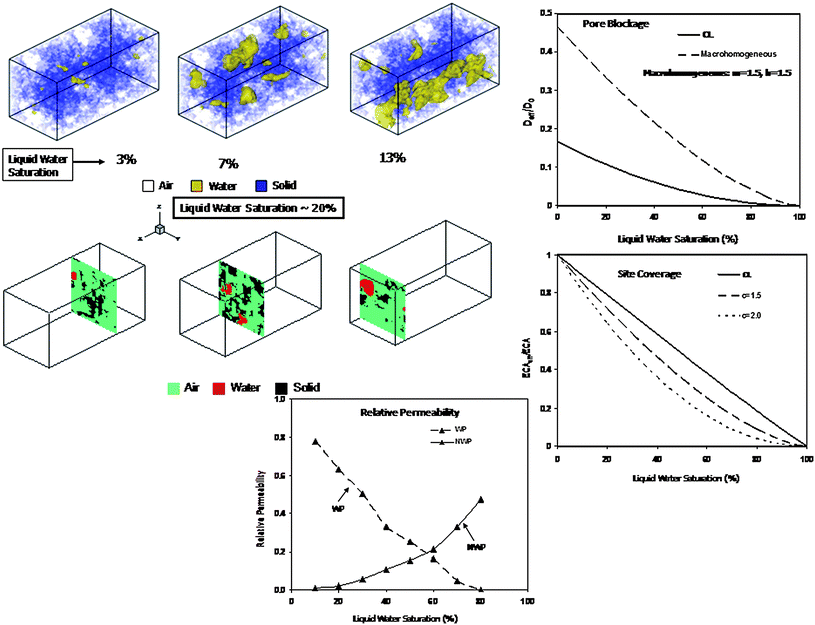 | ||
| Fig. 14 Two-phase distributions, pore blockage, site coverage and relative permeability relations from two-phase LBM simulation in the PEFC CL.139,142 | ||
Mukherjee et al.144 also recently studied the influence of compression induced microstructural change on the underlying two-phase transport and flooding behavior in a reconstructed, nonwoven GDL. The importance of cell clamping pressure on fuel cell performance has been studied by several researchers.115,145,146 The GDL microstructure compression effect is based on the reduced order compression model originally proposed by Schulz et al.116 The reduced compression model relies on the unidirectional morphological displacement of solid voxels in the GDL structure under load and with the assumption of negligible transverse strain. Details of the reduced compression model can be found in ref. 116. However, with the reduced compression model, it is difficult to find a relation between the compression ratio and the external load. The compression ratio is defined as the ratio of the thickness of compressed sample to that of the uncompressed sample. Nevertheless, this approach leads to reliable 3-D morphology of the nonwoven GDL structures under compression. Fig. 15 shows compressed, reconstructed nonwoven GDL microstructures with 20% and 40% compression along with the uncompressed structure and representative 2-D cross-sections. Due to the compression of the structure, the pore size distribution is expected to shift toward smaller pores. Fig. 15(b) shows the pore size distributions of the uncompressed and 50% compressed GDL microstructures. It can be observed that the mean pore size shifts from around 17 μm to approximately 10 μm under 50% compression, while the width of the pore size distribution shows negligible variation. Fig. 16 shows the liquid water distribution and the invasion pattern from the primary drainage simulation with increasing capillary pressure in the initially air-saturated 30% compressed carbon paper GDL microstructure characterized by hydrophobic wetting characteristics with a static contact angle of 140°. Similar to the uncompressed GDL, in Fig. 13, at very low initial capillary pressures, the invading front overcomes the barrier pressure only at some preferential locations depending upon the pore size. As the capillary pressure increases, several liquid water fronts start to penetrate into the air occupied domain. Owing to the compression induced microstructural change, further increase in capillary pressure exhibits coalescence of drops and concurrent merging of the fronts into a single front. This newly formed front propagates in the through-plane direction with liquid water build-up and subsequent action of capillarity. However, no preferential front migration toward the in-plane direction, as opposed to that in the uncompressed structure, is observed, which can be attributed to the increased tortuosity owing to the compression of the GDL. Emergence of droplets and subsequent growth can also be observed in the constricted pores primarily due to strong wall adhesion forces from interactions with highly hydrophobic fibers with the increasing capillary pressure. Finally, the predominant front reaches the air reservoir, physically the GDL/channel interface, at a preferential location and the corresponding capillary pressure is referred to as the bubble point. Concurrent to the bubble point, the microstructural change also reflects in the movement of water in the in-plane direction which could rather be attributed to the liquid water build-up at the corresponding saturation level, and differs significantly from the two-phase transport in the uncompressed GDL shown in Fig. 13.
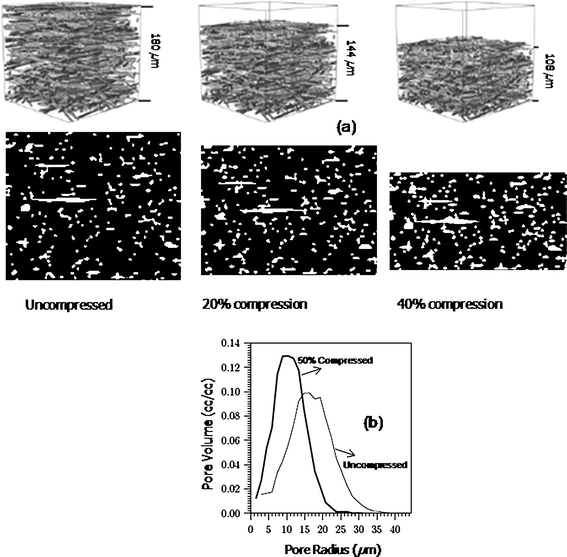 | ||
| Fig. 15 Representative uncompressed and compressed non-woven GDL structures along with pore size distribution.116 | ||
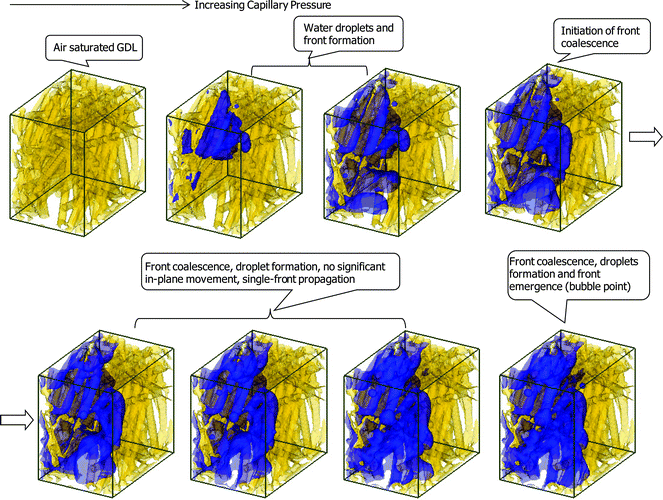 | ||
| Fig. 16 Advancing liquid water front with increasing capillary pressure through the initially air-saturated reconstructed GDL microstructure with 30% compression from the primary drainage simulation using LBM.144 | ||
Most recently, Mukherjee et al.131,147 examined the impact of GDL durability on the underlying flooding behavior. The beginning-of-life (fresh) GDL exhibits fully hydrophobic characteristics, which facilities liquid water transport and hence reduces flooding. Experimental data, however, suggest that the GDL loses hydrophobicity over prolonged PEFC operation and becomes prone to enhanced flooding. Borup and co-workers148,149 have reported the GDL durability issues due to the loss of hydrophobicity from their extensive experimental investigation. Fig. 17 shows the invasion pattern of liquid water from the displacement simulation in the LBM framework with increasing capillary pressure in the initially air-saturated carbon paper GDL microstructure characterized by mixed wettability. In this simulation, 50% of the pore volume is rendered hydrophilic, which are assumed to be randomly dispersed throughout the GDL structure, thereby characterizing an aged GDL. The hydrophobic pores are characterized with a static contact angle of 140° and the hydrophilic pores with 80°. At the initially very low capillary pressure, the invading liquid water exhibits both droplet formation in the hydrophobic pores and film formation due to the hydrophilic pores. With increasing capillary pressure, liquid water films tend to merge and assists in front movement. The front propagation is dominated by the film formation and subsequent merging phenomena. The underlying anisotropy in the GDL microstructure fails to assist in the branching and in-plane movement as in the case of a purely hydrophobic GDL (shown in Fig. 13). Toward the bubble point, the aged GDL displays liquid water slug formation, instead of fingers and evidently leads to higher saturation level and enhanced flooding.
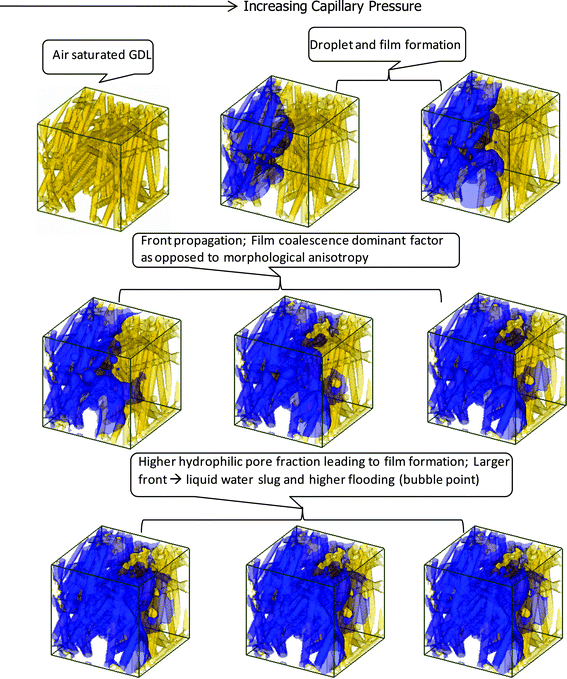 | ||
| Fig. 17 Advancing liquid water front with increasing capillary pressure through the mixed wet GDL microstructure with 50% hydrophilic pores from the displacement simulation using LBM.131 | ||
Koido and co-workers,150 used the S–C LBM to study two-phase distributions in a reconstructed nonwoven carbon paper GDL microstructure and evaluated the relative permeability relation as a function of liquid water saturation. They emphasized the importance of low capillary number in their simulations. Fig. 18 shows the evaluated relative permeability relations in the carbon paper GDL. Park and Li151 also conducted a preliminary study of two-phase behavior in a 2-D slice of a carbon paper GDL structure and employed the S–C LB model.
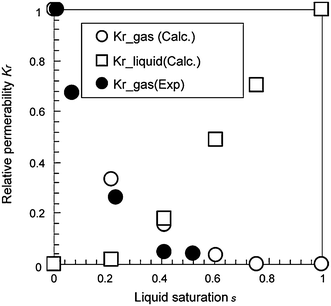 | ||
| Fig. 18 Comparison of measured relative permeability with the predicted data from LBM simulation.150 | ||
Niu et al.,152 on the other hand, developed a multiphase, multi-relaxation time (MRT) LB model to study two-phase transport in a reconstructed nonwoven GDL microstructure. The MRT LB model is based on the diffuse interface theory, and can handle multiphase flows with large density and viscosity ratios. Details of the model can be found in ref. 152. In this exploratory study, Niu and co-workers152 primarily focused on the influence of different pressure gradients and viscosity ratio combinations on the two-phase distributions and evaluated the relative permeability - saturation relations under such conditions.
Recently, Tabe et al.153 employed the two-phase LB model, to study liquid water invasion pattern in an idealized 2-D porous structure and emphasized the capillary fingering behavior at low Capillary number in the of a PEFC GDL. Their LB method is adapted from the two-phase model originally proposed by Inamuro et al.154 based on the free energy approach along with an explicit Poisson type pressure solving scheme.
6. Pore morphology modeling
The pore morphology model (PMM) includes the digital pore structure and is computationally fast. It has proved to be very effective in studying quasi-static two-phase drainage in complex porous structures and predicting the capillary pressure - saturation relation.926.1. Methodology
The PM model simulates the drainage process by relying on morphological decomposition of the 3-D digital image of the porous structure to determine the pore space accessible to the invading non-wetting (NWP) phase and uses the pore radius as the ordering parameter corresponding to a specified pressure.92 The key steps in the simulated quasi-static drainage process with the PMM include:92➢ The entire pore space is initially filled with the wetting phase (WP) and the capillary pressure is zero. At one end, the porous medium is connected to a NWP reservoir while at the opposite end it is connected to the WP reservoir.
➢ The pore space is eroded by a spherical structuring element with radius, r, corresponding to the capillary pressure, pc, according to the Young-Laplace equation:
 | (4) |
➢ At a given capillary pressure, only those pores within the eroded pore space having a continuous connection to the NWP reservoir are filled with the NWP. The rest of the unconnected pores are removed from the eroded space.
➢ The phase saturations related to the capillary pressure are subsequently determined by dilating the eroded pore space and evaluating the corresponding occupied volume fractions of the pore space. Details of the erosion and dilation process related to mathematical morphology can be found in ref. 92.
➢ The erosion-dilation process is repeated with the next larger spherical element corresponding to varying capillary pressures.
6.2. Two-phase simulation studies
Schulz and co-workers116 pioneered the PM model for simulating quasi-static drainage in the reconstructed nonwoven GDL microstructure. Fig. 19 shows the liquid water distributions in the reconstructed carbon paper GDL microstructure at various capillary pressures as predicted by the PM model.116 At bubble point, the invading liquid water front reaches the air reservoir via a connected pathway through the GDL structure and the corresponding capillary pressure is referred to as the bubble point pressure (pcb). From the liquid saturation map, it can be observed that with increasing capillary pressure, several liquid water fronts start penetrating into the air-saturated medium in the form of fractal fingering based on the pore size distribution and the resulting capillary force. Fig. 20 shows the capillary pressure vs. liquid water saturation curve for the nonwoven GDL structure, with a contact angle of 120°, evaluated from the primary drainage simulation as well as the simulation with arbitrarily mobile fluids using the PM model.116 The arbitrarily mobile NWP and WP distributions correspond to the physical scenario of liquid water formation due to condensation of water vapor at random locations inside the GDL which subsequently transports owing to the action of capillarity. The GDL microstructure characterized by hydrophobic wetting characteristics exhibits a finite entry pressure for the initiation of the invasion of the non-wetting phase into the wetting phase saturated domain in the primary drainage experiment. The capillary pressure vs. liquid water saturation relation is based on the direct manifestation of the underlying pore morphology and such correlation could prove to be valuable input for macroscopic two-phase fuel cell models. It is to be noted that the quasi-static two-phase distribution in the PM model is based on purely morphological consideration of overlapping spherical elements and therefore cannot accurately capture the effect of the interfacial shape on the invasion process.116 Details of the two-phase simulation using PMM in the PEFC GDL can be found in ref. 116.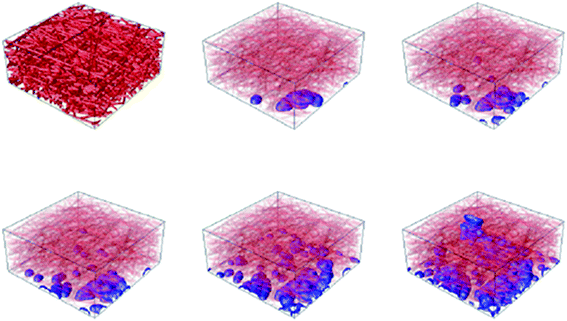 | ||
| Fig. 19 Liquid water distribution pattern from the drainage simulation using the PM model.116 | ||
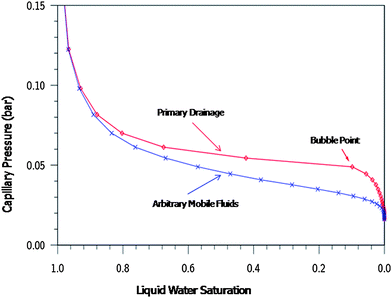 | ||
| Fig. 20 Capillary pressure – saturation relations for the reconstructed non-woven GDL structure using PM model.116 | ||
Schulz and co-workers116,155,156 also studied the influence of compression on the capillary pressure - saturation characteristics and the oxygen effective diffusivity owing to the pore blockage by liquid water in the PEFC GDL using the PM model. Fig. 21 displays the capillary pressure and effective diffusivity relations with liquid water saturation under varying levels of compression. It is quite evident that increased compression leads to more tortuous pore structure which in turn requires increasing capillary pressure for the invasion of the non-wetting phase into the wetting phase saturated GDL in order to achieve the same level of saturation. The increase in the bubble point pressure with increased compression level further testifies the extra level of resistance offered by the compressed GDL owing to the underlying microstructural change as opposed to the uncompressed sample. They also fitted the capillary pressure vs. liquid water saturation curves to the classical van Genuchten correlation.157
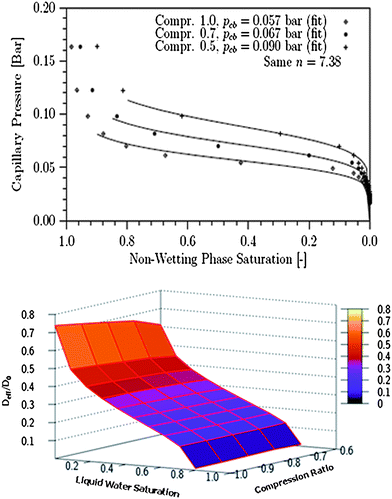 | ||
| Fig. 21 Capillary pressure and effective diffusivity relations with liquid water saturation under compression for a non-woven GDL structure using the PM model.116,155 | ||
Becker et al.127 further deployed the PM model to study the two-phase characteristics in a non-woven GDL microstructure generated using X-Ray tomography. Fig. 22 shows the water emergence at bubble point and the capillary pressure – saturation relations from the primary drainage simulation using PM modeling in the tomography generated carbon paper structure.
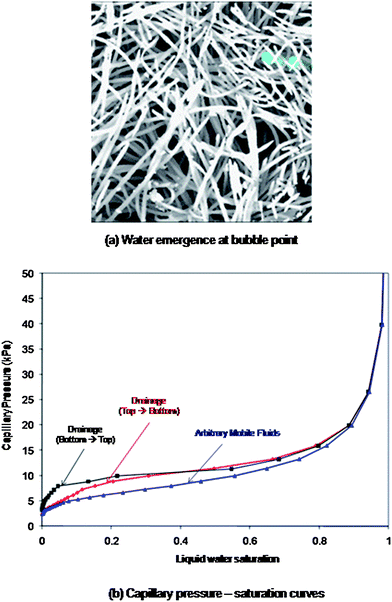 | ||
| Fig. 22 (a) Water emergence at bubble point, and (b) capillary pressure – saturation curves from the drainage simulation using the PM model in the carbon paper GDL microstructure reconstructed from tomography image.127 | ||
7. Pore network modeling
In a typical pore-network modeling framework, a porous medium is discretized into a network of wide pore spaces, which are connected by narrower regions called throats.158–160 The morphology of a real porous medium is incorporated in the network structure using pore and throat size distributions and their connectivity. Pores can be typically modeled as nodes on a regular lattice (e.g. cubic lattice) with idealized pore bodies (i.e. cubic pores for a cubic lattice) connected by throats represented as ducts (e.g. square cross-section). The pore network can be constructed by assigning pore sizes using a rather mathematically simple truncated Weibull cumulative distribution.161 The Weibull distribution parameters can be adjusted to achieve the desired pore size distribution. The throat sizes can be assigned using simple logical rules. For example, Gostick et al.161 assumed that each throat is equal to the smallest adjacent pore size. They indicated that such simple rules for pore and throat size distributions can generate sufficiently open porous structures typical of PEFC gas diffusion layers characterized by high porosities. Flow within a throat is assumed to be laminar and is described by a generalized Poiseuille flow depending on the assumed throat shape. While the radius of a throat serves to define its hydraulic conductance, the volume contributed by the throats is assumed to be small relative to the pore volumes. Only one fluid can reside in a throat and fluids are assumed to be incompressible. The resistance offered by a pore to flow is also assumed to be negligible.7.1. Methodology
In the two-phase drainage simulation within the PNM framework,162,163 for the liquid water to invade a throat, the pressure difference across a meniscus must exceed the throat entry capillary pressure given by Young–Laplace equation, eqn (4). Once a throat is invaded the connecting pore will be automatically invaded by liquid water owing to its larger size. Each phase, then, obeys volume conservation within each pore body. In an invaded pore or throat wetting phase can be present along the corners in the form of wetting films.164 For the liquid water/air two-phase flow, the flow rate of liquid water through a throat depends on the fluid configuration in the pores connected to that throat and the volumetric flow rate gives the estimate of the liquid water saturation corresponding to the capillary pressure.7.2. Two-phase simulation studies
Sinha and Wang165 deployed the PN model to study liquid water transport in a hydrophobic carbon paper GDL and highlighted the influence of GDL/channel surface coverage and Capillary number on the liquid water front movement and profiles in the GDL. Fig. 23 shows the equivalent pore network representation for the nonwoven carbon paper GDL, assumed to consist of randomly stacked regular fiber screens leading to a three-dimensional random tetragonal pore network structure with cubic pores and square throats. Details of the two-phase PNM can be found in ref. 165. In this study, they indicated the formation of irregular fractal patterns and elucidated the influence of liquid water surface coverage on such behavior at the GDL-channel. Fig. 24 shows the steady-state liquid water saturation profiles for Capillary numbers (Ca) varying from 10−8 to 10−3. The characteristics of the saturation profile changes from a fractal form (Ca = 10−8) to a stable flow form (Ca = 10−4 and 10−3) with increase in capillary number.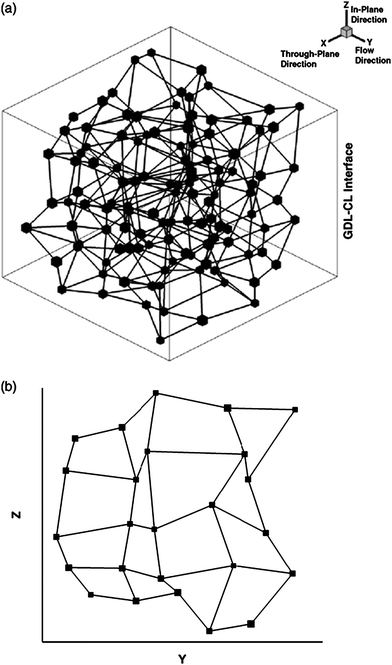 | ||
| Fig. 23 Schematic of pore-network model for a carbon paper GDL: (a) 3-D view; (b) 2-D cross-section showing the connectivity of pores in a plane.165 | ||
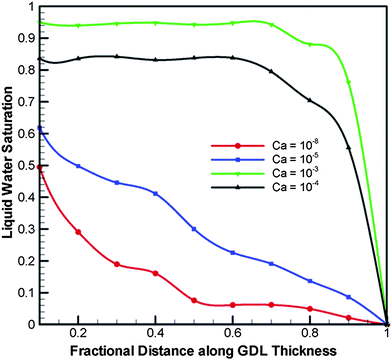 | ||
| Fig. 24 Steady state liquid water saturation profiles along the GDL thickness as function of capillary number, Ca, for zero surface coverage.165 | ||
In another work, Sinha and Wang166 extended the afore-mentioned PN model to study liquid water transport in a mixed-wettability nonwoven GDL, characteristic of an aged GDL. Fig. 25 shows the steady-state liquid water saturation profiles along the GDL thickness as a function of the hydrophilic pore fraction in a mixed-wet GDL. The suppression of finger-like morphology in a mixed-wet GDL renders a change in saturation profile shape from concave, typical of fractal fingering, to convex, typical of stable front, with increase in hydrophilic fraction.
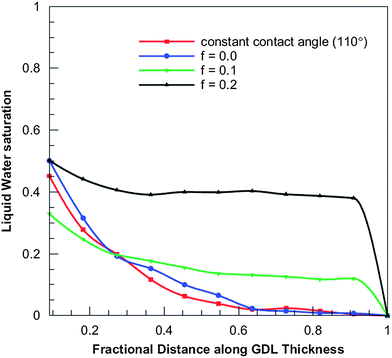 | ||
| Fig. 25 Liquid water saturation profiles along GDL thickness as a function of the hydrophilic fraction, f.166 | ||
Gostick et al.161 employed a two-phase PNM to study primary drainage in the hydrophobic carbon paper GDL. They evaluated the capillary pressure–saturation relations for different nonwoven GDL structures. Fig. 26 shows the PNM predicted capillary pressure–saturation curves along with experimentally measured data using mercury porosimetry from the work of Gostick et al.161 Koido et al.150 also used a similar two-phase PNM formalism to predict the capillary pressure–saturation curves for nonwoven GDLs.
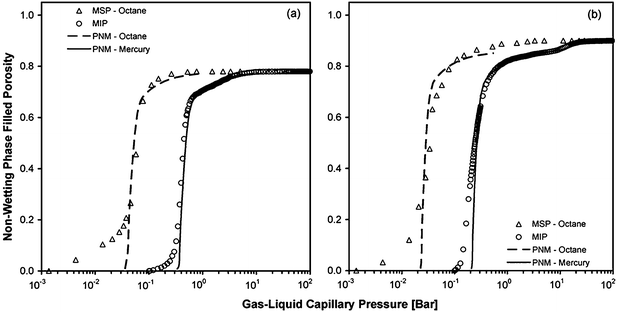 | ||
| Fig. 26 Comparison of computed capillary pressure curves with experimental porosimetry data for two commercial carbon paper GDL materials: (a) Toray 090 and (b) SGL 10BA.161 | ||
Bazylak and co-workers167 deployed an invasion percolation type network model to evaluate the capillary pressure and relative permeability relations as functions of liquid water saturation for the PEFC GDL. They investigated the influence of network size and heterogeneity on capillary pressure and relative permeability. Their study suggests that the relative permeability changes significantly with liquid water saturation exhibiting a power law trend for higher saturation and is relatively invariant at lower saturation. The capillary pressure, however, is predominantly affected by the network heterogeneity.
In another recent work, Bazylak et al.168 employed a pore network model to explore the design of PEFC gas diffusion layer to control the water transport therein. They investigated the influence of randomized pore networks with radial and diagonal bias on the liquid water saturation levels in the 2-D porous media representations along with analogous microfluidic experiments. Fig. 27 numerically and experimentally shows the influence of different simplified pore network patterns, e.g. isotropic, diagonal bias, radial bias and multiple radial gradients, on the underlying two-phase transport behavior. Their study shows that a radial bias in the porous network is beneficial with reduced saturation level.
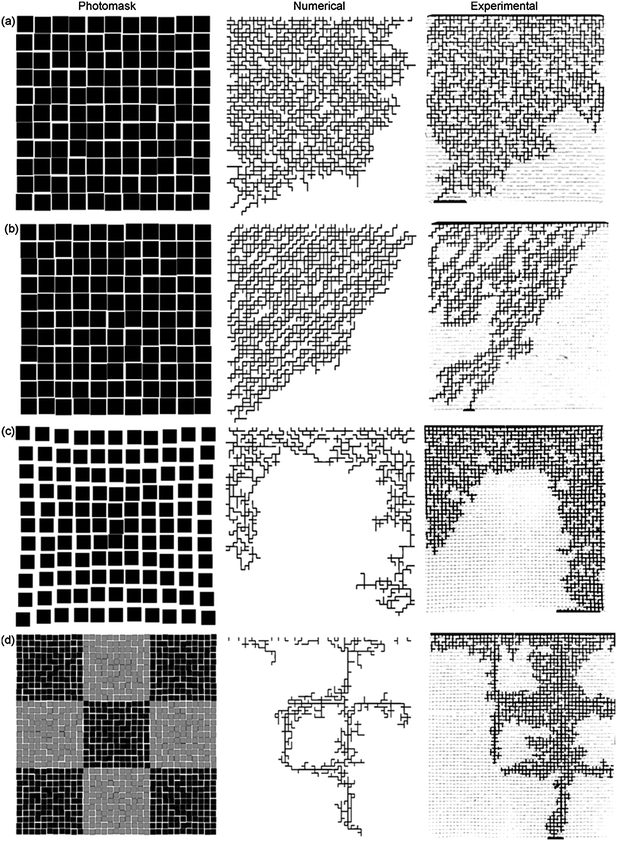 | ||
| Fig. 27 Numerical and experimental random pore network flow patterns at breakthrough: (a) isotropic perturbations, (b) diagonal bias perturbations, (c) radial gradient, and (d) checkerboard pattern with multiple radial gradient patches.168 | ||
Nam and co-workers,169,170 in their recent works, used the PN model to study the two-phase transport in the PEFC GDL. Following the works by Sinha and Wang,165 they further reconfirmed the capillary dominated liquid water transport in hydrophobic GDLs. Their results, shown in Fig. 28, suggest that the saturation level in GDLs can be lowered by reducing the invaded pore fraction or by reducing the thickness.
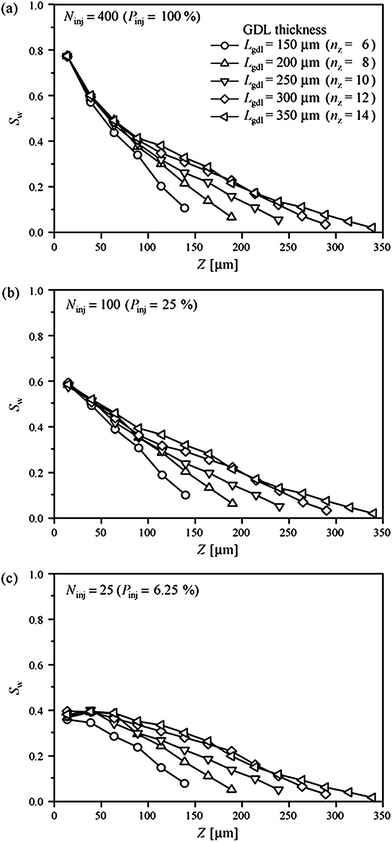 | ||
| Fig. 28 Effect of GDL thickness on distribution of liquid water saturation for invaded pore fraction, Pinj, of (a) 100%, (b) 25%, and (c) 6.25%.170 | ||
Prat and co-workers171 employed a pore network model with invasion percolation algorithm in a 2-D idealized network and explained the findings from the study in the context of two phase flow and evaporation in the PEFC GDL. They highlighted that although drying is faster in a hydrophilic medium, the benefit on lower liquid water saturation in a hydrophobic GDL is overriding. Fig. 29 and 30 show the liquid water invasion and evaporation patterns, respectively, in the idealized porous medium from the pore network simulation and experimental visualization in the transparent micro-model.
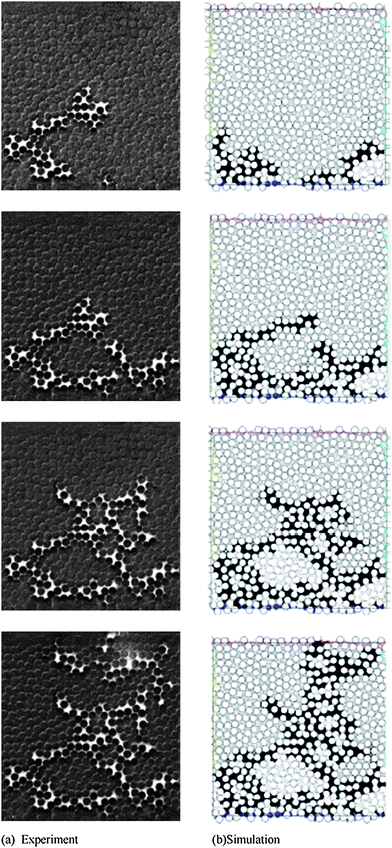 | ||
| Fig. 29 Displacement patterns observed during the drainage experiment in the model porous medium. Water (in white) injected from the bottom edge displaces air (in dark grey). (b) Simulated displacement patterns using IP model (invading phase in black).171 | ||
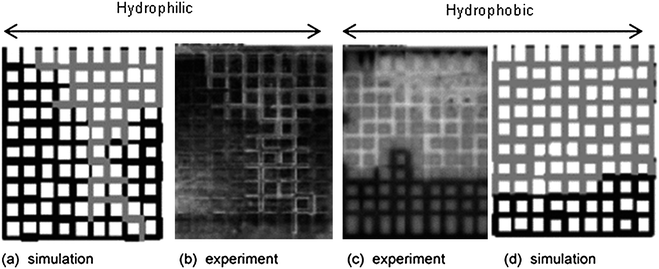 | ||
| Fig. 30 Evaporation patterns (gas phase in grey or white, water in black or dark grey, rectangles of random size form the solid matrix) in hydrophilic and hydrophobic networks.171 | ||
In another pore network study, Prat and co-workers172 highlighted that due to the lack of length scale separation between the size of representative elementary volume (REV) and the system size, the current two-phase continuum models used in the PEFC literature display poorer prediction. Most recently, Prat and co-workers173 also employed the invasion percolation type pore network model to study the quasi-steady invasion pattern using multiple inlet injections into a model porous media. They explained the finding in the context of two-phase invasion pattern in a hydrophobic PEFC GDL and highlighted that there is a smaller number of breakthrough points as compared to the number of inlet injection points due to internal front merging and cluster formations.
Finally, it is important to note that the aforementioned pore-scale models (LB, PM, PN) have typically considered two-phase transport in a single porous medium (e.g. CL or GDL). The interfacial two-phase dynamics between dissimilar components in the PEFC assembly, namely CL-GDL and GDL-channel interfaces, is of profound significance, which influences the overall water balance and cell performance. In this regard, a few notable attempts in the macroscopic two-phase modeling on PEFC interfacial interactions are briefly discussed. The first study on liquid droplet phenomena at the GDL-channel interface and interfacial liquid coverage was carried out by Meng and Wang174 using the multiphase mixture (M2) model.175 This important concept was subsequently visited by numerous experimental and modeling studies.176,177 Gurau and Mann178 recently reviewed this issue, while the earliest study in this area dates back to Meng and Wang.174 The most widely used interfacial condition between the CL and the GDL is the saturation jump model based on capillary pressure equilibrium, as initially proposed by Nam and Kaviany16 and Pasaogullari and Wang.179 Incorporation of the saturation jump condition in the PEFC CFD models, such as the M2 model, has been routinely demonstrated and widely reported in the literature.180,181
8. Summary and outlook
A key performance limitation in PEFCs is manifested in terms of mass transport loss originating from suboptimal liquid water transport and resulting in flooding phenomena. Liquid water can block porous pathways in either the GDL or the CL, thus hindering oxygen transport from the flow field to the electrochemically actives sites in the catalyst layer. The cathode CL and GDL are the components primarily responsible for facilitating gas and liquid transport, therefore play a major role in determining the water management of a PEFC and hence the mass transport loss.Computational modeling has been extensively employed at different levels of complexities to study fuel cell transport and performance. However, the macroscopic fuel cell models cannot address the effects of the underlying complex pore morphology of the CL and GDL. In this article, we discuss the recent developments of a comprehensive suite of pore-scale modeling framework encompassing lattice Boltzmann (LB), pore morphology (PM) and pore network (PN) models to study two-phase transport and the underlying structure-wettability-performance interactions in the PEFC CL and GDL. Microstructure generation of the CL and GDL using stochastic reconstruction and experimental imaging are discussed. The mesoscopic, two-phase LBM simulates liquid water transport through the CL and GDL microstructures in order to gain insight into the influence of structure and wettability on the pore-scale two-phase dynamics as well as to evaluate the two-phase constitutive relations in terms of capillary pressure and relative permeability as functions of liquid water saturation. The pore morphology model is a fast direct simulation tool and is reasonably suitable for simulating quasi-static drainage to evaluate capillary pressure – saturation response based on morphological analysis of the digital structure. The effect of GDL compression on the microstructure and underlying flooding behavior is discussed via a morphological analysis based reduced order compression model along with PMM and LBM. The pore network model incorporates a simplified network representation of the fibrous GDL to study the underlying two-phase transport and evaluates the pertinent correlations (e.g. capillary pressure - saturation curves). The PNM is effective in simulating two-phase transport under realistic PEFC operating conditions. The importance of low Capillary number two-phase transport regime has been specially highlighted by the LBM and PNM simulations. In the dearth of two-phase correlations for the PEFC CL and GDL, the two-phase transport parameters evaluated from such pore-scale study could be adapted into two-phase computational fuel cell dynamics (CFCD) models for more reliable performance predictions.
Finally, this article emphasizes the capabilty of the different pore-scale models toward gaining insight into underlying two-phase dynamics and intricate structure-transport-performance interplay in the PEFC CL and GDL. The pore-scale modeling also underscores its suitability to transition the current macroscopic fuel cell models beyond empiricism through systematic estimation of the otherwise empirically constructed transport parameters. Extensive future research effort is warranted to develop a “bottom-up,” vertically integrated modeling paradigm in order to study two-phase dynamics especially at the interfaces between dissimilar porous components, the abiding performance limiting mechanisms encompassing multiple length scales and enable virtual materials design in the PEFC.
Acknowledgements
PPM would like to thank V. P. Schulz (presently at Co-operative State University, Mannheim), A. Wiegmann and J. Becker from Fraunhofer ITWM, Germany for collaboration with GDL microstructure reconstruction and pore morphology modeling. PPM also thanks M. Nelson, F. Garzon, R. Mukundan and R. Borup from Los Alamos National Laboratory (LANL) for providing the GDL X-Ray microtomography images and discussions regarding experimental imaging. The authors acknowledge Elsevier, Electrochemical Society and American Society of Mechanical Engineers for the figures reproduced in this article from the referenced publications of their respective journals. Financial support from LANL LDRD Program and UC Lab Fees Research Project UCD-09-15 is gratefully acknowledged.References
- S. Gottesfeld and T. Zawodzinski, in Advances in Electrochemical Sciences and Engineering, ed. C. Tobiaset al., John Wiley and Sons, New York, 1997, 195 Search PubMed.
- C. Y. Wang, in Handbook of Fuel Cells - Fundamentals, Technology and Applications, ed. W. Vielstich, A. Lamm, and H. A. Gasteiger, Wiley, Chichester, 2003, 3, 337 Search PubMed.
- C. Y. Wang, Chem. Rev., 2004, 104, 4727 CrossRef CAS.
- A. Z. Weber and J. Newman, Chem. Rev., 2004, 104, 4679 CrossRef CAS.
- Z. H. Wang, C. Y. Wang and K. S. Chen, J. Power Sources, 2001, 94, 40 CrossRef CAS.
- U. Pasaogullari and C. Y. Wang, J. Electrochem. Soc., 2004, 151, A399 CrossRef CAS.
- U. Pasaogullari and C. Y. Wang, J. Electrochem. Soc., 2005, 152, A380 CrossRef CAS.
- U. Pasaogullari, P. P. Mukherjee, C. Y. Wang and K. S. Chen, J. Electrochem. Soc., 2007, 154, B823 CrossRef CAS.
- Y. Wang and C. Y. Wang, J. Electrochem. Soc., 2006, 153, A1193 CrossRef CAS.
- Y. Wang and C. Y. Wang, J. Electrochem. Soc., 2007, 154, B636 CrossRef CAS.
- A. Z. Weber and J. Newman, J. Electrochem. Soc., 2005, 152, A677 CrossRef CAS.
- T. Berning and N. Djilali, J. Electrochem. Soc., 2003, 150, A1589 CrossRef CAS.
- M. Noponen, E. Birgersson, J. Ihonen, M. Vynnycky, A. Lundblad and G. Lindbergh, Fuel Cells, 2004, 4, 365 CrossRef CAS.
- S. Dutta, S. Shimpalee and J. W. Van Zee, Int. J. Heat Mass Transfer, 2001, 44, 2029 CrossRef CAS.
- S. Mazumder and J. V. Cole, J. Electrochem. Soc., 2003, 150, A1510 CrossRef CAS.
- J. Nam and M. Kaviany, Int. J. Heat Mass Transfer, 2003, 46, 4595 CrossRef CAS.
- W. He, J. S. Yi and T. V. Nguyen, AIChE J., 2000, 46, 2053 CrossRef CAS.
- L. You and H. Liu, Int. J. Heat Mass Transfer, 2002, 45, 2277 CrossRef CAS.
- J. J. Baschuk and X. Li, J. Power Sources, 2000, 86, 181 CrossRef CAS.
- X. G. Yang, F. Y. Zhang, A. L. Lubawy and C. Y. Wang, Electrochem. Solid-State Lett., 2004, 7, A408 CrossRef CAS.
- S. Tsushima, K. Teranishi and S. Hirai, Electrochem. Solid-State Lett., 2004, 7, A269 CrossRef CAS.
- P. K. Sinha, P. Halleck and C. Y. Wang, Electrochem. Solid-State Lett., 2006, 9, A344 CrossRef CAS.
- T. A. Trabold, J. P. Owejan, D. L. Jacobson, M. Arif and P. R. Huffman, Int. J. Heat Mass Transfer, 2006, 49, 4712 CrossRef CAS.
- M. A. Hickner, N. P. Siegel, K. S. Chen, D. N. McBrayer, D. S. Hussey, D. L. Jacobson and M. Arif, J. Electrochem. Soc., 2006, 153, A902 CrossRef CAS.
- J. St-Pierre, J. Electrochem. Soc., 2007, 154, B724 CrossRef CAS.
- P. Boillat, D. Kramer, B. C. Seyfang, G. Frei, E. Lehmann, G. G. Scherer, A. Wokaun, Y. Ichikawa, Y. Tasaki and K. Shinohara, Electrochem. Commun., 2008, 10, 546 CrossRef CAS.
- I. Manke, C. Hartnig, M. Grünerbel, W. Lehnert, N. Kardjilov, A. Haibel, A. Hilger, J. Banhart and H. Riesemeier, Appl. Phys. Lett., 2007, 91, 174105 CrossRef.
- B. Gao, T. S. Steenhuisa, Y. Zevi, J.-Y. Parlangea, R. N. Carter and T. A. Trabold, J. Power Sources, 2009, 190, 493 CrossRef CAS.
- R. Mukundan and R. L. Borup, Fuel Cells, 2009, 9, 499 CrossRef CAS.
- P. P. Mukherjee, R. Mukundan, J. S. Spendelow, J. R. Davey, R. L. Borup, D. S. Hussey, D. L. Jacobson and M. Arif, ECS Trans., 2009, 25, 505 Search PubMed.
- A. Bazylak, Int. J. Hydrogen Energy, 2009, 34, 3845 CrossRef CAS.
- K. S. Udell, Int. J. Heat Mass Transfer, 1985, 28, 485 CrossRef CAS.
- M. C. Leverett, AIME Trans., 1941, 142, 152 Search PubMed.
- J. T. Gostick, M. W. Fowler, M. A. Ioannidis, M. D. Pritzker, Y. M. Volfkovich and A. Sakars, J. Power Sources, 2006, 156, 375 CrossRef CAS.
- J. D. Fairweather, P. Cheung, J. St-Pierre and D. T. Schwartz, Electrochem. Commun., 2007, 9, 2340 CrossRef CAS.
- T. V. Nguyen, G. Lin, H. Ohn and X. Wang, Electrochem. Solid-State Lett., 2008, 11, B127 CrossRef CAS.
- K. G. Gallagher, R. M. Darling, T. W. Patterson and M. L. Perry, J. Electrochem. Soc., 2008, 155, B1225 CrossRef CAS.
- I. S. Hussaini and C. Y. Wang, ECS Trans., 2009, 25, 1539 Search PubMed.
- I. S. Hussaini and C. Y. Wang, J. Power Sources, 2010, 195, 3830 CrossRef CAS.
- C. Pan, PhD thesis, University of North Carolina, Chapel Hill, USA, 2003.
- I. Fatt, Trans. AIME, 1956, 207, 144 Search PubMed.
- I. Fatt, Trans. AIME, 1956, 207, 160 Search PubMed.
- I. Fatt, Trans. AIME, 1956, 207, 164 Search PubMed.
- L. A. Ferrand and M. A. Celia, Water Resour. Res., 1992, 28, 859 CrossRef CAS.
- M. I. Lowry and C. T. Miller, Water Resour. Res., 1995, 31, 455 CrossRef.
- P. C. Reeves and M. A. Celia, Water Resour. Res., 1996, 32, 2345 CrossRef.
- G. G. Pereira, W. V. Pinczewski, D. Y. C. Chan, L. Paterson and P. E. Oren, Transp. Porous Media, 1996, 24, 167 Search PubMed.
- G. G. Pereira, Phys. Rev. E: Stat. Phys., Plasmas, Fluids, Relat. Interdiscip. Top., 1999, 59, 4229 CrossRef CAS.
- J. S. Andrae, Jr., D. A. Street, Y. Shibusa, S. Havlin and H. E. Stanley, Phys. Rev. E: Stat. Phys., Plasmas, Fluids, Relat. Interdiscip. Top., 1997, 55, 772 CrossRef.
- L. Li, C. A. Peters and M. A. Celia, Adv. Water Resour., 2006, 29, 1351 CrossRef CAS.
- D. Kavetski, C. A. Peters, M. A. Celia and B. Lindquist, Geochimica Cosmochimica Acta, 2007, 71, A470 Search PubMed.
- X. Li and Y. C. Yortsos, AIChE J., 1995, 41, 214 CrossRef CAS.
- Y. L. Bray and M. Prat, Int. J. Heat Mass Transfer, 1999, 42, 4207 CrossRef.
- A. G. Yortsos, A. G. Boudouvis, A. K. Stubos, I. N. Tsimpanogiannis and Y. C. Yortsos, Phys. Rev. E: Stat., Nonlinear, Soft Matter Phys., 2003, 68, 037303 CrossRef.
- Q. Kang, I. N. Tsimpanogiannis, D. Zhang and P. C. Lichtner, Fuel Process. Technol., 2005, 86, 1647 CrossRef CAS.
- K. E. Thompson, AIChE J., 2002, 48, 1369 CrossRef CAS.
- H.-J. Vogel and K. Roth, Adv. Water Resour., 2001, 24, 233 CrossRef.
- R. I. Al-Raoush and C. S. Willson, J. Hydrol., 2005, 300, 44 CrossRef CAS.
- A. S. Al-Kharusi and M. J. Blunt, J. Pet. Sci. Eng., 2007, 56, 219 CrossRef CAS.
- G. Schena and S. Favretto, Transp. Porous Media, 2007, 70, 181 Search PubMed.
- R. Glantz and M. Hilpert, Adv. Water Resour., 2007, 30, 227 CrossRef.
- D. A. Wolf-Gladrow. Lattice gas cellular automata and lattice Boltzmann models: an introduction, Springer-Verlag, Heidelberg, 2000 Search PubMed.
- F. H. Harlow and J. E. Welch, Phys. Fluids, 1965, 8, 2182 CrossRef.
- B. J. Daly, Phys. Fluids, 1969, 12, 1340 CrossRef.
- C. W. Hirt and B. D. Nichols, J. Comput. Phys., 1981, 39, 201 CrossRef.
- J. A. Sethian, Level Set Methods: Evolving Interfaces in Geometry, Fluid Mechanics, Computer Vision, and Materials Science, Cambridge University Press, 1996 Search PubMed.
- S. O. Unverdi and G. Tryggvason, J. Comput. Phys., 1992, 100, 25 CrossRef.
- G. Tryggvason, B. Bunner, A. Esmaeeli, D. Juric, N. Al-Rawahi, W. Tauber, J. Han, S. Nas and Y. J. Jan, J. Comput. Phys., 2001, 162, 708 CrossRef.
- G. A. Bird, Molecular Gas Dynamics and the Direct Simulation of Gas Flows, Clarendon, Oxford, 1994 Search PubMed.
- D. C. Rapaport, The Art of Molecular Dynamics Simulation, Cambridge University Press, 1995 Search PubMed.
- S. Chen and G. Doolen, Annu. Rev. Fluid Mech., 1998, 30, 329 CrossRef.
- A. K. Gunstensen, D. H. Rothman, S. Zaleski and G. Zanetti, Phys. Rev. A: At., Mol., Opt. Phys., 1991, 43, 4320 CrossRef CAS.
- X. Shan and H. Chen, Phys. Rev. E: Stat. Phys., Plasmas, Fluids, Relat. Interdiscip. Top., 1993, 47, 1815 CrossRef.
- X. Shan and H. Chen, Phys. Rev. E: Stat. Phys., Plasmas, Fluids, Relat. Interdiscip. Top., 1994, 49, 2941 CrossRef CAS.
- M. Swift, W. Osborn and J. Yeomans, Phys. Rev. Lett., 1995, 75, 830 CrossRef CAS.
- M. Swift, S. Orlandini, W. Osborn and J. Yeomans, Phys. Rev. E: Stat. Phys., Plasmas, Fluids, Relat. Interdiscip. Top., 1996, 54, 5041 CrossRef CAS.
- R. Nourgaliev, T. Dinh, T. Theofanous and D. Joesph, Int. J. Multiphase Flow, 2003, 29, 117 CrossRef CAS.
- X. He, S. Chen and R. Zhang, J. Comput. Phys., 1999, 152, 642 CrossRef CAS.
- X. He, R. Zhang, S. Chen and G. D. Doolen, Phys. Fluids, 1999, 11, 1143 CrossRef CAS.
- Q. Kang, D. Zhang and S. Chen, Phys. Fluids, 2002, 14, 3203 CrossRef CAS.
- Q. Kang, D. Zhang and S. Chen, Adv. Water Resour., 2004, 27, 13 CrossRef.
- Q. Kang, D. Zhang and S. Chen, J. Fluid Mech., 2005, 545, 41 Search PubMed.
- C. Pan, M. Hilpert and C. T. Miller, Water Resour. Res., 2004, 40, 1.
- H. Li, C. Pan and C. T. Miller, Phys. Rev. E: Stat., Nonlinear, Soft Matter Phys., 2005, 72, 026705 CrossRef.
- P. Yuan and L. Schaefer, Phys. Fluids, 2006, 18, 042101 Search PubMed.
- Q. Kang, P. C. Lichtner and D. Zhang, J. Geophys. Res., 2006, 111, B05203 CrossRef.
- Q. Kang, P. C. Lichtner and D. Zhang, Water Resour. Res., 2007, 43, W12S14 CrossRef.
- Q. Kang, P. C. Lichtner, H. S. Viswanathan and A. I. Abdel-Fattah, Transp. Porous Media, 2010, 82, 197 Search PubMed.
- D. F. Boutt, B. K. Cook, B. J. O. L. McPherson and J. R. Williams, J. Geophys. Res., 2007, 112, B10209 CrossRef.
- D. F. Boutt, L. Goodwin and B. J. O. L. McPherson, Water Resour. Res., 2009, 45, W00C13 CrossRef.
- R. D. Hazlett, Transp. Porous Media, 1995, 20, 21 Search PubMed.
- M. Hilpert and C. T. Miller, Adv. Water Resour., 2001, 24, 243 CrossRef.
- M. Hilpert, R. Glantz and C. T. Miller, Transp. Porous Media, 2003, 51, 267 Search PubMed.
- D. Adalsteinsson and M. Hilpert, Transp. Porous Media, 2006, 65, 337 Search PubMed.
- M. J. Kwiecien, I. F. Macdonald and F. A. L. Dullien, J. Microsc., 1990, 159, 343.
- D. P. Lymberopoulos and A. C. Payatakes, J. Colloid Interface Sci., 1992, 150, 61 CrossRef CAS.
- P. Spanne, J. F. Thovert, J. C. Jacquin, W. B. Lindquist, K. W. Jones and P. M. Adler, Phys. Rev. Lett., 1994, 73, 2001 CrossRef CAS.
- C. A. Baldwin, A. J. Sederman, M. D. Mantle, P. Alexander and L. F. Gladden, J. Colloid Interface Sci., 1996, 181, 79 CrossRef CAS.
- J. T. Fredrich, B. Menendez and T. F. Wong, Science, 1995, 268, 276 CrossRef CAS.
- M. Joshi, PhD thesis, University of Kansas, Lawrence, Kansas, 1974.
- J. A. Quiblier, J. Coll. Interf. Sci., 1984, 98, 84 CAS.
- P. M. Adler and J. F. Thovert, Appl. Mech. Rev., 1998, 51, 537 CrossRef.
- S. Torquato, Annu. Rev. Mater. Res., 2002, 32, 77 CrossRef CAS.
- K. L. Moore and K. S. Reeves, DOE Hydrogen Program Annual Merit Review Proceedings, Arlington, VA, USA, May 23–26, 2005 Search PubMed.
- P. P. Mukherjee and C. Y. Wang, J. Electrochem. Soc., 2006, 153, A840 CrossRef CAS.
- P. M. Adler, C. G. Jacquin and J. A. Quiblier, Int. J. Multiphase Flow, 1990, 16, 691 CrossRef CAS.
- P. M. Adler, Porous Media: Geometry and Transports, Butterworth-Heinemann, Stoneham, 1992 Search PubMed.
- D. P. Bentz and N. S. Martys, Transp. Porous Media, 1995, 17, 221 Search PubMed.
- J. G. Berryman, J. Appl. Phys., 1985, 57, 2374 CrossRef.
- H. A. Gasteiger, W. Gu, R. Makharia, M. F. Mathias, and B. Sompalli, inHandbook of Fuel Cells – Fundamentals, Technology and Applications, ed. W. Vielstich, A. Lamm, H. A. Gasteiger, Chichester, Wiley, 2003, 3, 593 Search PubMed.
- P. P. Mukherjee and C. Y. Wang, J. Electrochem. Soc., 2007, 154, B1121 CrossRef CAS.
- F. Rong, C. Huang, Z.-S. Liu, D. Song and Q. Wang, J. Power Sources, 2008, 175, 712 CrossRef CAS.
- S. H. Kim and H. Pitsch, J. Electrochem. Soc., 2009, 156, B673 CrossRef CAS.
- C. L. Y. Yeong and S. Torquato, Phys. Rev. E: Stat. Phys., Plasmas, Fluids, Relat. Interdiscip. Top., 1998, 57, 495 CrossRef CAS.
- M. F. Mathias, J. Roth, J. Fleming, and W. Lehnert, in Handbook of Fuel Cells – Fundamentals, Technology and Applications, ed. W. Lietsich, A. Lamm and H. A. Gasteiger, ch. 42, John Wiley & Sons, Chicester, 2003, 3, 517 Search PubMed.
- V. P. Schulz, J. Becker, A. Wiegmann, P. P. Mukherjee and C. Y. Wang, J. Electrochem. Soc., 2007, 154, B419 CrossRef CAS.
- K. Schladitz, S. Peters, D. Reinel-Bitzer, A. Wiegmann and J. Ohser, Comput. Mater. Sci., 2006, 38, 56 CrossRef.
- S. Rief, E. Glatt and A. Wiegmann, Proceedings of Filtech, 2009, 1, 231 Search PubMed.
- P. P. Mukherjee, P. K. Sinha and C. Y. Wang, J. Mater. Chem., 2007, 17, 3089 RSC.
- G. Inoue, T. Yoshimoto, Y. Matsukuma and M. Minemoto, J. Power Sources, 2008, 175, 145 CrossRef CAS.
- R. Thiedmann, F. Fleischer, C. Hartnig, W. Lehnert and V. Schmidt, J. Electrochem. Soc., 2007, 155, B391.
- (a) V. P. Schulz, D. Kehrwald, A. Wiegmann, and K. Steiner, Proceedings of 2nd NAFEMS CFD-Seminar: Flows (CFD) - Application and Trends, Wiesbaden, Germany, April 25–26, 2005, pp. 6.1–6.10 Search PubMed; (b) Personal communication with Dr. V. P. Schulz.
- R. Thiedmann, C. Hartnig, I. Manke, V. Schmidt and W. Lehnert, J. Electrochem. Soc., 2009, 156, B1339 CrossRef CAS.
- M. Nelson, F. Garzonet al., 215th ECS Meeting, San Francisco, CA, USA, May 24–29, 2009 Search PubMed.
- H. Ostadi, K. Jiang and P. D. Prewett, Micro Nano Lett., 2008, 3, 106 CrossRef.
- H. Ostadi, P. Rama, Y. Liu, R. Chen, X. Zhang and K. Jiang, Microelectron. Eng., 2010, 87, 1640 CrossRef CAS.
- J. Becker, V. P. Schulz and A. Wiegmann, J. Fuel Cell Sci. Technol., 2008, 5, 021006 CrossRef.
- J. Becker, R. Flückiger, M. Reum, F. N. Büchi, F. Marone and M. Stampanoni, J. Electrochem. Soc., 2009, 156, B1175 CrossRef CAS.
- V. Berejnov, D. Sinton and N. Djilali, J. Power Sources, 2009, 195, 1936.
- P. P. Mukherjee, E. Shim, R. Mukundan and R. L. Borup, ECS Trans., 2010, 33, 1483 Search PubMed.
- P. P. Mukherjee, Q. Kang, R. Mukundan and R. L. Borup, ECS Trans., 2010, 97 Search PubMed.
- D. Chinn, P. Ostendorp, M. Haugh, R. Kershmann, T. Kurfess, A. Claudet and T. Tucker, J. Manuf. Sci. Eng., 2004, 126, 813 CrossRef.
- S. Jaganathan, H. V. Tafreshi and B. Pourdeyhimi, J. Colloid Interface Sci., 2008, 326, 166 CrossRef CAS.
- R. Lenormand, E. Touboul and C. Zarcone, J. Fluid Mech., 1998, 189, 165 Search PubMed.
- R. P. Ewing and B. Berkowitz, Adv. Water Resour., 2001, 24, 309 CrossRef.
- E. F. Medici and J. S. Allen, J. Power Sources, 2009, 191, 417 CrossRef CAS.
- P. Bhatnagar, E. Gross and M. Krook, Phys. Rev., 1954, 94, 511 CrossRef CAS.
- X. Shan and G. D. Doolen, Phys. Rev. E: Stat. Phys., Plasmas, Fluids, Relat. Interdiscip. Top., 1996, 54, 3614 CrossRef CAS.
- P. P. Mukherjee, PhD thesis, The Pennsylvania State University, USA, 2007.
- P. P. Mukherjee, C. Y. Wang and Q. Kang, Electrochim. Acta, 2009, 54, 6861 CrossRef CAS.
- J. Bear, Dynamics of Fluids in Porous Media, Dover, New York, 1972 Search PubMed.
- P. P. Mukherjee and C. Y. Wang, ECS Trans., 2006, 3, 1085 Search PubMed.
- P. P. Mukherjee and C. Y. Wang, Electrochim. Acta., 2010 Search PubMed , submitted.
- P. P. Mukherjee, C. Y. Wang, Q. Kang, V. P. Schulz, J. Becker and A. Wiegmann, ECS Trans., 2009, 25, 1485 Search PubMed.
- P. M. Wilde, M. Mandel, M. Murata and N. Berg, Fuel Cells, 2004, 4, 180 CrossRef CAS.
- J. Ihonen, M. Mikkola and G. Lindbergh, J. Electrochem. Soc., 2004, 151, A1152 CrossRef CAS.
- P. P. Mukherjee, Q. Kang, R. Mukundan, and R. L. Borup, submitted, 2010.
- R. L. Borup, et al. , Chem. Rev., 2008, 107, 3904.
- D. L. Wood III and R. L. Borup, in Polymer Electrolyte Fuel Cell Durability, ed. F. N. Buchi, M. Inaba, and T. J. Schmidt, Springer, New York, 159, 2009 Search PubMed.
- T. Koido, T. Furusawa and K. Moriyama, J. Power Sources, 2008, 175, 127 CrossRef CAS.
- J. Park and X. Li, J. Power Sources, 2008, 178, 248 CrossRef CAS.
- X. D. Niu, T. Munekata, S. A. Hyodoa and K. Suga, J. Power Sources, 2007, 172, 542 CrossRef CAS.
- Y. Tabe, Y. Lee, T. Chikahisa and M. Kozakai, J. Power Sources, 2007, 193, 24.
- T. Inamuro, T. Ogata, S. Tajima and S. Konishi, J. Comput. Phys., 2004, 198, 628 CrossRef.
- V. P. Schulz, P. P. Mukherjee, J. Becker, A. Wiegmann and C. Y. Wang, ECS Trans., 2006, 3, 1069 Search PubMed.
- P. P. Mukherjee, V. P. Schulz, J. Becker, A. Wiegmann, and C. Y. Wang, submitted, 2010.
- M. T. van Genuchten, Soil Sci. Soc. Am. J., 1980, 44, 892 CrossRef.
- F. A. L. Dullien, Porous Media: Fluid Transport and Pore Structure, Academic Press, San Diego, CA, 1992 Search PubMed.
- M. Sahimi, Transp. Porous Media, 1995, 21, 189 Search PubMed.
- M. J. Blunt, Curr. Opin. Colloid Interface Sci., 2001, 6, 197 CrossRef CAS.
- J. T. Gostick, M. A. Ioannidis, M. W. Fowler and M. D. Pritzker, J. Power Sources, 2007, 173, 277 CrossRef CAS.
- M. J. Blunt, SPE J., 1997, 2, 70.
- M. J. Blunt, M. D. Jackson, M. Piri and P. H. Valvatne, Adv. Water Resour., 2002, 25, 1069 CrossRef CAS.
- P. Concus and R. Finn, Appl. Math. Sci., 1969, 63, 292 Search PubMed.
- P. K. Sinha and C. Y. Wang, Electrochim. Acta, 2009, 52, 7936.
- P. K. Sinha and C. Y. Wang, Chem. Eng. Sci., 2008, 63, 1081 CrossRef CAS.
- B. Markicevic, A. Bazylak and N. Djilali, J. Power Sources, 2007, 171, 706 CrossRef CAS.
- A. Bazylak, V. Berejnov, B. Markicevic, D. Sinton and N. Djilali, Electrochim. Acta, 2008, 53, 7630 CrossRef CAS.
- K. J. Lee, J. H. Nam and C. J. Kim, Electrochim. Acta, 2009, 54, 1166 CrossRef CAS.
- K. J. Lee, J. H. Nam and C. J. Kim, J. Power Sources, 2010, 195, 130 CrossRef CAS.
- O. Chapuis, M. Prat, M. Quintard, E. Chane-Kane, O. Guillot and N. Mayer, J. Power Sources, 2008, 178, 258 CrossRef CAS.
- M. Rebaia and M. Prat, J. Power Sources, 2009, 192, 534 CrossRef.
- L. Ceballos and M. Prat, J. Power Sources, 2010, 195, 825 CrossRef CAS.
- H. Meng and C. Y. Wang, J. Electrochem. Soc., 2005, 152, A1733 CrossRef CAS.
- C. Y. Wang and P. Cheng, Int. J. Heat Mass Transfer, 1996, 39, 3607 CrossRef CAS.
- F. Y. Zhang, X. G. Yang and C. Y. Wang, J. Electrochem. Soc., 2006, 153, A225 CrossRef CAS.
- K. S. Chen, M. A. Hickner and D. R. Noble, Int. J. Energy Res., 2005, 29, 1113 CrossRef.
- V. Gurau and J. A. Mann, SIAM J. Appl. Math., 2009, 70, 410 CrossRef.
- U. Pasaogullari and C. Y. Wang, Electrochim. Acta, 2004, 49, 4359 CrossRef CAS.
- H. Ju, PhD thesis, The Pennsylvania State University, USA, 2006.
- K. Kang and H. Ju, J. Power Sources, 2009, 194, 763 CrossRef CAS.
Footnote |
| † Present address: Oak Ridge National Laboratory, P.O. Box 2008, MS 6164, Oak Ridge, TN 37831, USA. |
| This journal is © The Royal Society of Chemistry 2011 |

