Vibrational overtone excitation in electron mediated energy transfer at metal surfaces†
Russell
Cooper
a,
Igor
Rahinov‡
a,
Zhisheng
Li
a,
Daniel
Matsiev
a,
Daniel J.
Auerbach
b and
Alec M.
Wodtke
*a
aDept. of Chemistry and Biochemistry, University of California Santa Barbara, Santa Barbara, CA 93106-9510, USA. E-mail: wodtke@chem.ucsb.edu
bGRT Inc., 861 Ward Drive, Santa Barbara, CA 93111, USA
First published on 24th May 2010
Abstract
Vibrational overtone excitation is, in general, inefficiently stimulated by photons, but can under some circumstances be efficiently stimulated by electrons. Here, we demonstrate electron mediated vibrational overtone excitation in molecular collisions with a metal surface. Specifically, we report absolute vibrational excitation probabilities to ν = 1 and 2 for collisions of NO(ν = 0) with a Au(111) surface as a function of surface temperature from 300 to 985 K. In all cases, the observed populations of vibrationally excited NO are near those expected for complete thermalization with the surface, despite the fact that the scattering occurs through a direct “single bounce” mechanism of sub-ps duration. We present a state-to-state kinetic model, which accurately describes the case of near complete thermalization (a regime we call the strong coupling case) and use this model to extract state-to-state rate constants. This analysis unambiguously shows that direct vibrational overtone excitation dominates the production of ν = 2 and that, within the context of our model, the intrinsic strength of the overtone transition is of the same order as the single quantum transition, suggesting a possible way to circumvent optical selection rules in vibrational pumping of molecules. This result also suggests that previous measurements of vibrational relaxation of highly vibrationally excited NO exhibiting highly efficient multi-quantum jumps (Δν ∼ −8) are mechanistically similar to vibrational excitation of NO(ν = 0).
Introduction
The physics and chemistry of interfaces plays an important role in the conversion of energy between its various forms including electrical, photonic, chemical, and thermal.1 For example in solar cells, the likelihood of photon-initiated charge-separation is strongly influenced by interfacial phenomena.2,3 While still poorly understood, there is little doubt that a structure–function relationship is central to surface reactivity4 including heterogeneous catalysis.5 Furthermore, reports that the exothermicity of chemical reactions at surfaces results in electrical currents inspire new concepts for sensor6 and energy conversion7 technology.Developing better understanding of interfacial energy conversion at the atomic level is particularly promising in studies at the gas–solid interface. Here, sophisticated dynamics methods including molecular beams8 and laser spectroscopy9 can be combined with surface analytical probes to create well defined experiments, the observations of which can be directly compared to first principles theory.10–12 This approach has led to significant insights which have been reviewed on several occasions.13–15
The interconversion of energy between molecular vibration and solid excitation is of particular interest due to the close relationship between molecular vibration and bond dissociation. Furthermore, it is here that some of the clearest evidence has become available that molecular interactions at surfaces are not purely mechanical in nature,16,17 but can also interact strongly with electrons in the solid,18 even resulting in electron emission when the transferred vibrational energy is greater than the solid's work function.19–21 In contrast, when this quantity is less than the solid's band gap, vibrational energy transfer to or from the solid is less efficient.22–24
A recent theoretical treatment of electronically non-adiabatic interactions10 has been remarkably successful at reproducing experimental observations including rotational cooling with vibrational relaxation25 and vibrational insensitivity to trapping.26
Perhaps the most interesting agreement between experiment and theory involves multi-quantum (Δν ∼ −8) vibrational relaxation of highly vibrationally excited NO(ν = 15) in collisions with a Au(111) surface. Here, sub-ps time-scale electron hopping between NO and Au results in efficient high overtone vibrational relaxation and creation of a single correspondingly high energy electron hole pair (EHP).10,18 By comparison, photon emission from NO(ν = 15) is dominated by Δν ∼ −1 transitions.27 These results demonstrate a crucial difference between electron mediated and photon mediated vibrational transitions; namely, the probability of “high overtone” transitions can be much larger in the former than in the latter. This begs the question to what extent electron mediated processes might be used to circumvent optical selection rules for vibrational overtone excitation, providing an avenue for direct pumping of many quanta into molecular vibration on the sub ps time-scale.
In principle, the mechanism of multi-quantum vibrational relaxation10 just described is consistent with one originally discussed28 in connection to single quantum vibrational excitation of small molecules on metal surfaces;16,29 however, the direct observation of multi-quantum vibrational excitation has never been reported within the context of an electron mediated energy transfer mechanism.30
In this edge article, we present results of new experiments where electron mediated multi-quantum vibrational excitation is seen for the first time. Absolute excitation probabilities result in populations of ν = 1 and 2 close to those expected for complete vibrational thermalization with the surface (strong coupling case) despite the fact that the excitation happens on a sub-ps time-scale. We present a new kinetic model capable of describing the strong (as well as the weak) coupling case and, through detailed comparison with experiment, we show that electron mediated vibrational overtone excitation proceeds with similar intrinsic efficiency to single quantum excitation, limited only by the population of suitably energetic EHPs.
The model†
The temperature dependence of vibrational excitation in molecular collisions at metal surfaces has long been known to follow an Arrhenius-like law, eqn (1), when the vibrational excitation mechanism involves energy transfer from EHPs.16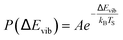 | (1) |
For example, eqn (1) breaks down in the strong coupling case – i.e. where A is large or where TS is high – as it cannot describe thermal equilibrium with the surface,31 which is clearly non-Arrhenius.
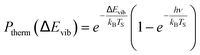 | (2) |
Another limitation of the Arrhenius analysis represented by eqn (1) is the difficulty in distinguishing between direct vibrational overtone excitation, which is expected to have the Arrhenius form:
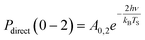 | (3) |
 | (4) |
To address these issues, we have developed a kinetic model for vibrational state changing events occurring in collisions with a metal surface that incorporates microscopic reversibility and a statistical treatment of the thermal energy distribution of metallic EHPs modelled as a Fermi gas of electrons in a three dimensional box. The model includes rate processes that describe one and two quantum excitation and de-excitation between the three lowest vibrational states: ν = 0, 1 and 2. In addition to describing deviations from eqn (1) associated with the transition to equilibrium with the surface in the strong coupling case, this model also predicts conditions where molecule–surface collisions result in multi-quantum excitation. Furthermore, the model suggests under what condition the efficiency of multi-quantum excitation will result from direct vibrational overtone up-pumping as opposed to sequential single quantum up-pumping events.
To test these ideas, we have carried out temperature dependent measurements from TS = 300–985 K of EHP mediated vibrational excitation probabilities for NO(ν = 1 and 2) in collisions of NO(ν = 0) with a Au(111) surface. We show that application of eqn (1) to these data results in an ambiguous physical interpretation concerning the importance of overtone vibrational excitation. In contrast, not only are the data well described by the new model but clear physical insights emerge. Specifically, the absolute temperature dependent excitation probabilities of NO(ν = 0) to NO(ν = 1 and 2) are correctly captured by the model when the intrinsic coupling is roughly equal for both fundamental and overtone transitions. Furthermore, if the model is adjusted to eliminate direct overtone transitions, the data cannot be accurately reproduced.
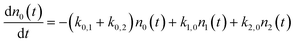
We use a simple rate equation method to describe EHP mediated energy transfer. The model includes six rate processes:
| n0 ⇌ n1 |
| n0 ⇌ n2 |
| n1 ⇌ n2 |
| k0,1 = ξ0,1*f1(TS) |
| k1,2 = ξ1,2*f1(TS) |
| k0,2 = ξ0,2*f2(TS) |
| k1,0 = ξ1,0*f−1(TS) |
| k2,1 = ξ2,1*f−1(TS) |
| k2,0 = ξ2,0*f−2(TS) |
The electronic statistics are calculated as follows. We first assume that the Fermi function:
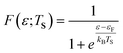
adequately describes the energy distribution of the electrons in the metal near the Fermi level. Here, εF is the Fermi energy; me is the electron mass; h is Planck's constant and V is the volume of the metal. The electron distribution is then given by:
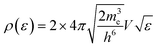
| pe(ε;TS) = F(ε,TS)*ρ(ε) |
| ph(ε;TS) = ρ(ε)*(1 − F(ε,TS)). |
| fΔv(TS) = ∫∞ε=0dε∫∞ε′=0dε′pe(ε;TS)*ph(ε′;TS)*δ(ε − ε′ − Δv*hν) |
The function fΔν(TS) represents the sum over all states where a thermally excited EHP is present whose relaxation energy is equal to the vibrational excitation, Δν > 0. Similarly, it represents the sum over all electronic states where an electron and a higher energy hole is present capable of accepting the vibrational energy, Δν < 0.32
With these definitions of the rate constants, we solve the system of differential equations analytically using the Laplace transform method,33,34 assuming initial conditions where population is found only in ν = 0.
where:
| n0(0) = 1 and n1(0) = n2(0) = 0 |
Fig. 1 shows an example of solutions for the populations, n1(t) and n2(t), derived from the rate model. Here we have assumed certain reasonable values (see figure caption) for the intrinsic coupling strengths, ξi,j, in order to examine the short and long time behaviour of the model. While the precise solution is sensitive to the choice of coupling strengths, the qualitative fact that the populations for ν = 1 and 2 are initially zero and grow to a steady-state thermal population distribution – shown as dot-dashed lines – is not.
 | ||
| Fig. 1 The approach to thermal equilibrium at TS = 1000 K. Upper panel: The solution to the kinetic equations for ξ0,2 = 0.69*ξ1,2 and ξ1,2 = ξ0,1 = 1 for the population, n, of ν = 1 (dashed) and ν = 2 (solid). The dot-dashed lines show the thermal populations for the two vibrational states. The vertical line at τeff = 0.96 represents the effective collision time derived from comparison to the NO/Au scattering data. See text. Although not shown, the population of ν = 0 also approaches the thermal value on this time-scale. Lower panel: for the case of ξ0,2 = 0.69*ξ1,2 and ξ1,2 = ξ0,1 = 0.01. | ||
It is useful to envision a physical picture to accompany the mathematical solutions obtained from the model; perhaps most importantly as this helps illuminate the assumptions of the model. We envision a molecule colliding with a surface in a direct scattering process. The model assumes that non-adiabatic coupling occurs with a constant magnitude. Thus as the molecule approaches the surface, there is some distance where the coupling turns on like a step function. It is then further assumed that the coupling remains constant during an “effective” collision time, τeff. We will show below that the vertical line in the upper panel of Fig. 1 represents the NO/Au scattering in this work and corresponds to an effective collision time of about τeff = 400 fs, within which the system comes approximately halfway to the equilibrium limit. We dub this scattering regime the strong coupling case.
Fig. 1 also shows the behaviour of the model when the coupling strength is reduced by 100 fold (lower panel), conditions that could be achieved for example by reducing the incidence energy of translation. Here, one obtains analogous growth curves that terminate in a steady state thermal population; however, the time-scale required to reach the steady state is 100 times longer. For a similar value of τeff, only about one-100th of the vibrational excitation would be observed, a regime we describe as the weak coupling case.
One may note from this comparison that when we arbitrarily fix ξ0,1, we may vary the population transfer by adjusting τeff.35 Thus in all of the comparisons with real data that we will make below, ξ0,1 = 1, as in Fig. 1 (upper panel). We then adjust the effective collision time, τeff, to describe the overall strength of coupling. We can then vary the magnitudes of ξ1,2 and ξ0,2 with respect to ξ0,1 to explore the relative importance of single and multi-quantum processes.
Observation of multi-quantum vibrational excitation
The experimental apparatus has been previously described in detail.36 In brief, we produce supersonic molecular beam pulses37 of NO with a translational energy of incidence, EI ∼ 0.9 eV, which collide at normal incidence with a Au(111) surface, whose temperature can be varied from 100–985 K within minutes38 and is held in an ultra-high vacuum chamber.39 State-specific REMPI40 detection of NO is accomplished with UV laser pulses41 and an ion detection system.42 By varying the wavelength, laser/molecular-beam pulse timing and by translating the laser beam parallel to the surface, we can measure: rotationally resolved REMPI spectra,43 temporal profiles44 and scattering angular distributions, respectively.45Fig. 2 shows angular distributions for scattered NO molecules that have undergone vibrational excitation in collisions with Au(111). The angular distributions peak at the specular angle (1.6° from the surface normal) and exhibit a FWHM of less than 40°. They are much narrower than a cosθ distribution characteristic of trapping/desorption and indicate a direct, single-bounce vibrational excitation mechanism.
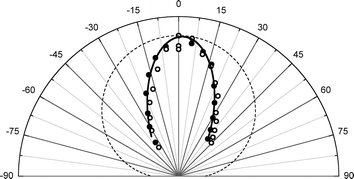 | ||
| Fig. 2 Angular distribution of the scattered beams, ν = 2 (solid circles), ν = 1 (open circles). The solid line is a cos7.3(θ − 1.6°) function and the dashed line is a cosθ function, expected if trapping/desorption was the predominant process. The absolute intensities of the two angular distributions are normalized with respect to each other to emphasize the shape of the scattered angular distribution. | ||
Fig. 3 shows rotationally resolved REMPI spectra of scattered NO(ν = 1 and 2)25 at two surface temperatures. The scattered molecules are rotationally hot (Trot ∼ 700 K) compared to the incident beam (Trot ∼ 10 K)46 and Trot is found to be only weakly dependent on TS, consistent with a direct single-bounce scattering mechanism. A glance at the figure reveals that the increase in REMPI signal with surface temperature is strong for both ν = 1 and 2 but stronger for ν = 2.
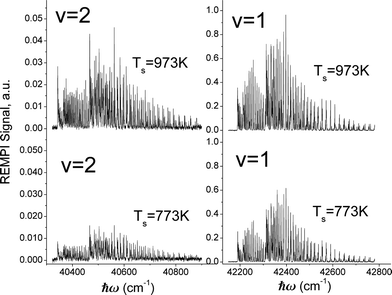
To derive the absolute vibrational excitation probabilities, data like those shown in Fig. 3 probing ν = 0, 148 and 2 were recorded between TS = 300 and 985 K, integrating the entire spectral intensity in each vibrational band. These integrated intensities were corrected for differences in temporal and angular distributions and normalized to differences in the laser power and MCP voltage.49 We also corrected for differences between each band's Franck–Condon factor.50 Ratios of these corrected signal intensities (Sν) yield absolute excitation probabilities, Pν:51

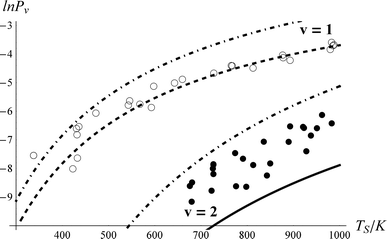
The derived values of Pν are shown in Fig. 4. At all surface temperatures in this work, P1 is at least 10× larger than P2. At TS = 985 K, P1 = 0.025, which compares well with the result P1 = 0.07 ± 0.05 reported for NO scattering from Ag(111).16,53 Also shown in Fig. 4 are the thermal limits – eqn (2) – as well as Arrhenius functions – eqn (1) – obtained by fitting in two different ways. See below. The Arrhenius activation energies (Table 1) are close to ΔEvib in all cases; however, as discussed above in relation to eqn (3), this is not sufficient to establish the importance of direct vibrational overtone excitation.
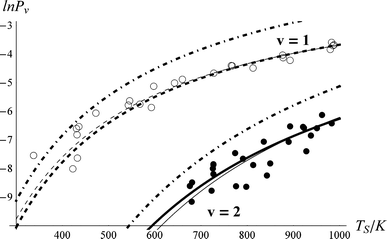 | ||
| Fig. 4 Vibrational excitation probabilities vs. surface temperature. ν = 2 (closed circles), ν = 1 (open circles). The thick lines are the canonical Arrhenius fits and the thin lines are the floating Arrhenius fits, constants for which are presented in Table 1. See text. The dot-dashed lines are the thermal limit. The data have been culled to eliminate statistical outliers.52 | ||
| Fitting parameters | Canonical Arrhenius fit | Floating Arrhenius fit | Kinetic model Arrhenius fita | |
|---|---|---|---|---|
a The coupling strength was τeff = 0.96 and the state-to-state coupling was ξ0,2 = 0.69*ξ1,2 and ξ1,2 = ξ0,1 = 1.
b The RMS is defined as follows: 
|
||||
| A | 0.39 | 0.34 | 0.41 | |
| ν = 1 | E a/cm−1 | 1904 | 1814 | 1942 |
| RMSb | 0.0014 | 0.0014 | — | |
| A | 0.46 | 0.83 | 0.45 | |
| ν = 2 | E a | 3808 | 4189 | 3798 |
| RMSb | 0.00028 | 0.00028 | — | |
Comparing observation to theory: evidence of vibrational overtone excitation
We systematically studied the behaviour of the model in close comparison to the experimental data. Although there appear to be many adjustable parameters, i.e.τeff, ξ0,1, ξ1,2 and ξ0,2, we easily find a robust fit to the data. As described above, the population transfer is determined only by the product of τeff with ξ0,1. Furthermore, we find that the fit to the data is only weakly dependent on ξ1,2. Thus in practice, for a fixed value of ξ0,1, only τeff and ξ0,2 affect the quality of the fit to the data. Furthermore, these two fitting parameters are nearly independent of one another, τeff effectively controlling the probability of 0-1 vibrational excitation and ξ0,2 the branching fraction to ν = 2.Fig. 5 shows the best fit54 to the data. Comparing to the thermal limit (dot-dashed curves) and noting the derived value of τeff = 0.96, one can clearly see that NO scattering from Au(111) at this incidence energy is an example of strong electronically non-adiabatic coupling. Referring to Fig. 1, one can see that this value of τeff represents a coupling strength that brings the system roughly halfway to the thermal limit.
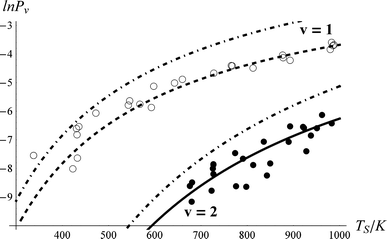 | ||
| Fig. 5 Comparison of experimental NO vibrational excitation probabilities (Pν) to the kinetic model. The effective collision time was τeff = 0.96, and the state-to-state coupling was ξ0,2 = 0.69*ξ1,2 and ξ1,2 = ξ0,1 = 1. The closed and open circles are experimental data for ν = 2 and 1, respectively. The solid and dashed lines are the results of the kinetic model. The dot-dashed lines are the thermal expectation. | ||
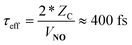
In passing, we note that one may estimate τeff and hence the absolute time-scale of the plot in the upper panel of Fig. 1. A recent paper of ours identified a critical distance for vibrationally promoted electron emission,21ZC ∼ 5 Å, which despite several important differences we take to be characteristic of the interaction distance for vibrational excitation in this work at least for the purpose of estimation. From the measured velocity of the NO molecular beam, vNO, we estimate the round trip time of the collision, τeff, within a constant velocity approximation:
In characterizing the excitation to NO(ν = 2) it is important to distinguish between direct and sequential excitation. Since production of NO(ν = 1) is always at least 10× more efficient than production of NO(ν = 2) under our conditions, it is reasonable to think that NO(ν = 2) might be produced by two single-quantum excitation steps and not by a vibrational overtone mechanism.
Fig. 6 shows the impact on the fit if vibrational overtone pumping is neglected, that is setting ξ0,2 = 0. While this change has no noticeable effect on the predicted ν = 1 populations, the ν = 2 excitation probability is dramatically underestimated. To obtain a reasonable fit when overtone pumping is neglected ξ1,2 has to become unreasonably large, ξ1,2 > 20*ξ0,1. There is no reason to think that ξ1,2 should be much larger than ξ0,1, as indicated by the full fit. In contrast, one may start with the best fit parameters of Fig. 5 and change ξ1,2 to 0, with no detectable effect on the fit.
 | ||
| Fig. 6 The importance of vibrational overtone excitation. This is the resulting fit if ξ0,2 = 0. Otherwise, the fitting parameters are identical to those of Fig. 5. The Arrhenius parameters obtained for the 0-2 excitation in the sequential mechanism (solid line) are A = 0.11 and Ea = 3931 cm−1. | ||
Therefore, we conclude that ν = 2 is predominantly populated by direct vibrational overtone excitation. Indeed, the best fit results – ξ0,2 = 0.69*ξ0,1 – suggest that the multi-quantum vibrational excitation is about as strong as single quantum excitation. This contrasts starkly with optical overtone transition probabilities. For example for NO, the 1st optical overtone strength is 0.015 that of the fundamental.56
Prior to the kinetic model presented in this edge article, it has been customary to compare the TS-dependence of vibrational excitation data to an Arrhenius relation:

Table 1 shows derived results for A and Ea using both the canonical and floating methods as well as the root-mean-square (RMS) deviations of the fits. Also see Fig. 4. It is immediately obvious that one cannot distinguish the canonical from the floating fit based on a goodness of fit criterion. This ambiguity results from the finite noise associated with the data and the resulting statistical correlation between A and Ea.
This ambiguity limits our ability to interpret the meaning of the derived parameters, A and Ea. According to the canonical fit results, the ratio of the A-factors is 0.46/0.39 = 1.2, while the floating fit gives a larger ratio of ∼2.5. Interestingly, by fitting the results of the kinetic model to an Arrhenius form, letting both A and Ea be optimized, we find excellent agreement with the canonical results. See the last column of Table 1. This reflects the underlying correctness of the canonical Arrhenius picture, which can, in fact, be written in terms of the kinetic model of this edge article, a topic that will be treated in detail in a future publication.57
Conclusions
We have shown that electron mediated vibrational overtone excitation can be observed experimentally and, employing a new kinetic model in comparison to the data, that the intrinsic overtone transition strength is of the same order as that of the fundamental transition. While this study looked specifically at thermal EHP populations, these results imply that many quanta of vibration might be excited in a molecule due to a surface collision, if the electron energy distribution in the solid were suitably prepared, for example by photo-excitation. This might provide a subtle approach to circumventing optical selection rules for vibrational excitation. This work furthermore suggests that the electron hopping mechanism used to explain multi-quantum vibrational relaxation of NO(ν = 15) in collisions with a Au(111) surface10 can also be applied to describe vibrational excitation of NO(ν = 0).Acknowledgements
The authors gratefully acknowledge financial support from the Department of Energy Office of Basic Energy Sciences, under Grant No. DE-FG02-03ER15441 as well as the Partnership for International Research and Education—for Electronic Chemistry and Catalysis at Interfaces—NSF Grant No. OISE-0530268. AMW would like to acknowledge the Max Planck Institute for Biophysical Chemistry and Institute for Physical Chemistry at the University of Göttingen for support during a sabbatical stay that accelerated the appearance of this edge article.Notes and references
- G. A. Somorjai, H. Frei and J. Y. Park, J. Am. Chem. Soc., 2009, 131, 16589–16605 CrossRef CAS.
- B. A. Gregg, J. Phys. Chem. B, 2003, 107, 4688–4698 CrossRef CAS.
- A. Ennaoui, S. Fiechter, C. Pettenkofer, N. Alonsovante, K. Buker, M. Bronold, C. Hopfner and H. Tributsch, Sol. Energy Mater. Sol. Cells, 1993, 29, 289–370 CrossRef CAS.
- J. Rempel, J. Greeley, L. B. Hansen, O. H. Nielsen, J. K. Norskov and M. Mavrikakis, J. Phys. Chem. C, 2009, 113, 20623–20631 CrossRef CAS.
- K. Reuter and M. Scheffler, Phys. Rev. B, 2002, 65, 035406 CrossRef.
- B. Gergen, H. Nienhaus, W. H. Weinberg and E. W. McFarland, Science, 2001, 294, 2521–2523 CrossRef CAS.
- J. Y. Park and G. A. Somorjai, ChemPhysChem, 2006, 7, 1409–1413 CrossRef CAS.
- R. D. Beck, P. Maroni, D. C. Papageorgopoulos, T. T. Dang, M. P. Schmid and T. R. Rizzo, Science, 2003, 302, 98–100 CrossRef.
- E. H. G. Backus, A. Eichler, A. W. Kleyn and M. Bonn, Science, 2005, 310, 1790–1793 CrossRef CAS.
- N. Shenvi, S. Roy and J. C. Tully, Science, 2009, 326, 829–832 CrossRef CAS.
- P. Nieto, E. Pijper, D. Barredo, G. Laurent, R. A. Olsen, E. J. Baerends, G. J. Kroes and D. Farias, Science, 2006, 312, 86–89 CrossRef CAS.
- G. J. Kroes, Prog. Surf. Sci., 1999, 60, 1–85 CrossRef CAS.
- L. B. F. Juurlink, D. R. Killelea and A. L. Utz, Prog. Surf. Sci., 2009, 84, 69–134 CrossRef CAS.
- A. M. Wodtke, D. Matsiev and D. J. Auerbach, Prog. Surf. Sci., 2008, 83, 167–214 CrossRef CAS.
- A. M. Wodtke, J. C. Tully and D. J. Auerbach, Int. Rev. Phys. Chem., 2004, 23, 513–539 CrossRef CAS.
- C. T. Rettner, F. Fabre, J. Kimman and D. J. Auerbach, Phys. Rev. Lett., 1985, 55, 1904–1907 CrossRef CAS.
- V. Krishna and J. C. Tully, J. Chem. Phys., 2006, 125, 6.
- Y. H. Huang, C. T. Rettner, D. J. Auerbach and A. M. Wodtke, Science, 2000, 290, 111–114 CrossRef CAS.
- J. D. White, J. Chen, D. Matsiev, D. J. Auerbach and A. M. Wodtke, Nature, 2005, 433, 503–505 CrossRef CAS.
- J. D. White, J. Chen, D. Matsiev, D. J. Auerbach and A. M. Wodtke, J. Chem. Phys., 2006, 124, 13.
- N. H. Nahler, J. D. White, J. Larue, D. J. Auerbach and A. M. Wodtke, Science, 2008, 321, 1191–1194 CrossRef CAS.
- H. C. Chang and G. E. Ewing, Phys. Rev. Lett., 1990, 65, 2125–2128 CrossRef CAS.
- M. Korolik, M. M. Suchan, M. J. Johnson, D. W. Arnold, H. Reisler and C. Wittig, Chem. Phys. Lett., 2000, 326, 11–21 CrossRef CAS.
- A. M. Wodtke, Y. H. Huang and D. J. Auerbach, J. Chem. Phys., 2003, 118, 8033–8041 CrossRef CAS.
- A. M. Wodtke, Y. H. Huang and D. J. Auerbach, Chem. Phys. Lett., 2005, 414, 138–142 CrossRef CAS.
- A. M. Wodtke, H. Yuhui and D. J. Auerbach, Chem. Phys. Lett., 2005, 413, 326–330 CrossRef CAS.
- M. Drabbels and A. M. Wodtke, J. Chem. Phys., 1997, 106, 3024–3028 CrossRef CAS.
- J. W. Gadzuk and S. Holloway, Phys. Rev. B, 1986, 33, 4298–4300 CrossRef CAS.
- E. K. Watts, J. L. W. Siders and G. O. Sitz, Surf. Sci., 1997, 374, 191–196 CrossRef CAS.
- It should be noted that multi-quantum vibrational excitation has been reported for collisions of NH3 with Au(111), but there the mechanism is thought to be purely mechanical in nature. See: B. D. Kay, T. D. Raymond and M. E. Coltrin, Phys. Rev. Lett., 1987, 59, 2792–2794 Search PubMed.
- Eqn (2) is derived from the canonical partition function of the simple harmonic oscillator with vibrational frequency ν, where h is Planck's constant.
- To adapt the model to an anharmonic oscillator would require slight changes where, for example, the statistical factor for 2-1 transitions would be slightly different than for 1-0 transitions.
- B. Davis, Integral Transforms and their Applications, 3rd edn, Springer Verlag, New York, 2002 Search PubMed.
- G. A. Korn and T. M. Korn, Mathematical Handbook for Scientists and Engineers, 2nd edn, McGraw-Hill Companies, New York, 1967 Search PubMed.
- This turns out to be a practical way to implement the model, but means that the time units are no longer absolute. One may establish absolute time units in a post-facto analysis – vide infra.
- Q. Ran, D. Matsiev, A. M. Wodtke and D. J. Auerbach, Rev. Sci. Instrum., 2007, 78, 104104 CrossRef.
- 2.5% NO seeded in H2 was expanded through a piezoelectrically actuated pulsed valve with a stagnation pressure near 3 atm. The valve opening time was ∼60 μs. The molecular beam is skimmed and passes through two regions of differential pumping before entering an ultra high vacuum surface science chamber.
- The gold crystal can be resistively heated by passing electric current through its tungsten support wires and conductively cooled with liquid N2.
- The base pressure in the surface chamber is ∼1 × 10⁻¹⁰ Torr and reaches ∼1 × 10⁻⁹ Torr with the molecular beam running. The main surface impurity is carbon. The surface is cleaned by sputtering with 3 kV Ar+ for at least 30 min and subsequently annealed at 1000 K for at least 30 min. The surface cleanliness was verified using Auger electron spectroscopy. Based on the Auger spectra we estimate the impurities to be below 3% of a monolayer of coverage after sputtering and annealing. Furthermore, we measured before and after scattering and never found evidence for C-building up over the several hours measurement time.
- 1 + 1 resonance enhanced multiphoton ionization (REMPI) of NO(ν = 1) was accomplished via A-X(0,1) transition using coumarin 480. NO(ν = 2) REMPI spectra were recorded via A-X(0,2) transition using coumarin 503, sometimes in a mixture with coumarin 480. NO(ν = 0) REMPI spectra, which were necessary for deducing the absolute excitation probabilities were monitored via A-X(0,0) transition, using coumarin 450. The dye laser is pumped with the third harmonic of a Nd:YAG laser. The output of the dye laser was doubled in a BBO crystal.
- 5 ns duration, 2–4 mJ pulse energy, 0.5 cm−1 bandwidth and ∼250 nm wavelength.
- The ions resulting from REMPI are guided to a two-stage microchannel plate (MCP) detector by a repeller and two electrostatic focusing lenses.
- The rotational distributions of scattered NO(ν = 0,1,2) were recorded at the peaks of the temporal and angular distributions.
- Temporal profiles were recorded by fixing the dye laser's wavelength on a specific rotational line and varying the delay between the laser and molecular beam pulses.
- The temporal and angular distributions were independent of the chosen rotational transition.
- Rotationally resolved 1 + 1 REMPI spectra of NO were recorded via the A(ν′ = 0)←X(ν′′ = 0,1,2) bands after scattering from the surface. These bands were chosen because they are spectrally well isolated. Thus, we may integrate the measured REMPI intensity over the entire rotational distribution of a specific vibrational state. This simplifies the data analysis, eliminating the need to take into account variations of the rotational temperature in the scattered NO that results from changing the surface temperature and/or vibrational state.
- The x-axis is the one-photon energy of the 1 + 1 REMPI process.
- For measurements of ν = 1, a small background was subtracted that arises from rotationally inelastic scattering of thermally populated NO(ν = 1) present in the molecular beam. The background level was determined by extrapolating the surface temperature dependence of the NO(ν = 1) signal to 0 K using a suitable Arrhenius expression.
- Angular and temporal profiles of the scattered NO(ν = 0,1,2) were measured for the entire range of surface temperatures used in this work. The 1 + 1 REMPI signal of the scattered NO(ν = 0,1,2) was found to vary linearly with the laser intensity (2–4 mJ), The voltage across the MCP was adjusted for each vibrational state with respect to the scattered signal intensity to avoid saturation. The variation of a small scattered signal with the voltage across the MCP detector was measured over the entire range of the MCP voltages used in this work to allow for signal normalization under different detection conditions.
- J. Luque and D. R. Crosley, J. Chem. Phys., 1999, 111, 7405–7415 CrossRef CAS.
- The outgoing velocity of the scattered molecules was assumed to be independent of vibrational state. Thus no flux-density correction was performed. See: I. Rahinov, R. Cooper, C. Yuan, X. M. Yang, D. J. Auerbach and A. M. Wodtke, J. Chem. Phys., 2008, 129 Search PubMed.
- The term “culled” refers to a statistical analysis that was carried out on the data to determine if any points are statistical outliers. To accomplish this a canonical fit to the data was carried out and the standard deviation of the fit to the data was determined. Any points that were more that 2.5σ from the canonical Arrhenius curve were then eliminated and the canonical fitting was repeated. This process was iterated until all points were within 2.5σ of the canonical Arrhenius fit. This resulted in removal of 2 points for the ν = 2 data and 5 points for the ν = 1 data. If errors were random, points outside 2.5σ represent 0.04% of the distribution.
- Absolute excitation probabilities for NO on Cu(110) appear close to or beyond the thermal limit, possibly reflecting the difficulty of the measurements. See ref. 29.
- The root mean square deviation of the fit was minimized by hand.
- The 1/e time to equilibrium can be found easily and is ∼700 fs.
- Y. P. Lee, S. L. Cheah and J. F. Ogilvie, Infrared Phys. Technol., 2006, 47, 227–239 CrossRef CAS.
- The pre-factor, A, is related to the channel specific coupling of molecular vibration to EHPs. In a soon to be published paper, we will present simple analytical expressions for the Arrhenius constants in terms of the fundamental parameters of the kinetic model of this paper.
Footnotes |
| † Electronic supplementary information (ESI) available: The Mathematica Notebook used to analyze the data in this edge article using the multi-quantum kinetic model. See DOI: 10.1039/c0sc00141d |
| ‡ Present address: Department of Particle Physics and Astrophysics, Weizmann Institute of Science, Rehovot 76100, Israel. |
| This journal is © The Royal Society of Chemistry 2010 |