Thermochemical biofuel production in hydrothermal media: A review of sub- and supercritical water technologies
Andrew A. Petersonab, Frédéric Vogelb, Russell P. Lachancec, Morgan Frölingd, Michael J. Antal, Jr.e and Jefferson W. Tester*a
aDepartment of Chemical Engineering, Massachusetts Institute of Technology, Cambridge, MA, USA. E-mail: testerel@mit.edu
bLaboratory for Energy and Materials Cycles, Paul Scherrer Institut, Villigen, Switzerland
cUnited States Military Academy, West Point, NY, USA
dDepartment of Chemical and Biological Engineering, Chalmers University of Technology, Göteborg, Sweden
eHawaii Natural Energy Institute, University of Hawaii at Manoa, Honolulu, Hawaii, USA
First published on 9th July 2008
Abstract
Hydrothermal technologies are broadly defined as chemical and physical transformations in high-temperature (200–600 °C), high-pressure (5–40 MPa) liquid or supercritical water. This thermochemical means of reforming biomass may have energetic advantages, since, when water is heated at high pressures a phase change to steam is avoided which avoids large enthalpic energy penalties. Biological chemicals undergo a range of reactions, including dehydration and decarboxylation reactions, which are influenced by the temperature, pressure, concentration, and presence of homogeneous or heterogeneous catalysts. Several biomass hydrothermal conversion processes are in development or demonstration. Liquefaction processes are generally lower temperature (200–400 °C) reactions which produce liquid products, often called “bio-oil” or “bio-crude”. Gasification processes generally take place at higher temperatures (400–700 °C) and can produce methane or hydrogen gases in high yields.
Andrew Peterson is a PhD candidate in the laboratory of Jefferson Tester at the Massachusetts Institute of Technology. In addition to his research on chemical and physical processes in hydrothermal media, Andy is active in the energy community at MIT, having recently served as the co-director of content for the 2008 MIT Energy Conference. |
Frédéric Vogel is the head of the Catalytic Process Engineering Group at the Paul Scherrer Institut in Switzerland. He received his Diploma in Chemical Engineering in 1992 and his PhD in 1997, both from ETH Zürich. After working as a postdoctoral researcher in Professor Tester’s group at MIT for two years, Frédéric joined the Paul Scherrer Institut in the year 2000. |
Russell Lachance is an Academy Professor in the Department of Chemistry & Life Science at the United States Military Academy (USMA) in West Point, New York. He is a Colonel in the U.S. Army with over 23 years of service in various positions around the world. |
Morgan Fröling is a project leader at Chalmers University of Technology in Sweden. Morgan holds an MSc in Chemical Engineering and a PhD in Chemical Environmental Science from Chalmers. Before returning to teach at Chalmers, Morgan worked as a business consultant at CIT Ekologik, Sweden, and in a two year fellowship at the MIT Laboratory for Energy and the Environment. |
Michael Antal occupies the Coral Industries Chair of Renewable Energy Resources within the Hawaii Natural Energy Institute of the University of Hawaii. He is author or co-author of more than 100 peer-reviewed archival publications and 11 patents and patents pending. His citation record is in the top 1% of total citations in all fields of engineering. |
Jefferson Tester is the H.P. Meissner Professor of Chemical Engineering at the Massachusetts Institute of Technology. For three decades he has been involved in chemical engineering process research as it relates to renewable and conventional energy extraction and conversion and environmental control technologies. |
1. Introduction
This review deals with technologies for converting biomass into liquid and gaseous fuels in hydrothermal media, which we define as a water-rich phase at temperatures above about 200 °C and at sufficient pressures to keep the water in either a liquid or supercritical state.† Hydrothermal processing offers a number of potential advantages over other biofuel production methods, including high throughputs, high energy and separation efficiency, the ability to use mixed feedstocks like wastes and lignocellulose, the production of direct replacements for existing fuels, and no need to maintain specialized microbial cultures or enzymes. Hydrothermal processing also offers unique possibilities in coordination with other biofuel processing techniques, including as a pretreatment step or for post-fermentation reforming. In addition, because of the high temperatures involved, biofuels produced would be free of biologically active organisms or compounds, including bacteria, viruses, and even prion proteins. A schematic overview of hydrothermal processing is shown in Fig. 1.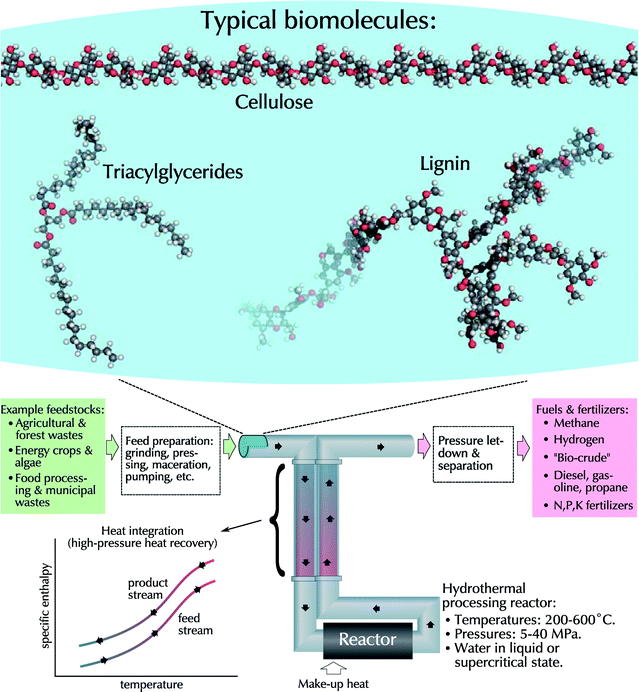 | ||
| Fig. 1 Conceptual schematic of hydrothermal processes. Biomass feedstocks (top), including cellulose, triacylglycerides, and lignin, are processed in the aqueous phase. The lack of a phase change (bottom-left) allows for increased heat recovery. | ||
However, many engineering challenges remain for hydrothermal processing. These include unknown or largely uncharacterized reaction pathways and kinetics, inadequate catalysts which do not withstand hydrothermal conditions, inadequate solid management practices that lead to precipitation of inorganic materials and can result in fouling and plugging issues, and a need for specialized materials to withstand the high-temperature, high-pressure, and often corrosive environments of hydrothermal media.
This review summarizes the state of knowledge with respect to biomass processing in hydrothermal media, including a review of characteristic chemical reactions and of the main processing methods employed for biomass conversion to liquid and gaseous fuels.
1.1. Biomass potential and availability
Recently there has been renewed interest worldwide in producing biofuels from a range of biomass feedstocks. Meeting today's energy needs of the transportation sector is particularly challenging as it requires liquid combustible fuels that can fit into our existing hydrocarbon fuel infrastructure. For many developed countries, including the U.S., Japan, and many European countries, crude oil and refined petroleum products must be imported in large amounts to meet transportation fuel demands. While the public tends to emphasize the economic and political stresses associated with imported oil, environmental issues surrounding emissions of carbon dioxide from vehicles creates challenges that are equally daunting given the large number of these mobile emission sources. Renewable and nuclear energy technologies are viewed by many as long term solutions, but only renewable biomass has the ability to directly generate hydrocarbon-based liquid fuels that could approach carbon neutrality.The two major chemical pathways to biofuels that are commercially pursued today are fermentation of starches (primarily from corn grain or sugar cane) to ethanol and transesterification of fatty acids from soy, canola and other natural oils to biodiesel. In both cases, agricultural products are being produced as feedstocks for biofuels rather than as food for humans or feed for animals. The net energy balance and impacts on land and water resources across the full life cycle of these biofuels are variable and highly dependent on many factors, but are marginally favorable at best. For example, Fig. 2 shows the range of reported energy efficiencies for corn grain ethanol production reported in a recent MIT study by Johnson and co-workers.1 They analyzed the statistical variance of crop production and biomass to ethanol conversion conditions in the U.S. and showed that net energy efficiencies for producing ethanol from corn grain varied from about +30% to −10% depending on the intensity level of farming (fertilizer, irrigation, and agricultural chemicals needed) and the efficiency of the conversion and separation processes used.
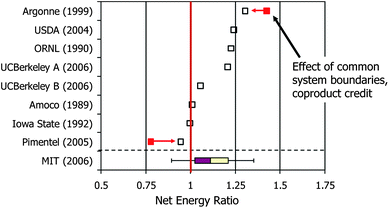 | ||
| Fig. 2 Net energy ratio for producing ethanol from corn grain. The net energy ratio is defined as the energy content of a unit mass of ethanol produced divided by the total energy inputs required to produce it. (Adapted from Johnson.1 References: Argonne (1999),2 USDA (2004),3 ORNL (1990),4 UCBerkeley A (2006) & UCBerkeley B (2006),5 Amoco (1989),6 Iowa State (1992),7 Pimentel (2005),8 MIT (2006).1) | ||
Also as shown by Johnson et al. (in Fig. 3), only about 1/3 of the total energy consumed in producing ethanol is associated with the production of the corn (including planting, harvesting, irrigation, fertilizer, and transport); 2/3 of the energy needed is associated with the manufacturing plant that converts the corn to ethanol. Approximately 50% of the total energy requirements are consumed by two steps alone: distillation and drying. These two inefficient steps are primarily a result of the energy requirements to volatilize water. As will be further discussed in Section 1.2, hydrothermal technologies can largely avoid energetic sinks associated with the evaporation of water and can thus result in more efficient processing of biomass.
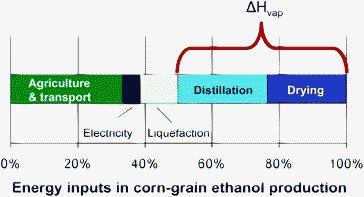 | ||
| Fig. 3 Distribution of energy requirements for producing ethanol from corn grain. Adapted from Johnson.1 Distillation and drying, both related to the enthalpy of vaporization of water, ΔHvap, make up about half of the total. | ||
Given the limitations of using grain feedstocks for biofuel production, much research and development is currently focused on using residuals, wastes and low intensity energy crops (such as switchgrass, poplar, willow, and algae) as feedstocks. While this transition can increase the amount of biofuel that could be produced, transitioning to residuals can ideally also reduce energy inputs and reduce other environmental impacts. There are many challenges, from the production, harvesting, and storage of the biomass itself to its chemical transformation to a useful fuel. A major focus now is on developing economically acceptable processes for sustainable feedstocks that primarily consist of lignocellulose or fatty acids or oils, as shown in Table 1. Full life cycle analysis is now commonly used to evaluate the energetic and environmental efficiencies of proposed processes.
| Substance | Chemical formula | Structural information |
|---|---|---|
| Feedstocks | ||
| Cellulose | [C6H10O5]n | n ≈ 500–10![[thin space (1/6-em)]](https://www.rsc.org/images/entities/char_2009.gif) 000; β (1 → 4) linkages between glucose residues 000; β (1 → 4) linkages between glucose residues |
![[hair space]](https://www.rsc.org/images/entities/char_200a.gif) | ||
| Hemicellulose | Typical monomers: [C5H8O4], [C6H10O5] | Branched with variable monosaccharide residues; degree of polymerization ∼500–3000 |
| ||
| Lignin | Typical monomers: | Polymer of aromatic subunits in random structure (see Fig. 1); molecular weight: >10000 Da |
| ||
| Triacylglycerides (fats) | RCOO–CH2CH(R′COO)CH2–(R″COO) | RCOO, R′COO, R″COO are fatty acids with ester linkages to the glycerol backbone |
| ||
| Proteins | [NHCH(R)C(O)]n | Monomer is amino acid residue with various side (R) groups; n ≈ 50–2000 |
| ||
| Intermediates | ||
| Glucose | C6H12O6 | Exists as 6-membered ring, 5-membered ring, and open chain (see Fig. 9) |
| ||
| Xylose | C5H10O5 | Exists as 6-membered ring, 5-membered ring, and open chain |
| ||
| Amino acid | H2NCH(R)COOH | R is the side group, varies from H to heterocyclic group |
| ||
| Fatty acid | RCOOH | R is an alkyl group, typically of 12–20 carbons with 0–4 double bonds |
| ||
| 5-Hydroxymethylfurfural | 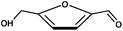 | |
| ||
| Furfural |  | |
1.2. Suitability of hydrothermal technologies for mixed waste streams
A recent evaluation of biofuels production in Science suggested that supercritical fluids may be well-suited to enhance the chemical transformation of biofeedstocks to useful liquid and gaseous fuels.9 The basic concept being pursued by many researchers is that reactions and separations in certain supercritical fluids might have advantages over conventional biochemical processing methods. Hydrothermal processing carried out near and above the critical point of water (374 °C, 22 MPa) is attractive for biomass conversion for three main reasons:An ancillary advantage of hydrothermal processing is that product streams are completely sterilized with respect to any possible pathogens including biotoxins, bacteria or viruses. In addition, temperatures and exposure times are usually sufficiently high—250 °C or greater for a few seconds—to destructively hydrolyze any proteins present so that even prions would be destroyed. (Research in the food industry shows 22D destruction of prions in just 1 min at 160 °C.10 D refers to a “decimal reduction”, meaning 90% of the infectious material is destroyed. For 22D destruction, hypothetically only 0.122 of the infectious material could survive the treatment.) This detoxification feature has also been demonstrated for complex mixed feeds from pharmaceutical production undergoing supercritical water oxidation.11
Hydrothermal processing can be divided into three main regions, liquefaction, catalytic gasification, and high-temperature gasification, depending on the processing temperature and pressure as shown in Fig. 4. The pressure-temperature phase diagram for pure water is superimposed to highlight the regions with respect to water's liquid–vapor co-existence behavior. Hydrothermal conversion via liquefaction pathways occurs generally between about 200 and 370 °C, with pressures between about 4 and 20 MPa, sufficient to keep the water in a liquid state. At near-critical temperatures up to about 500 °C, effective reforming and gasification generally requires catalytic enhancement to achieve reasonable rates and selectivity. At higher temperatures above 500 °C, homogeneous gasification and thermolysis often occur. Sections 3 and 4 of this article review hydrothermal technologies in these three thermal regions.
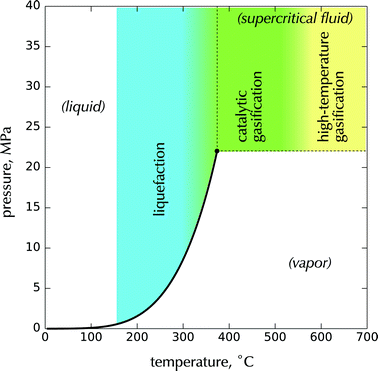 | ||
| Fig. 4 Hydrothermal processing regions referenced to the pressure–temperature phase diagram of water. | ||
These three regions take advantage of substantial changes in the properties of water that occur in the vicinity of its critical point at 374 °C (Tc) and 22 MPa (Pc). By moving from subcritical to supercritical temperatures at pressures above Pc we can control both the rate of hydrolysis as well as phase partitioning and solubility of components so that more chemically and energetically favorable pathways to gaseous and liquid biofuels may be released.
In the region near the critical point, water is highly compressible. For example, the density decreases nearly two orders of magnitude without a change in phase from liquid-like (about 800 kg m−3) to dense gas-like (about 150 kg m−3) conditions as the temperature is increased from 300 to 450 °C. These changes in density correlate with other macroscopic properties to reflect changes at the molecular level such as solvation power, degree of hydrogen bonding, polarity, dielectric strength, molecular diffusivity, and viscosity.
Fig. 5 illustrates the range of property variations that occur. For example, if we start with pure liquid water at 30 MPa and 25 °C and heat it to temperatures above its critical temperature of 374 °C, enormous changes in solvation behavior of water occur where it transforms from a polar, highly hydrogen-bonded solvent to behavior more typical of a non-polar solvent like hexane. Specifically, the dielectric constant decreases from about 80 at 25 °C to less than 2 at 450 °C, the ion product (Kw) first increases from 10−14 to 10−11 just below 350 °C and then decreases by five orders of magnitude or more above 500 °C. The ion product, or self-ionization constant, is defined as the product of the concentrations of the acidic and basic forms of water, Kw ≡ [H3O+][OH−], in units of mol2 kg−2.
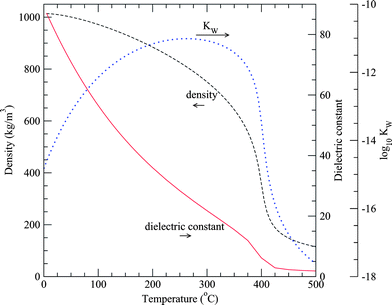 | ||
| Fig. 5 Density,12 static dielectric constant13 and ion dissociation constant (Kw)14 of water at 30 MPa as a function of temperature. The dielectric constant of water drops drastically as water is heated, and approaches that of a (room-temperature) non-polar solvent at supercritical conditions. | ||
Because we are avoiding a specific phase change when heating at pressures greater than Pvap(T) or Pc, the specific energy requirements needed to effect the isobaric expansion from liquid-like to gas-like densities are typically lower than what is needed when boiling occurs under subcritical pressures at an intermediate temperature to form a two-phase mixture.
Another aspect of hydrothermal processing that can have significant advantages over other biomass processing methods is in the area of separations. Because we have the ability to tune the solvation properties of water in the highly compressible near-critical region, partitioning of products or by-products into separate phases can be used to separate and purify products. Fig. 6, 7 and 8 illustrate the sensitivity of solubility to temperature at high pressures for inorganic ionic compounds, for simple organic compounds, and for lipids. Additionally, gases including nitrogen,15 air and oxygen,16 carbon dioxide,17 hydrogen18 and methane19 all exhibit complete miscibility with supercritical water. One can rapidly alter solubility and selectively phase partition, precipitate or dissolve certain components by changing temperature or pressure in the near-critical region.
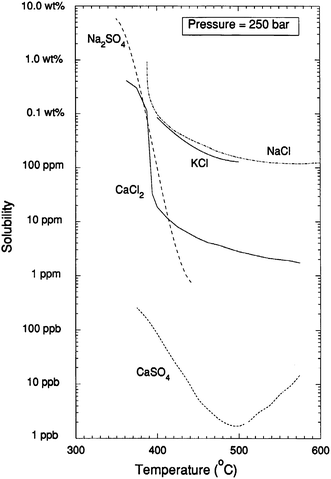 | ||
| Fig. 6 The solubility limits of various salts at 25 MPa. From Armellini.20 | ||
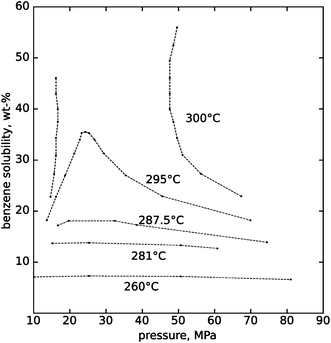 | ||
| Fig. 7 Benzene solubility in high-pressure water, as measured by Connolly.21 At temperatures of 295 °C and below, a solubility limit exists at all pressures. At 300 °C and above, the phases become completely miscible between 17 and 47 MPa. | ||
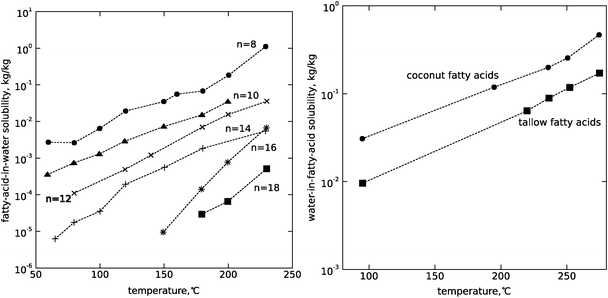 | ||
| Fig. 8 (Left) The solubility of saturated fatty acids in water at 15 MPa, adapted from Khuwijitjaru et al.117n is the carbon number of each fatty acid. (Right) The solubility of water in fatty acids at the vapor pressure of the system, from Mills and McClain.118 | ||
1.3. Related processes in supercritical water
Much of the industrial processing knowledge in the field of hydrothermal processing comes from two application areas: (1) supercritical-water oxidation, and (2) supercritical-water power generation cycles.Oxidation in supercritical water has been effectively employed to detoxify and remediate a wide range of organic and biological wastes. The original supercritical water oxidation (SCWO) process was developed in the early 1980s22,23 based on research at MIT by Modell and co-workers in the late 1970s and has been deployed at both pilot and demonstration scales commercially in the U.S., Europe, and Asia. SCWO has been shown to be very effective in industrial, military, and municipal waste treatment applications in achieving high destruction and removal efficiencies with very short residence times of 1 min or less; for dilute aqueous wastes containing 1 to 20 wt% organics. In principle, SCWO is not only more effective but also more environmentally acceptable and economical than incineration or selective absorption for many waste treatment applications. Because the oxidation process is carried out in water, SCWO does not require drying as is needed in incineration. Also because the supercritical process is fully contained, there are no vapor emissions or stack releases of products of incomplete combustion.
The basic approach of SCWO brings together water, oxygen, and organic compounds along with any heteroatoms that are present, such as N, S, P, or Cl, at supercritical temperatures of 400 °C or more and supercritical pressures greater than 22 MPa, typically about 25 MPa. Under these conditions, a single fluid reaction phase exists that can rapidly be oxidized or mineralized to form CO2, H2O and mostly molecular nitrogen (N2) with some N2O, but without forming NOx compounds, NH3 or other toxic products of incomplete combustion. Sulfur, phosphorus, and chlorine heteroatoms are oxidized to form their inorganic acids—H2SO4, H3PO4, and HCl—which can be neutralized to form salts using a suitable base. Above 450 °C and at 25 MPa, these salts become nearly insoluble and can be precipitated and removed from the fluid stream.
Because of these applications and other possible uses of supercritical water for synthetic transformations, a number of research groups have been active in characterizing and modeling phase and chemical reactions over a full range of scales from laboratory to demonstration plants. Interested readers can consult a number of excellent review articles, for example for general treatments of the SCWO process itself and related technologies, see Thomason and Modell, 1984;24 Modell, 1989;25 Shaw et al., 1991;26 Tester et al., 1993;27 Tester and Cline, 1999;28 Gloyna and Li, 1998;29 and Marrone et al., 2007.30,31 For reviews specific to reaction mechanisms and kinetics in supercritical water see Savage et al., 199532 and Akiya et al., 200233 or for salt management technology see Hodes et al., 200434 and Marrone et al., 2004.35
Catalytic methane reforming in the presence of supercritical water has also been investigated in order to identify a single-step method for producing higher alkanes, a liquid product such as methanol, or hydrogen gas. A promising catalyst and reaction conditions have recently been identified in our laboratory at MIT that gave over 90% methane conversion to produce a hydrogen-rich gas with nearly stoichiometric CO2 content at 14 second residence time.36
Supercritical and hydrothermal media may also be attractive for upgrading problematic unconventional fossil feedstocks such as heavy oils and tar sands. Again using the fact that the physical properties of water near its critical point vary significantly with temperature and pressure, water can act both as solvent and reactant in reforming processes.
Industrially, the largest use of supercritical water is in steam cycles for electric power generation; for a new coal power plant, a pulverized-coal/supercritical-steam cycle is “presently the choice of new coal-fired utility plant worldwide”.37 Although chemical reactions are not taking place in these systems, much can be learned about engineering and materials of construction from power generation applications, which operate with water at conditions of up to about 590 °C and 35 MPa.38
1.4. Other sources of information on hydrothermal biomass processing
A number of prior reviews and reports have been published on various aspects of hydrothermal biomass processing over the years.39–41 Additionally, meetings sponsored by the International Energy Agency have been held every 3 to 4 years since 1981 that bring together scientists and engineers working on thermochemical methods of biomass processing; the published proceedings of these conferences have a wealth of information.42–46Much of our understanding of chemical reactions and behavior in hydrothermal systems has resulted from research in other fields. For example, reactions of lignocellulose and related compounds in hydrothermal systems have been investigated by researchers in the forest products industy (see, for example, Bobleter39). The field of evolutionary biology has produced many insights into natural processes involving other biochemicals, such as amino acids and the synthesis of hydrocarbons, and is motivated by the discovery of and proposed origin of life around hydrothermal vents in the ocean floor (for example, Simoneit47). The geochemistry literature contains extensive information on reactions and behavior of both organic (for example, Katritzky et al.287) and inorganic (for example, Hack et al.48) compounds.
1.5. Scope of the review
This review focuses on the underlying chemistry and engineering science associated with hydrothermal processing of a range of biomass feedstocks and processing conditions. Section 2 starts by describing major chemical structures and chemical reactions of biomass feedstocks in hydrothermal systems. Next we describe the major chemical processes that have been proposed or are being developed for converting biomass into fuels. Section 3 focuses on technologies that produce liquid fuels, and Section 4 focuses on those that produce gaseous fuels.Section 5 focuses on the role of the inorganic components of biomass, including their separation from supercritical water and their value as fertilizer. Finally, Section 6 covers the key issues that have prevented the widespread adoption of hydrothermal biomass conversion methods, and summarizes research opportunities that will help to address these issues.
2. Chemical reactions of biological molecules in hydrothermal systems
The chemistry behind reactions of individual biochemicals under hydrothermal conditions is well studied for a number of common materials, such as glucose and triacylglycerides. However, the chemical pathways of, kinetics of, and interactions between most other components of biomass at these conditions are largely uncharacterized. This section reviews hydrothermal reactions of biological materials, as well as some condensation reactions that may contribute to the formation of oils in hydrothermal systems under reducing conditions. The main focus of this section is on chemistry in the subcritical water zone, leading largely to extraction, depolymerization, fragmentation, and liquefaction, as supercritical-water chemistry tends to favor gas formation which is discussed more thoroughly in Section 4.Generalities of hydrothermal reactions. In the early 1980s, many researchers expected altered or enhanced rates of chemical reactions occurring near the critical point of solvents such as carbon dioxide or water. However, it is now commonly accepted that no such enhancement takes place for water, as shown, for example, by Narayan and Antal49 for the dehydration chemistry of 1-propanol. However, observed rates can be significantly enhanced by the loss of mass-transfer limitations (as most organic species become miscible with supercritical water) as well as the ability of supercritical water to sustain ionic as well as free-radical reactions.50
Generally speaking, in producing fuels from biomass, one overall objective is to remove oxygen; biomass feedstocks often contain 40–60 wt% oxygen and conventional fuels and oils typically have only trace amounts, under 1%. Oxygen heteroatom removal occurs most readily by dehydration, which removes oxygen in the form of water, and by decarboxylation, which removes oxygen in the form of carbon dioxide. Thermodynamically, since both water and carbon dioxide are fully oxidized and have no residual heating value, they can make ideal compounds in which to remove oxygen without losing heating value to the oxygen-containing chemicals removed.
Although an excess of water is present, dehydration reactions commonly occur in hydrothermal media at elevated temperatures and pressures. In fact, thermodynamics calculations for the alcohol/alkene equilibrium51 show that, for a 1 M solution at 400 °C and 34.6 MPa, we would expect ethanol to equilibrate to a mixture of about 74 mol% ethylene/26 mol% ethanol, and n-propanol would equilibrate to a mixture of 97 mol% propylene/3 mol% propanol. The chemistry of cellulose and hemicellulose is dominated by their polyol structure (see Table 1 and Fig. 1), and degradation occurs by a mixture of dehydration and hydrolysis (fragmentation) reactions, as discussed further in Section 2.2.
Primary alcohols dehydrate via E2 eliminations, SN2 substitutions, and AdE3 additions (involving the alkene product), as shown for ethanol51,52 and n-propanol.51,49 Tertiary alcohols' dehydration chemistry is dominated by E1 and AdE2 (also involving the alkene product) mechanisms.53,54 For secondary alcohols, the mechanism is less clear—for isopropanol, both E2 and E1 mechanisms give a good fit to the data.55 In all three cases, ethers (which may be formed from alcohols via substitution reactions) play an important role in the dehydration chemistry. Generally, dehydration reactions are accelerated by the catalytic effect of a small amount of an Arrhenius acid such as H2SO4.
Decarboxylation reactions provide a second means of removing oxygen from biomass compounds; unfortunately, compared to dehydration reactions, fewer fundamental studies have been initiated. (Decarboxylation reactions are discussed for amino acids and fatty acids later in Section 2.4.2 and 2.3, respectively.) Decarboxylation reactions are attractive because they not only decrease the oxygen content of the feedstock, but because they also increase the H:C ratio, which typically leads to more attractive fuels.
Relative to water-free conditions, decarboxylation reactions in hydrothermal media can be suppressed56 or enhanced,57 and some suppressed reactions can return to similar levels with the addition of a catalyst such as KOH.58 Goudriaan and Peferoen,57 as well as Boocock and Sherman59 have shown that under liquefaction conditions of 300 to 350 °C in liquid water, a large portion of the oxygen is removed from lignocellulose as carbon dioxide. However, the mechanism of this is unclear: deoxyhexonic acids, which are formed via the dehydration of many sugars, have not been found to undergo selective decarboxylation under hydrothermal conditions of 340 °C.60
Of course, in mixtures containing multiple functional groups, reactions and interactions (both inter- and intramolecular) between these groups can change chemical pathways. In acids such as lactic acid61 and citric acid,62 which contain both hydroxyl and carboxylic acid groups, a decarbonylation pathway (involving the loss of CO) is opened and can occur instead of dehydration or decarboxylation reactions.
2.1. Reactions of carbohydrates
![Pathways for the degradation of d-glucose and d-fructose. References for individual reactions are given in brackets. [B1985] = Bonn et al., 1985;63 [K1986] = Krishna et al., 1986;64 [A1990] = Antal et al., 1990;65 [A1990a] = Antal et al., 1990;66 [L1993] = Luijkx et al., 1993;67 [K1999] = Kabyemela et al., 1999;68 and [J2004] = Jin et al., 2004.69](/image/article/2008/EE/b810100k/b810100k-f9.gif) | ||
| Fig. 9 Pathways for the degradation of D-glucose and D-fructose. References for individual reactions are given in brackets. [B1985] = Bonn et al., 1985;63 [K1986] = Krishna et al., 1986;64 [A1990] = Antal et al., 1990;65 [A1990a] = Antal et al., 1990;66 [L1993] = Luijkx et al., 1993;67 [K1999] = Kabyemela et al., 1999;68 and [J2004] = Jin et al., 2004.69 | ||
However, the rate of inter-isomerization is slow relative to the rates of degradation of both glucose and fructose. Antal et al.65 saw that, when starting with glucose (or fructose), the amount of fructose (or glucose) formed was quite small compared to the amounts of other degradation products formed. Fructose is reportedly more reactive than glucose; for instance, Kabyemela et al.70 observed that the rate of glucose isomerization to fructose was important in hydrothermal media; however, the reverse reaction of fructose to glucose was not important. His observations are based on experiments in which glucose or fructose were the starting material at temperatures of 300 to 400 °C and pressures of 25 to 40 MPa. In agreement with Kabyemela et al., Salak Asghari and Yoshida71 have seen that despite the isomerization, fructose reacts much faster than glucose, at least in the presence of phosphoric acid: after two minutes at 340 °C fructose was 98% destroyed, but glucose was only 52% destroyed. They noted that at room temperature the more-reactive acyclic form of glucose is in much lower relative abundance than the acyclic form of fructose, and speculated the same principle may be driving the lower reactivity at hydrothermal conditions.
The hydrolysis of glucose and fructose has been studied for well over a century, and all confirm rapid degradation at hydrothermal conditions. Fig. 10 is an Arrhenius figure showing the glucose degradation rate as a function of temperature from a number of studies. Glucose destruction is drastic under hydrothermal conditions; for instance, Kabyemela et al.68 saw 55% conversion of glucose after 2 s at 300 °C and 90% conversion after 1 s at 350 °C. Most researchers have assumed that glucose undergoes 1st-order degradation kinetics; however, Matsumura et al.72 observed a reaction order of ∼0.8 for temperatures above about 250 °C.
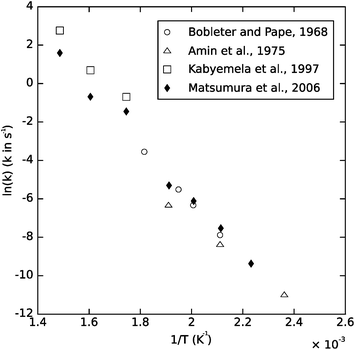 | ||
| Fig. 10 Assumed first-order Arrhenius plot of glucose degradation data. Data from Bobleter and Pape, 1968;73 Amin et al., 1975;74 Kabyemela et al., 199770 (40 MPa data), and Matsumura et al., 200672 (25 MPa data). | ||
Table 2 shows common degradation products observed in six different studies. An overall degradation network for glucose under hydrothermal conditions is presented in Fig. 9, which has been compiled from a number of sources.
Because the rate of isomerization between glucose and fructose is slow relative to their degradation rates, different major products are observed when starting with glucose or fructose. While different reaction conditions and analytical techniques cause the products reported to differ, most publications agree that glucose degrades mostly to fragmentation products (glycolaldehyde, pyruvaldehyde, glyceraldehyde, etc.)75,78 while fructose will react to a higher amount of the dehydration product 5-hydroxymethylfurfural (5-HMF).65,75,78 (5-HMF has been proposed as an industrial building block chemical for bio-based products79 and was the starting material for biomass-derived dimethylfuran, a bio-based gasoline replacement proposed by Dumesic and co-workers.80)
Interestingly, Luijkx et al.67 reported that the aromatic compound 1,2,4-benzenetriol could be formed in significant yields from fructose. They determined that this compound was being formed in yields of up to 46% from 5-HMF (as shown in Fig. 9). This is noteworthy because in lignocellulosic pretreatments, aromatic compounds are often assumed to originate from the lignin portion. Thus Luijkx and co-workers' results show that aromatics can also be formed from the cellulosic sugars. Indeed, Nelson et al.81 reported, in 1984, the formation of aromatic compounds from hydrothermal reactions of pure cellulose at 250 to 400 °C.
Temperature can have a profound impact on the reaction pathway. The first studies of glucose hydrolysis over a range of temperatures including supercritical water, conducted in the 1970s,74 reported that product spectra changed from char and liquid organics below the critical temperature of water (374 °C) to gases, with little char, and liquid furans and furfurals above water's critical temperature.74,82,83
Various reactions within the pathways are sensitive to pH. Xiang et al.77 studied the kinetics of glucose decomposition in dilute-acid mixtures at 180 to 230 °C in sealed glass ampoule reactors at unspecified pressures, and found, at 200 °C, that lower ambient pH solutions increased glucose destruction with the highest conversion being approximately 68% after 30 min at an (ambient) pH of 1.5. In experiments with fructose as the starting material at 250 °C, Antal et al.65 noted that adding 2 mM H2SO4 significantly affected the degradation pathways of fructose, causing increased yields of 5-HMF and furfural and decreased yields of pyruvaldehyde and lactic acid, but had no measurable effect on the isomerization of fructose to glucose. Salak Asghari and Yoshida71 worked to optimize yields of 5-HMF from fructose, and found phosphoric acid to be the best acid catalyst they tried, giving an optimal yield of 65% 5-HMF at 240 °C after 120 s using 0.05 M fructose in a phosphoric acid solution with an initial pH of 2. Rates were observed to decrease with increasing fructose concentration, concurrent with the build up of solid humin.
Xylose can exist in water as a pyranose ring, a furanose ring, or as an open-chain structure. Antal et al.84 have proposed a mechanism for the conversion of xylose into furfural. Perhaps counterintuitively, furfural (itself a five-membered ring) was found to be formed from the pyranose ring form of xylose; the furanose ring was relatively stable to further chemical transformations under their test conditions. The open-chain form was found to produce glyceraldehyde, pyruvaldehyde, lactic acid, glycolaldehyde, formic acid, and acetol, which are fragmentation by-products in furfural production. The stability of the furanose ring, coupled with relatively slow rates of isomerization between the three forms of xylose, explained the presence of a small and enduring concentration of xylose in the products even after relatively long residence times at 250 °C. This mechanism was recently confirmed by ab initio molecular dynamics simulations by Qian et al.85 at the National Renewable Energy Laboratory.
While Antal et al. showed how furfural is formed directly from xylose, Jing et al.86 showed that furfural also degrades under hydrothermal conditions, but at a much lower rate than the xylose transforms into it. Sasaki et al.87 saw, as the temperature rose higher into the 360–420 °C range, that the measured quantity of fragmentation products (glycolaldehyde, glyceraldehyde, pyruvaldehyde, and dihydroxyacetone) dominated the measured quantity of furfural after reactions with residence times of 0.1–0.25 s and pressures of 25–40 MPa.
Xylose is also capable of forming aromatic compounds in hydrothermal degradation, as observed by Nelson et al.88 for acidic mixtures at 300 °C.
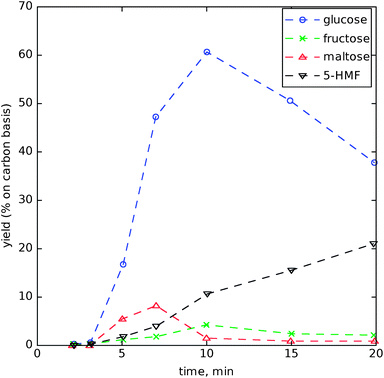
Nagamori and Funazukuri89 studied starch (from sweet potato) decomposition and quantified the yields of glucose, fructose, maltose, and 5-hydroxymethylfurfural (5-HMF) versus time at 180 to 240 °C in a batch reactor at unspecified pressures. They found their highest yield of glucose to be 63% (carbon basis) at 200 °C and 30 min. Fig. 11 shows product spectra versus time for reactions at 220 °C; a large amount of glucose is produced in the early period, but it is significantly degraded at longer residence times, primarily into 5-hydroxymethylfurfural (5-HMF).
 | ||
| Fig. 11 Products from the degradation of starch at 220 °C. Adapted from Nagamori and Funazukuri.89 | ||
Miyazawa and Funazukuri90 report significantly lower yields of glucose from starch at similar conditions: 3.7% glucose yield after 15 min at 200 °C and unspecified pressures. However, they had a key finding that the glucose production increased drastically to 53% with CO2 addition at the ratio of 0.1 g CO2 per g H2O. The CO2 was likely acting as an acid in hydrothermal media. The amount of glucose extracted increased approximately linearly with increasing CO2 concentration, in the range of 0 to 0.1 g CO2 per g H2O.
2.2. Reactions of lignocellulose
Lignocellulosic materials constitute the bulk of the dry weight of woody and grassy plant materials, and as such are amongst the most abundant biochemicals on earth. Lignocellulose is expected to be available at higher industrial yields than starch, by utilizing “energy crops” such as switchgrass, willow and poplar and from agricultural and forest-product residuals such as corn stover, wheat and rice straw, and wood waste.Lignocellulose is composed of three primary components: cellulose, hemicellulose, and lignin. Garrote et al.91 give typical cellulose, hemicellulose, and lignin fractions of various hardwoods, softwoods, and agricultural residues. These three chemical components of lignocellulose behave quite differently under hydrothermal conditions. For instance, in hydrothermal experiments with woody and herbaceous biomass at 200 to 230 °C without added acid or base, Mok and Antal92 found that 100% of the hemicellulose was extracted over the span of just a few minutes, as compared to just 4–22% of the cellulose and 35–60% of the lignin over the same time period.
Hydrothermal media, often with the addition of acids and bases, have long been studied for the decomposition of lignocellulose into monomers. See, for example, Bobleter's excellent review article39 and more recent updates by Mosier et al.93 and Yu et al.94 The monosaccharides produced can make suitable sugars for fermentative processes, such as the production of (cellulosic) ethanol and other biofuels and materials. (However, it is suggested that some aromatic compounds formed in hydrothermolysis may inhibit some fermentation products.88) Hydrothermal technologies can also liquefy and gasify lignocellulose. This section focuses on sugar extraction; liquefaction and gasification of lignocellulose are discussed in Sections 3 and 4, respectively.
Cellulose from different biological sources has different properties, and both its physical (crystalline) and chemical structure can effect its behavior. Perhaps as expected, there is considerable variation in reported degradation rates for cellulose. Schwald and Bobleter96 show classic first-order Arrhenius kinetics for cotton cellulose degradation with an activation energy of 129.1 kJ mol−1 in the temperature range of 215 to 274 °C. However, in a semi-batch system, Adschiri et al.97 showed a significantly higher activation energy of ∼165 kJ mol−1 on powdered cellulose of unspecified plant origin. In an experiment involving a hydrothermal thermogravimetric apparatus measuring loss-in-weight of a cellulose sample at isothermal conditions, Mochidzuki et al.98 found an activation energy of 220 kJ mol−1. Meanwhile, Sasaki et al.99,100 report a drastic acceleration of the reaction kinetics as water becomes near-critical, associated with a change in activation energy from 146 to 548 kJ mol−1 as the system is heated past 370 °C! Sasaki et al.'s data99 is plotted with Schwald and Bobleter's, Adschiri et al.'s and Mochidzuki et al.'s in Fig. 12, which makes the apparent change in activation energy observed by Sasaki et al. appear less dramatic. If a best-fit line is fit to all of the data in Fig. 12, an activation energy of 215 kJ mol−1 is obtained. For comparison, the activation energy for cellulose pyrolysis in the absence of condensed water is about 228 to 238 kJ mol−1.101
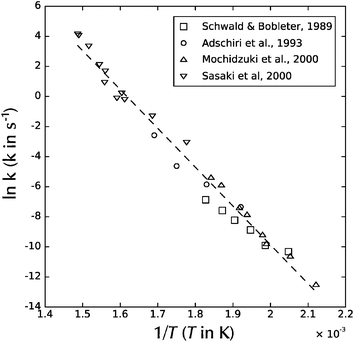 | ||
| Fig. 12 Arrhenius plot of natural logarithm of pseudo-first-order reaction rate versus inverse temperature for cellulose decomposition. From Schwald and Bobleter,96 Adschiri et al.,97 Mochidzuki et al.,98 and Sasaki et al.99 | ||
Other researchers have undertaken temperature scanning techniques to determine when the breakdown of cellulose becomes significant. Deguchi et al.102 have used polarized light microscopy to observe the loss of crystallinity in cellulose fibers using similar techniques to those conventionally used to monitor starch gelatinization, namely a loss of birefringence which corresponds to a loss of crystallinity. When scanning at 11 to 14 °C min−1 at 25 MPa, they observed a loss of birefringence at around 320 °C, indicating the cellulose crystallinity disappeared at these conditions. As illustrated in Fig. 13, they observed breakup of the cellulose fibers very shortly after the loss of crystallinity, suggesting that the crystallinity was preventing breakdown of the cellulose.
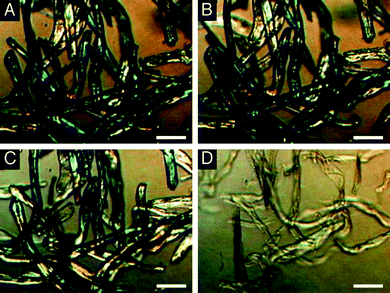 | ||
| Fig. 13 Cross-polarized light microscopy of cellulose being heated in high-pressure water. From Deguchi et al.,102 used with permission. | ||
As mentioned earlier, Sasaki et al.99 reported that the cellulose degradation kinetics begin to have a much higher reaction rate as the reaction temperatures approached and entered the supercritical-water regime, and the hydrolysis proceeds at a much higher rate than glucose degradation at these conditions, above about 350 °C at 25 MPa. By making use of these phenomena, which they attribute to the swelling of cellulose, they claim yields of around 75% glucose. Regardless of whether the cellulose degradation kinetics start to follow a higher activation energy as water becomes near-critical, cellulose degradation appears to be more activated than glucose degradation in general. An overlay of the Arrhenius plots of cellulose and glucose decomposition kinetic constants shown in Fig. 14 clearly illustrates this. It appears that cellulose destruction starts to proceed faster than glucose degradation at temperatures roughly at and above the critical point of water. This may warrant more research into high-temperature, short-time reforming of cellulose to maximize glucose yield. However, oligomers which cannot be hydrolyzed into glucose95 may ultimately limit yields.
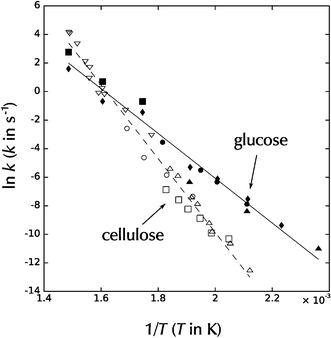 | ||
| Fig. 14 Arrhenius plot overlay of first-order decomposition rate constants for the degradation of glucose (filled data points) and cellulose (open data points). Data sources are identical to those in Fig. 10 and 12. | ||
2.3. Reactions of lipids
Fats and oils, which are non-polar compounds that in their chemical structures are similar to hydrocarbon fuels, can undergo reactions which can convert them into ready substitutes for conventional hydrocarbons as discussed in this section and Section 3.1.2.The reactions of lipids and water are strongly influenced by their phase behavior. As noted in Section 1.2, the dielectric constant of water decreases drastically as water is heated isobarically, at pressures greater than its critical pressure, from room temperature to values above its critical temperature, causing the solvation properties of the water to more closely resemble organic solvents. Under these conditions, hydrogen bonding between water molecules becomes weaker allowing greater miscibility between lipids and water. The increase in temperature causes fats and oils to become increasingly soluble in water as its temperature rises under hydrothermal conditions, ultimately becoming completely miscible by the time the water has reached its supercritical state. Simultaneously, the amount of water that is soluble in the oil phase increases with the temperature. Both of these trends are shown in Fig. 8 for mixtures of fatty acids and water. The left plot shows the solubility of various saturated fatty acids in water as measured by Khuwijitjaru et al.,117 showing an exponential increase in solubility with temperature. The right plot, measured by Mills and McClain in 1949,118 shows the amount of water that is soluble in fatty acids derived from two types of oils: coconut oil and beef tallow. This also shows an exponential increase with temperature.
As the system continues to rise in temperature, the two phases eventually become miscible before the critical temperature of water is reached. Mills and McClain measured this to occur at 293 °C for coconut-oil-derived fatty acids and 321 °C for tallow-derived fatty acids. Using an optically accessible flow cell, King et al.119 also observed the reactive system of soybean oil and water to become completely miscible by 339 °C.
The solubility data presented are for fatty acids. Fats and oils in biological systems are typically in the form of triacylglycerides (TAGs), which consist of three fatty acids bound to a glycerol backbone (see Table 1). The TAG/water system is reactive, with water hydrolysing the TAGs to form fatty acids, as discussed below. Consequently, measurements are only possible for the solubilities of free fatty acids and water, not TAGs and water. In general, if they were stable TAGs would be expected to have much lower miscibility with water, since TAGs lack the polar group of fatty acids. This was observed at 100 °C by Lascaray,120 who saw the solubility of water in tallow/free-fatty-acid mixtures to increase linearly from 0.0027 to 0.0122 kg kg−1 as the fraction of free fatty acid in the tallow/free-fatty-acid mixture was increased from 0 to 100%.
Hydrolysis reactions occur primarily in the oil phase, and proceed to an increasing equilibrium level with increasing water-to-oil ratios. The equilibrium level attained has been found to not be a function of temperature. While the reaction is believed to be first-order within the oil phase, in practice, an induction period is usually observed, which is likely related to the relatively low solubility of water in TAGs as compared to fatty acids. As the reaction proceeds, more fatty acids are generated which increases the solubility of water in the oil phase and thus the observed reaction rate. Moquin and Temelli123 provide a nice overview of this phenomenon in the introduction of their recent article on canola oil hydrolysis in supercritical media.
Fujii et al.124 have confirmed that a first-order reaction drives the degradation kinetics of monoacylglycerides in the aqueous phase, and have shown a first-order reaction rate that follows Arrhenius kinetics, with activation energy of 77.5 kJ mol−1 and frequency factor of 1.01 × 10⁵ s−1.
King et al.119 found that they could achieve rapid hydrolysis of fatty acids in liquid water at temperatures of 330 to 340 °C and water-to-oil ratios of 2.5 to 5.0 : 1, giving 90 to 100% yields of free fatty acids. Using an optically accessible reactor, they found the phase behavior to be extremely important, and noted that the reaction quickly went to completion when the mixture became a single phase at 339 °C.
The decarboxylation of formic125,289 and acetic126,127 acid in hydrothermal media has received more study than the corresponding reactions of fatty acids, and can provide chemical insights. The decarboxylation reaction is strongly influenced by catalytic effects of reactor wall surfaces, in particularly stainless steel. Bell et al.126 studied acetic acid and sodium acetate decomposition at 335 °C and 13.7 MPa. They found that numerous mineral surfaces increased reaction rates by around two orders of magnitude. Additionally, the sodium acetate form was found to decarboxylate more rapidly than the acid form.
2.4. Reactions of proteins and amino acids
Some researchers have reported ways to enhance yields: Rogalinski et al. report that the yield of amino acids quadrupled with the addition of carbon dioxide129: at 250 °C, 25 MPa and 300 s residence time total amino acid yield increased form 3.7 to 15 wt%. Quitain130 found that microwaves increased amino acid yields by an order of magnitude at 200 °C and 60 min, which increased their yield to about 12 wt%.
As such, a number of studies have examined the hydrothermal stability and reactions of amino acids. All amino acids have different chemical structures, and therefore react according to different pathways. However, all amino acids also have the same peptide backbone, and undergo similar decarboxylation and deamination reactions.
Klinger et al.133 recently studied glycine and alanine, two of the simplest amino acids. They found the primary mechanisms of degradation of these amino acids to be decarboxylation and deamination. They found similar decomposition kinetics for these two compounds, with about 50% of their starting material degraded in 5–15 s in 350 °C water at 34 MPa. Both compounds had decomposition activation energies of about 160 kJ mol−1, which are similar to values reported earlier by Sato et al.134 Klinger found no effect of pressure on the decomposition rate between 24 and 34 MPa at 300–350 °C.
Numerous other studies have studied many amino acids in hydrothermal systems. Li and Brill,135 for example, report decarboxylation kinetics for seven different amino acids at temperatures ranging from 310 to 330 °C.
2.5. Formation of hydrocarbons and lipids from small organic materials
Recent work136,137 has found that “Fischer–Tropsch-type” (FTT)‡ reactions can occur in hydrothermal systems, with water acting as the hydrogen source. In research focusing on the speculated origin of life at hydrothermal vents, McCollom et al.136 were able to synthesize lipids of size C35 or greater from formic acid or oxalic acid in hydrothermal systems. These reactions were studied on a longer time scale (2 to 3 days) than is industrially feasible for biomass conversion; they were able to produce n-alkanols, n-alkanoic acids, n-alkenes, n-alkanes and alkanones at temperatures of 175 °C in a stainless steel reactor. However, McCollom et al. did not report their pressure, and they likely had two phases present at these conditions in which the reaction could take place in either the liquid or the gas phase.Meanwhile, Berndt et al.138 and Holm and Charlou139 saw the formation of smaller hydrocarbons, from methane to propane, in the presence of olivine without any organic feed. In their case, the only carbon source was CO2; the reducing power was supplied by the oxidation of Fe(II) to Fe(III). These experiments relied on olivine as a catalyst. However, subsequent research, involving radioactively labeled carbon, has cast doubt on the amount of hydrocarbons produced from CO2versus from reduced hydrocarbons already present in the olivine.200
3. Liquefaction in subcritical water
3.1. “Bio-oil” and “bio-crude” production
Motivated by arguments about the biological origins of petroleum, researchers started proposing in the first half of the 20th century that renewable petroleum could be produced from biomass. In fact, Berl140 suggested in 1944 that “cornstalks, corn cobs, sugar cane, bagasse, seaweed, algae, sawdust, Irish moss, molasses, sorghum, [and] grass” could be turned into a petroleum-like product, which he reported contained 60% of the starting material's carbon and 75% of the starting material's heating value. Berl used an alkaline solution of biomass in water at approximately 230 °C.141Scattered research has continued since Berl's time on the topic. The processes all produce a sort of viscous crude oil replacement, which has an important key difference from conventional crude oil: the oxygen content of the fuel is significantly higher, typically 10–20% in the “bio-crudes” versus < 1%142 in conventional petroleum. The high oxygen content can impart a number of undesirable qualities to the oil product, such as lower energy content, poor thermal stability, lower volatility, higher corrosivity, and a tendency to polymerize.143,144 This makes the bio-crudes generally unprocessable with current petroleum feedstocks—either they need to be burned directly as fuel oils, or they must be put through a deoxygenation process, as discussed in Section 3.1.1.
Elliott et al.145 produced a review of hydrothermal liquefaction technologies developed in the 1983–1990 timeframe, and Demirbas146 reviewed possible mechanisms of liquefaction. Additionally, a wealth of information on these processes exist in the books42–46 produced as proceedings of the International Energy Agency's conferences on thermochemical biomass conversion.
A variety of liquefaction approaches exist in hydrothermal conditions. In general, hydrothermal liquefaction conditions range from 280 to 380 °C, 7 to 30 MPa with liquid water present, 10 to 60 min, often with catalysts present (which are generally alkaline), and sometimes with reducing gases such as CO and H2. The oil produced generally has a heating value of 30 to 36 MJ kg−1 and an oxygen content of 10 to 20%. The biomass feedstocks used for liquefaction will typically have heating values of 10 to 20 MJ kg−1 and oxygen contents of 30 to 50%, indicating that a significant amount of upgrading has resulted.
For comparison, bio-oils can also be made by “fast pyrolysis”, which occurs at atmospheric pressure under higher temperatures (∼500 °C) with very short residence times (< 2 s). Oils from fast pyrolysis typically have much higher oxygen content and moisture, as compared to oils from hydrothermal liquefaction, and contain a large (75–80 wt%) proportion of polar organic compounds.147Table 3, modified from Elliott and Schiefelbein,148 compares the elemental composition, moisture content, and heating values of sample oils from the two methods. Oils produced from hydrothermal liquefaction typically have more desirable quantities than fast pyrolysis oils and can be made with higher energetic efficiency (by avoiding evaporating water); however, fast pyrolysis oils have the advantage of short residence times and lower capital costs.
| Hydrothermal liquefaction | Fast pyrolysis | |
|---|---|---|
| Moisture (wt%) | 5 | 25 |
| Elemental analysis (dry basis, wt%) | ||
| C | 77 | 58 |
| H | 8 | 6 |
| O | 12 | 36 |
| Heating content (MJ kg−1) | 35.7 | 22.6 |
| Viscosity (cps) | 15000 @ 61 °C | 59 @ 40 °C |
While hydrothermal liquefaction is able to create a lower-oxygen oil than fast pyrolysis, part of the oxygen, as well as part of the heating content of the feedstock, exists as small organic compounds that partition into the aqueous phase. (In fast pyrolysis, there generally is no aqueous phase; the water initially present as moisture as well as that formed by reactions either evaporates in the high-temperature process, or is miscible in the final oil product, which contains ∼25 wt% moisture.) For example, Goudriaan et al.149 report oxygen partitioning, as well as partitioning of mass and heating value (relative to that of the feedstock) amongst the oil, aqueous, and gaseous phases for the hydrothermal liquefaction of sugar beet pulp. This is summarized in Table 4. In their experiments, about 79% of the feedstock's heating value is contained in the oil phase and 18% in the aqueous phase (with the remainder going to the gas phase and/or the enthalpy of reaction). Approximately 70% of the oxygen is removed as H2O and CO2, with about 15% remaining (organically bound) in both the oil phase and the aqueous phase.
| Product | Heating content balance | Oxygen balance | Mass balance |
|---|---|---|---|
| Bio-crude | 79% | 12–21% | 41% |
| Aqueous organics | 18% | 9–20% | 12% |
| H2O | — | 31–40% | 21% |
| CO2 | — | 35–40% | 24% |
| Combustible gases | 1.6% | — | 1.5% |
The primary chemical goal of liquefaction is the removal of oxygen heteroatoms; as discussed in the introductory paragraphs of Section 2, this oxygen is preferentially removed as CO2 or H2O, which themselves have no heating value, thus preserving as much of the feedstock's heating value as possible. Preferentially removing the oxygen as CO2 may be desirable as this also has the advantage of increasing the H : C ratio, which can lead to a more desirable fuel product. However, as Dietenberger and Anderson150 point out, supplementing biomass with an external hydrogen source (and removing oxygen as H2O) will yield a greater amount of biofuel per biomass input, with some of the fuel's energy content coming from the supplemental hydrogen stream.
Reducing gases (H2 and CO) are often employed in liquefaction experiments, but their effect and necessity is unclear: early researchers thought it necessary to employ them, but Davis et al.151 noted that in their system, “little or no reducing gas is consumed”. In their early experiments at the University of Illinois, He and coworkers determined that reducing gases were necessary, but in later experiments found similar results when reducing gases (CO or H2) or inert gases (CO2, N2) were used.152
Much of the pioneering liquefaction work was done by Appell and coworkers at the Pittsburgh Energy Research Center in the 1970s, which was later demonstrated at a pilot plant in Albany, Oregon. This process differed from most modern researchers' processes in that the high-pressure reaction took place in an oil-rich phase, rather than a water-rich phase. In their continuous process wood flour was heated to about 330 to 370 °C in the presence of ∼5% Na2CO3 catalyst, CO or H2 reducing gas (3 to 6 mol kg−1 wood), and water at a ratio of about 2.8 kg water per kg wood for residence times of 10 to 30 min (per pass). In order to have an oil-rich phase, a large amount of recycled oil product, at recycle ratios of ∼19 : 1 was required for the process. Yields of 45 to 55% on a mass basis were achieved. (Note that, since feedstocks typically contain 40 to 45% oxygen and the oil may contain 10 to 15% oxygen, low mass yields are necessary.) Researchers at Lawrence Berkeley Laboratory pointed out that the high-pressure liquefaction could take place in a water-rich phase, rather than an oil-rich phase, which eliminated the need for recycle but employed subsequent alkaline and acid treatments.151 Both processes were demonstrated at the Albany, Oregon facility starting from the late 1970s, but research was halted by the US Department of Energy in the early 1980s as the price of petroleum began to drop and national interests shifted towards oxygenated fuel additives, such as ethanol. In all, Stevens reports that about 35 of barrels of bio-oil were produced at the Albany facility.151,153,154
In the 1980s, a liquefaction process known as “Hydrothermal Upgrading”, or the HTU process, was developed by Shell, but the oil company abandoned the process in 1988. The process development was resumed in 1997 by a Dutch consortium.149 Biomass, generally lignocellulosic material (for example, onion peels), is heated to 330 to 350 °C under 10 to 18 MPa of pressure, for residence times of about 5 to 20 min. The resulting product is a water-insoluble heavy oil (“bio-crude”) with a heating value of 30 to 35 MJ kg−1 and oxygen levels of around 10%. Fig. 15 shows a piece of wood being liquefied in water at 340 °C over 5 min in a sealed quartz capillary tube. Goudriaan et al.149 report good preliminary results in subsequent conversion of the biocrude with hydrodeoxygenation and claim “scouting experiments have demonstrated that in this way a diesel fuel with excellent properties can be produced.”
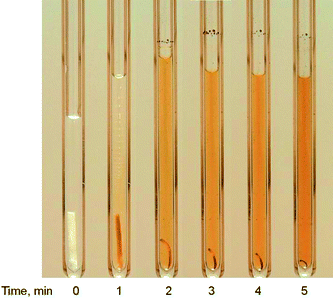 | ||
| Fig. 15 Wood liquefying in water at 340 °C. Courtesy of Professor W. P. M. van Swaaij of the University of Twente; used with permission. | ||
At the University of Illinois, He and co-workers have worked to convert swine manure into oils via conversion at temperatures of 285 to 335 °C and pressures of 6.9 to 10.3 MPa.155 The conversion was carried out at 20 wt% solids in a batch reactor with residence times of two hours. The produced oil was found to have heating values of approximately 35 MJ kg−1 and to be made up of 71% carbon, 12% oxygen, 9% hydrogen, 4.1% nitrogen, 0.2% sulfur, and 3.4% ash.156 They suggested that the high O : C and low H : C elemental ratios of the feedstock negatively affected the conversion, necessitating the use of a reducing gas, such as CO or H2. The oil yield, defined as the ratio of oil produced to volatile solids in the feed increased from 8% to 63% by the addition of a reducing gas, such as CO.155 However, in a later paper,152 the University of Illinois team found that a similarly high oil yield could be achieved with inert gases, such as CO2, N2, or air; without clarifying the role of reducing gases in this liquefaction process.
Karagöz and co-workers at Okayama University (Japan) performed a number of studies exploring the effects of various parameters on the liquefaction of biomass. Their conditions were generally at 280 °C for 15 min. They performed carbon-number frequency tests on their oils, and found much of the oil had a carbon number of between 9 and 11.157
Researchers at the University of Arizona158 employed a single-screw extruder as a means of generating high pressures and temperatures with biomass feedstocks with high solids contents. By using temperatures of 350 to 425 °C and pressures of up to 24 MPa, they generated pressure in the extruder and passed the reacting mixture through a high-pressure holding tube to increase the residence time; using CO as a reducing gas they produced oils with an oxygen content of less than 10% and an energy content of 36 MJ kg−1.
Minowa and colleagues159,160 have explored liquefaction of a number of biomass feedstocks, from bagasse to coconut shells to model garbage, generally at conditions of 300 to 340 °C with Na2CO3 catalyst and have reported yields of 27 to 60% (weight basis) of an oil with heating values of 33–37 MJ kg−1 and ∼12% oxygen.
Algae has long been proposed as an abundantly producible source of biomass. However, processing of algae into biofuels is not straightforward, and hydrothermal liquefaction may prove to be an efficient way of handling the algae, proposed as early as 1944 by Berl.140 Dote et al.161 liquefied a strain of micro-algae that contained 50% natural oils, and were able to produce a yield of 64% (mass basis) oil from this feedstock when processed at 300 °C with Na2CO3 catalyst. Note that the yield is higher than the original oil content of the algae, suggesting that the hydrothermal process not only extracts the naturally occurring oils in the algae but also produces oils from the non-lipid components of the algal biomass.
3.2. Refinement of bio-oils into fuels
As noted earlier, the bio-oils produced by hydrothermal liquefaction processes are typically more viscous and higher in oxygen than conventional crude oil, although lower in oxygen than pyrolysis oils derived from flash pyrolysis.145 Furimsky144 and Elliott162 have recently authored comprehensive reviews of technologies to upgrade biomass-derived oils; Elliott's review focuses on hydrodeoxygenation technologies and processes, while Furimsky's review focuses more on the underlying chemistry of hydrodeoxygenation. Processes utilized include hydrotreating and hydrocracking, often in the presence of a catalyst. Processes are typically similar for bio-oils derived from hydrothermal techniques as well as from atmospheric flash pyrolysis, although upgrading of oils produced in hydrothermal techniques may be more straightforward than for those produced by flash pyrolysis (as described in the previous section). Table 5 summarizes typical operating conditions, as summarized from the literature by Elliott, for hydrodeoxygenation of bio-oils.These hydrodeoxygenation techniques are analogous to, but certainly not identical to, techniques for converting crude oil to fuels. Crude oil processing techniques typically focus on the removal of nitrogen and sulfur, as well as molecular-weight reduction. In contrast, treatment of biomass-derived oils will typically be more focused on oxygen removal and molecular-weight reduction. A number of different catalyst materials are employed for hydrodeoxygenation, including nickel, cobalt, molybdenum, and platinum. Grange and Vanheuren163 summarized many hydroprocessing catalysts in use for hydroprocessing in general, including hydrodesulfurization, hydrodenitrogenation, hydrodeoxygenation, and hydrodemetallisation. They also compared hydrodeoxygenation (HDO) of biomass (pyrolytic) oils to conventional petroleum hydrodesulfurization (HDS), hydrodenitrogenation (HDN) and hydrocracking (HCK) techniques.
3.3. Hydrothermal liquefaction of food processing waste
A hydrothermal process that converts industrial wastes into fuels is being developed by Appel and coworkers at Changing World Technologies, Inc. (CWT). The first plant, located in Carthage, Missouri converts wastes (offal) from ConAgra's Butterball turkey production plant into diesel oil, fertilizer products and carbon.As seen in Table 1, the chemical structure of fatty acids is similar to the straight-chain hydrocarbons present in liquid transportation fuels, e.g., gasoline and diesel oil. The main difference is the presence of the carboxyl group, as well as the glycerol linkage of triacylglycerides. The fatty acids in many naturally occurring fats and oils, both vegetable and animal, often have chain lengths similar to those found in gasoline or diesel oil. Thus, if the carboxyl group could be eliminated a bio-based gasoline or diesel oil would result.164
The CWT process replaces the usual fat rendering practices that have been followed for decades to produce a range of by-products including animal feeds. Hydrothermal processing not only adds value to the wastes by producing fuel and fertilizer, it also eliminates the possibility of food chain accumulation of pathogens. It is also possible to incinerate this kind of organic waste, thereby recovering energy at the same time as eliminating the risk of spreading pathogens, but water content makes the offal a troublesome fuel.
The technology was first developed and tested in a pilot plant in Pennsylvania. A full-scale commercial plant has now been constructed to handle the turkey offal from a ConAgra Butterball turkey processing facility in Carthage, Missouri. The process is described by Roberts et al.164 and Adams and Appel.165 Interesting features of the process are that it handles a feed stream complex in composition and that there are no major waste streams from the process.
A process flow sheet, along with reported mass flow rates prepared by CWT is reproduced in Fig. 16. The process is divided into two main stages. In the first, hydrothermal stage the feed is macerated into slurry, then pressurized to about 4 MPa and heated to reaction temperature (200 to 300 °C). The solids are separated and the liquid is flashed to separate water. The non-aqueous phase is further processed by heat treatment in a second stage reactor (around 500 °C). Recovered from the first stage are a solid phase (minerals) and liquid phase (containing nitrogen), both possible to use for fertilizing purposes. From the second stage fuel gas, carbon and diesel oil are recovered. The fuel gas is used to meet internal process heat needs. The minerals, the liquid containing nitrogen, the carbon and the diesel oil are all marketable products. The oil is dominated by straight-chain hydrocarbons with a chain length between 15 and 20, in the shorter range of conventional diesel oil.164
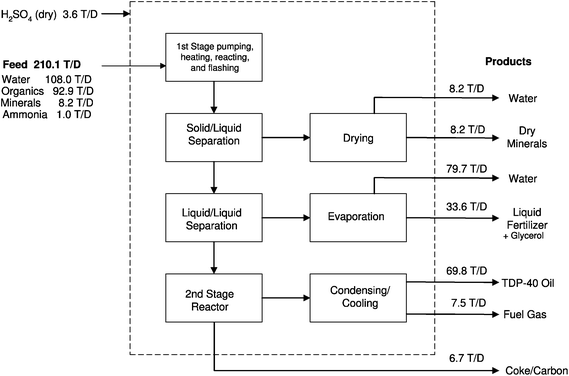 | ||
| Fig. 16 Process flow diagram with mass flow rates in tons per day, as reported by CWT. From Roberts et al.,164 used with permission of CWT. | ||
The environmental performance of the process, investigated using life-cycle assessment methodology based on CWT's released numbers, seems promising with low life-cycle emissions of greenhouse gases compared to those avoided by the use of the biofuel.166 For these food processing wastes, it also seems promising compared to other thermochemical treatment possibilities.167
4. Gasification in sub- and supercritical water
The pioneering work of Modell, first appearing in the 1970s, focused on using supercritical water (SCW) as a means to reform biomass into useful gaseous products.74,82,168–171 His SCW proposal had the advantage of a rapid, direct route to gases including H2, CO, CO2, CH4, and light hydrocarbons that was (mildly) exothermic and avoided char formation,82 although these early experiments only produced low methane yields. Shortly after Modell's first set of supercritical water gasification (SCWG) publications appeared, several research groups began developing processes for biomass gasification in supercritical water. Over the last thirty years, research in hydrothermal gasification has fallen into three general categories based on target products: (1) hydrogen-rich gas via high temperature (T > 500 °C) without catalysts or with non-metal catalysts (discussed in Section 4.1), (2) methane-rich gas via lower temperature (near-critical temperatures to ∼500 °C) with catalysts (discussed in Section 4.2), and (3) subcritical (T ≪ Tc) catalytic processing to a gaseous product (discussed in Section 4.2.3).4.1. High-temperature gasification to hydrogen
At temperatures in the vicinity of 600 °C in supercritical water, a H2-rich product gas can be formed from a variety of biomass sources with near complete conversion of the biomass into gases. The carbon in the biomass primarily is converted into CO2. Most experimental studies have found that reaction temperatures (within the range of about 500 to 700 °C) will have a strong effect on yields and gas compositions, but pressure (at least for pressures above the critical pressure) has little effect on the extent of gasification or the composition. Studies have been conducted with and without catalysts; common catalysts include activated carbon and alkali salts.A large proportion of the work in the field of high-temperature SCWG to hydrogen is attributed to five major research groups: Kruse, Dinjus, Boukis and others at Forschungszentrum Karlsruhe (FZK), Germany; van Swaaij and co-workers at the University of Twente, the Netherlands; Matsumura and co-workers at Hiroshima University, Japan; the State Key Laboratory of Multiphase Flow in Power Engineering of Xi'an Jiaotong University, China; and Antal and co-workers at the University of Hawaii. Table 6 lists the general operating conditions, feedstocks and reactor systems employed by these five groups. In the last five years, perhaps as a result of increased interest in biofuels, research in SCWG has seen significant growth. Results from these relatively new research groups are also included at the end of this section. For further discussions of high-temperature SCWG, the readers are referred to recent reviews by Matsumura et al.172 and Calzavara et al.173
| Research group | Feedstocks | T/°C | P/MPa | Reactor system | Sample references |
|---|---|---|---|---|---|
| Antal, U. of Hawaii | <22 wt% wet biomass, sewage, corn starch, potato starch and wastes, wood sawdust, water hyacinth, cellulose, macadamia nut shell, sugar cane bagasse, glucose and other model compounds | ∼600 | 22–34.5 | Hastelloy & Inconel tubular reactors, capillary tube reactors, packed bed systems; catalysts: activated carbon and charcoal | 174–180 |
| Kruse, Dinjus and Boukis, FZK, Karlsruhe | 1–5 wt% glucose, vanillin, glycine, sawdust, straw, cellulose, plants, meats, corn silage with ethanol and pyroligneous acid, pyrocatechol and phytomass, corn starch, clover grass, sewage sludge and lignin | 400–700 | 25–50 | Pilot plant, 2–4 min; batch, CSTR, tubular reactors; 60 s–1 h; alkali catalysts: KOH, K2CO3 and KHCO3 | 181–187 |
| van Swaaij, U. of Twente, Netherlands | Model compounds of 1–18 wt% formic acid, glucose, glycerol and pinewood | 460–800 | 24–30 | 10–90 s, novel screening technique using fused-quartz capillary tubes (id = 1 mm); catalysts: alkali metal and Ru/TiO2 | 188–191 |
| Matsumura, U. of Hiroshima, Japan | Sawdust, rice straw, cabbage; model compounds: cellulose, xylan, lignin reagents and glucose | <600 | 25 | Pilot plant, hydrothermal pretreatment, partial oxidation (H2O2), batch SS316 tubes, <20 min, fluidized bed reactors; catalysts: alkali metal, nickel and metal oxides | 192–195 |
| State Key Lab (Xi'an Jiaotong University, China) | Sawdust, rice straw, rice shell, wheat stalk, peanut shell, corn stalk, corn cob, sorghum stalk, CMC (carboxymethylcellulose), cellulose and glucose | 600–800 | 25 | Miniature plant and bench scale tubular reactors | 196–199 |
Starting in 1995, the Antal group showed that activated carbons and charcoal could completely gasify high concentrations (22 wt%) of glucose into a hydrogen-rich gas at 600 °C and 34.5 MPa. They examined a variety of activated carbons including spruce wood charcoal, macadamia shell charcoal, coal activated carbon and coconut shell activated carbon over a range of high temperatures (600–650 °C), supercritical pressures (22–34.5 MPa) and concentrated feeds (22 wt% and below). Although Antal and co-workers achieved complete gasification of their feeds to high hydrogen yields, they did experience deactivation of the carbon catalysts after several hours on stream. Gasification of the activated carbon itself was measured in one study, but the gas produced from the carbon catalysts was less than 3% of the gas produced from a concentrated glucose feed (1.2 M). These experiments were also plagued by plugging due to char from the biomass vapors and corrosion of nickel alloy reactors.175–178,206
In the earliest reports of SCWG to come out of FZK, Schmieder et al.181 and Kruse et al.210 demonstrated complete gasification to primarily H2 (and CO2) at 600 °C and 25 MPa from a range of feedstocks, employing batch and continuous tubular-flow reactors. The addition of potassium as KOH or K2CO3 was found to drastically increase the yield of H2. Researchers at FZK have since reported experimental results from numerous batch, tubular and continuous stirred-tank reactor systems, including results for the gasification of zoomass (animal meat-containing biomass),182 which was found to be more difficult to gasify than phytomass. The gasification difficulties were attributed to the presence of amino acids in the feedstock by experiments using model compounds, in which the presence of the amino acid alanine inhibited gasification.185
FZK has constructed a pilot-plant system, VERENA (a German acronym for the “Experimental facility for the exploitation of agricultural matter”).184 VERENA, in operation since 2003, has a continuous flow capacity of 100 kg h−1, maximum temperature of 660 °C at 28 MPa and a maximum operating pressure of 35 MPa. VERENA has achieved gasification yields as high as 90–98% with feedstocks of 9–25 wt% ethanol, pyroligneous acid and corn silage. While most results were very promising, the plant did experience some plugging of the preheaters after 3.5 h of operation. They suspected plugging was the result of inorganic salts precipitating from the corn silage feed. Two significant improvements to VERENA have allowed successful operation for the planned 10 continuous hours. One improvement was limiting the pre-heating of the biomass-containing stream to temperatures below the critical point before entering the reactor, then heating to reaction temperatures (>500 °C) by mixing with a separate stream of supercritical water. The other improvement takes advantage of their down-flow reactor design which allows precipitating inorganic salts to accumulate at the bottom of the reactor, avoiding downstream plugging issues.211
Recently, D'Jesus et al.187,212 examined the supercritical-water gasification of starch, clover grass, and corn silage. They used a continuous-flow reactor system in which the feed slurry was delivered through a pressurized piston, the opposite side of which was displaced by an HPLC pump that metered water. Similar to other experiments, pressure was found to have no major affect, but increasing temperature significantly increased the biomass conversion. The addition of potassium catalyst significantly improved the gasification of corn starch but had no significant effect on the gasification of clover grass and corn silage. The authors note that the latter two feedstocks contain naturally occurring potassium, which could be acting as a catalyst.
A significant portion of SCW research conducted at FZK includes the use of alkali salts to explore their catalytic effect. The observed catalytic effect of aqueous alkali salt solutions on the water-gas shift reaction has long been reported,213,214 and researchers at FZK have made significant contributions to this body of knowledge.181,183,186,210 While experimental evidence clearly shows a relationship between the addition of alkali salts and higher hydrogen yields, the mechanism is not well understood in SCW conditions.183 The interaction of metal reactor walls with alkali salt solutions under SCW conditions further complicates our mechanistic understanding of the observed catalytic effect.
The evidence of corrosion products in several SCWG experiments with alkali salts (for example, Kruse et al.210) supports a theory that this alkali environment may be dissolving the protective metal oxide layer on the reactor walls. If the outer metal oxide layer dissolves, it exposes fresh, temporarily reduced metal to SCW. The metal can quickly oxidize in the SCW, producing hydrogen according to the following example reactions:215,216
| dissolution: Cr2O3(s) + 2 OH−(aq) ⇌ 2 CrO−2(aq) + H2O(l) |
| oxidation: 2 Cr(s) + 3 H2O(l) ⇌ Cr2O3(s) + 3 H2(g) |
Recent experiments conducted in sealed quartz capillary tubes explored the effects of KOH and NaOH without the complicating influence of metal alloy reactor walls. Kersten et al.191 reported the results of a few experiments showing that NaOH increased the hydrogen yield from 9.9 vol.% to 17–21 vol.% following the gasification of 17 wt% glucose at 600 °C, 30 MPa, and 60 s. While these initial experiments are insightful, more detailed studies are warranted to improve our understanding of alkali salt catalysis in the presence and absence of metal reactors.
As a novel means to overcome some of the feeding issues in supercritical-water gasification, Penninger and co-workers217,218 flash pyrolize (see Section 3) their feed, which consists of beechwood sawdust. In this way, the minerals are concentrated in the char produced and not fed to their reactor. They use the condensate of this reaction, which is now a liquid and easier to pump, to feed their supercritical-water reactor, made of Incoloy tubing operated at 600–650 °C and 28 MPa. They achieved gasification efficiencies in the range of about 60 to 80%, with H2, CH4, CO, and CO2 as their major products. Under certain conditions, the carbon monoxide fraction of the gas was as high as 34.5%. Problems were encountered in their runs associated with tar build-up in their preheater exit.
Williams and Onwudili of the University of Leeds used lower temperature (300–380 °C, with pressures of 9.5–22.5 MPa) batch reactor experiments to compare the gasification of glucose, starch, and cellulose. (Starch and cellulose are polymers of glucose monomers with different linkages between the glucose residues.) They found all of these compounds produced H2, CO, CO2, CH4 and lesser amounts of C2–C4 hydrocarbons along with oils and char. Glucose was found to produce the highest amount of H2, while cellulose was found to produce the greatest amount of chars, carbon monoxide, and light hydrocarbons. They additionally gasified Cassava waste, and found it produced similar levels of char to the cellulose. In their experiments, they used hydrogen peroxide to partially oxidize the feed; the H2O2 level was at about 36% of that needed to completely oxidize the feed.219
Hong and Spritzer,220,221 of General Atomics, have developed a continuously operated reactor with a thermal sleeve (a corrosion-resistant sleeve inside of a pressure vessel) to study the supercritical-water partial oxidation (SWPO) of several feedstocks at 23.5 MPa, including corn starch, wood, coal, and municipal solid waste compost. By using partial oxidation, they avoid having to provide external heating to their process. In their first-phase experiments, they reported needing to supplement their feedstock with ethanol as a reductant in order to enhance this heating, caused by the problems of char/tar formation and their limited ability to pump wood slurries. They reported yields, in their “directly-heated” system, comparable to Antal's yields in their “indirectly-heated” system, after compensating for the heating differences. General Atomics completed a pilot-scale testing campaign, and projected that by using negative-cost waste streams that they would be able to produce H2 at $3 per GJ or less. No further testing took place after the 2005 report, as the U.S. Department of Energy shifted the focus of its hydrogen energy program.
Taylor et al.,222 at Sandia National Laboratories, conducted several reforming experiments with primarily methanol, but also ethanol, ethylene glycol, acetone and diesel fuel, in supercritical water from 550 to 700 °C and 27.6 MPa in an Inconel 625 tubular flow reactor. With methanol feed concentrations of 15 to 45 wt% and 3 to 6 s residence time, a gas stream was produced containing 70 vol.% H2, 20 vol.% CO2 and small amounts of CH4 and CO. Feeds of ethanol and ethylene glycol produced less hydrogen (45% and 60% H2 by composition, respectively) and more methane while feeds of acetone and diesel fuel resulted in reactor plugging and black deposits.
In related research on hydrocarbon reforming in SCW, Pinkwart et al.223 recently reported the results of hydrocarbon reforming in SCW in the presence of 4 different commercial steam reforming catalysts (1–45 wt% NiO, various Mg, K, Ca, Si binders on Al2O3 supports). Their experiments included two different feedstocks, which were 10 vol.% of n-decane and 2.5–20 vol.% of diesel fuel, in a tubular flow reactor at 550 °C and 25 MPa. After 10 s residence time over a 32.4 wt% NiO catalyst, 80% of the n-decane feed was converted into a hydrogen-rich gas, yielding almost 4 moles of H2 gas per mole of n-decane compared with 0.05 H2 molar yield without catalyst. Although hydrogen yield was clearly higher with catalyst in almost all cases, the highest yield of 4 moles H2/mole of n-decane, or 13% yield, is well short of the stoichiometric goal of 31 moles of H2 gas for complete reforming to CO2 as given by the following reaction:
| C10H22 + 20 H2O → 10 CO2 + 31 H2 |
Reforming of diesel fuel required longer residence times to achieve the highest yields; for example, after 40 s, a hydrogen yield of 2 moles H2 per mole diesel fuel was obtained with no evidence of coke formation. Unfortunately, Pinkwart and co-workers did not report any analysis of commercial catalyst stability and activity during their experiments.
4.2. Moderate-temperature gasification to methane-rich gas
At the lower temperatures (∼400 °C) that favor the production of methane in gasification reactions, catalysts are generally needed to achieve high gasification rates. Catalysts are used not only to increase the rate of a desired chemical reaction (activity), but also to steer the product distribution toward the desired one (selectivity). Since the catalyst will not influence the chemical equilibrium composition, increasing the rate of a gasification reaction with a catalyst is only useful if thermodynamics are favorable. However, a catalyst may still be useful in the case of unfavorable thermodynamics if it is not the goal to reach chemical equilibrium. Guo et al.198 have calculated the equilibrium gas composition for the system of 5 wt% biomass (for wood sawdust, with formula CH1.35H0.617) and 95 wt% water, calculated for a pressure of 25 MPa; see Fig. 17. | ||
| Fig. 17 Predicted equilibrium gas yields for gasification of 5 wt% wood sawdust at 25 MPa. From Guo et al.198 Used with permission. | ||
Although Fig. 17 predicts the equilibrium for a range of temperatures, in practice it is not possible to obtain a gas composition close to the thermodynamic equilibrium for temperatures below 600 °C without using catalysts. The reasons are as follows:
1. Decomposition of glucose yields reactive intermediates such as 5-HMF which can form polymeric materials of very low reactivity; see Section 2.
2. Methane may be formed by decarboxylation of acetic acid or by decarbonylation of acetaldehyde (“primary methane”), or by the hydrogenation of CO and/or CO2 (“secondary methane”). Since in particular the hydrogenation reactions are very slow in the absence of a catalyst, the methane concentration will usually remain well below the equilibrium value.
3. Some organic intermediates will form solid coke (char), which, although not being a thermodynamically stable product, has a very low reactivity at these temperatures.
Also, performing a truly non-catalytic experiment in supercritical water media is complicated by a number of factors:
1. Reactor walls may act as heterogeneous catalysts.
2. Alkali salts present in real biomass may act as homogeneous catalysts.
3. Corrosion products from the reactor (transition metal ions such as Ni, Fe, Cr) may act as catalysts.
Catalytic gasification at moderate temperatures (below ∼500 °C) has been studied by several researchers with a primary objective to produce either a gas with a medium calorific value (i.e., methane-rich) or to produce hydrogen. At temperatures below 500 °C catalytic effects of reactor walls generally become less important, and the product distribution is affected mainly by the added catalyst. However, baseline experiments without added catalyst should always be conducted to check the validity of this assumption. For methanol reforming to hydrogen in supercritical water at 600 °C, 25 MPa, and 1.1 min residence time, Boukis et al.224 saw their conversion increase from ∼86% for a new Inconel 625 reactor to ∼99.9% for the same reactor that had been conditioned with H2O2, which produced measurable changes to the elemental distribution and the roughness of the inner surface of the reactor. For a slurry of 10 wt% wood sawdust (spruce), Waldner225 reported a baseline conversion to gases§ of about 21% at 409 °C in the absence of a catalyst. For cellulose, Minowa and coworkers226 found only about 10% carbon conversion to gases at 350 °C and 60 min residence time. 67% of the feed carbon was recovered as char, 5% as oil and 13% dissolved in the aqueous phase.
The general agreement on how catalysts achieve complete conversion of the biomass feed is centered on the catalyst's ability to gasify reactive intermediates that are rapidly formed from the feed molecules by hydrolysis and dehydration. The gasification step must also be fast enough to avoid the formation of polymeric materials and eventually char. Some researchers call these reactive intermediates collectively “water soluble products”.227–229 These water-soluble products can react via two competing pathways, the first one leading to gaseous products (CO, CO2, H2), and the second one to oils and finally char.228 Reactive intermediates that are water-soluble have been identified to be mainly phenols and furfurals.182,209,225,230–233
A good catalyst will achieve fast C–C bond rupture, especially for opening aromatic rings (phenols), and at the same time will dissociate H2O to yield reactive O and OH radicals on the catalyst surface. These radicals will then combine with the adsorbed CxHyOz fragments, and finally release CO and CO2. The adsorbed hydrogen atoms from water splitting and from the cleaved CxHyOz fragments will combine to form H2. These are the “minimum” mechanistic features that a good gasification catalyst must exhibit. “Optional” features are a fast equilibration of the water–gas shift reaction, and the hydrogenation of CO and CO2 to CH4 and H2O. Depending on the selected catalysts, a hydrothermal gasification process will thus yield either a hydrogen-rich or a methane-rich gas.
A more detailed discussion of catalysis in a hydrothermal environment for the production of methane from biomass can be found in Vogel;234 see also recent reviews by Matsumura et al.,172 Osada et al.235 and Elliott.288Table 7 summarizes research performed with biomass and model compounds in a hydrothermal environment using heterogeneous catalysts up to 500 °C. In the three subsections that follow, we summarize research in the United States, Japan, and Europe.
| Feedstock | Catalyst | T/°C | P/MPa | Water density/kg m−3 | Reactor | Reference |
|---|---|---|---|---|---|---|
| Glucose, cellulose, hexanoic acid and polyethylene | 11–28%Ni/Al2O3, CoMo/Al2O3, 0.6%Pt/Al2O3 | 374 | 22.1 | N.R. | Autoclave, stirred | 82,170 |
| ||||||
| Kelp, sunflowers, corn stover, water hyacinth, digestion effluent, napier grass, sorghum, potato waste, spent grain, grape pomace, anaerobic digestion sludge, black liquor, cellulose wood flour (Douglas fir) and peat | 68%Ni/SiO2–Al2O3 | 350–450 | 13.8–37.3 | N.R. | Autoclave, stirred | 236–238 |
| ||||||
| p-Cresol | Various unsupported base metals (e.g., Cu, Co, Zn, Cr, W); various unsupported and supported nickel catalysts including powders, mesh, wires, skeletal; nickel nitrate; various commercial supported Ni catalysts; various supported commercial noble metal catalysts (Ru, Rh, Pt, Pd) | 350 | 20 | N.R. | Autoclave, stirred | 239 |
| ||||||
| Benzene, biphenyl, anthracene, polystyrene, hexane, pentadecane, eicosane, polyethylene, p-, m-, o-cresol, propylene glycol, ethanol, vinegar, CCl4, CHCl3, nylon wastewater, polyol wastewater and olive processing water | 48%Ni/γ-Al2O3 | 350 | 20 | N.R. | Autoclave, stirred | 240 |
| ||||||
| p-Cresol, phenol, MIBK, CCl4, trichloroethylene, methanol, nylon wastewater, olive wash water, cheese whey, delactosed, brewer's spent grain, sucrose and propylene glycol | 5%Ru/Al2O3, 5%Ru/ZrO2, 48%Ni/γ-Al2O3, BASF G1-80, 62% Ni/SiO2-Al2O3, Raney Ni | 350–360 | 20–21 | N.R. | Continuous fixed-bed, Carberry | 241,242 |
| ||||||
| Dairy manure and DDG&S | Ru/C | 320–360 | 21 | N.R. | Continuous fixed-bed | 243 |
| ||||||
| Phenol | BASF G1-80 (stabilized), 3%Ru/TiO2, 8%Ru/C | 350 | 21 | N.R. | Continuous fixed-bed | 244 |
| ||||||
| 2-Isopropylphenol, 4-isopropylphenol, 2-propylphenol, 4-propylphenol, lignin (organosolv) and cellulose | 2%Ru/TiO2, 5%Ru/C, 5%Ru/γ-Al2O3, 5%Rh/C, 5%Pt/C, 2%Pt/γ-Al2O3, 5%Pd/C, 5%Pd/γ-Al2O3, 17%Ni/Al2O3 | 400 | N.R. | 0.33 | Batch, unstirred | 115,116,245–247 |
| ||||||
| Lignin (Organosolv) | 10%Ni/MgO, 10%Co/MgO, 20%Ni, MgO | 400 | 30–37 | 0.3 | Batch, unstirred | 112,114,248 |
| ||||||
| Cellulose | Ni/Kieselguhr | 400, 350 | 13, 18 | N.R. | Autoclave, stirred | 249–251 |
| ||||||
| Cellulose | 50%Ni/SiO2–Al2O3, Ni on different supports | 200–350 | 4–22 | N.R. | Autoclave, stirred | 226–229 |
| ||||||
| Cellulose | 65%Ni/SiO2-Al2O3, 5%Pd/Al2O3, 5%Pd/C, 5%Pd/CaCO3, 5%Pd/BaCO3, 5%Pd/ZrO2, 1%Pd/Al2O3, 5%Pt/Al2O3, 1%Pt/C, 10%Pt/C | 350 | 16–20 | N.R. | Autoclave, stirred | 252 |
| ||||||
| Coal leachate and phenol | 47%Ni/C | 200–350 | 20 | N.R. | Continuous fixed-bed | 253–256 |
| ||||||
| Microalgae (Chlorella vulgaris) | 50%Ni/SiO2–Al2O3 | 350 | 18 | N.R. | Autoclave, stirred | 257 |
| ||||||
| Cellulose and glucose | Ni powder, 50%Ni/SiO2–Al2O3 | 350 | 16.5 | N.R. | DAC, Autoclave | 258,259 |
| ||||||
| Cellulose, polymers, naphthalene, dibenzofuran, carbazole and phenyl ether | RuO2 | 450 | 44 | 0.28 | Autoclave, stirred | 260 |
| ||||||
| Cellulose, pulp, lignin, coal, waste paper and paper sludge | RuO2, Ni | 450 | 44 | N.R. | Batch, unstirred | 261 |
| ||||||
| Sawdust, lignin, cellulose, rice straw and xylan | 60%Ni/SiO2–Al2O3 | 400 | 25 | 0.17 | Batch, unstirred | 111,195 |
| ||||||
| Glucose and lignin sulfonate | 63%Ni/SiO2–MgO | 400 | 25.7 | N.R. | Continuous pyrolysis/partial oxidation/fixed-bed | 262 |
| ||||||
| Sawdust (spruce) | Skeletal Ni | 300–410 | 12–34 | N.R. | Batch, unstirred | 225 |
| ||||||
| Phenol, anisole, acetic acid, formic acid and ethanol | Skeletal Ni, skeletal Ni/Ru, 2%Ru/C | 350–500 | 30 | N.R. | Continuous fixed-bed | 263,264 |
| ||||||
| Sawdust (spruce) and ethanol | 1%Ru/TiO2, 2%Ru/C (granular), 7%Ru/C (granular), 7%Ru/C (graphite), 5%Ru/C (powder), 3%Ru/C (extrudates), skeletal Co | 400 | 30 | N.R. | Batch, unstirred; continuous fixed-bed | 234,264,265 |
| ||||||
| Acetic acid, formaldehyde, 2-propanol and glucose | ZrO2, CeO2, MoO3, TiO2 | 400 | 25–40 | 0.17–0.52 | Batch, unstirred | 266–268 |
| ||||||
| Cellulose and glucose | ZrO2 | 400, 440 | N.R. | 0.2, 0.35 | Batch, unstirred | 269 |
| ||||||
| Lignin (Organosolv) and n-hexadecane | ZrO2 | 400 | 30, 40 | 0.35, 0.52 | Batch, unstirred | 270 |
| ||||||
| Stearic acid | CeO2, Y2O3, ZrO2 | 400 | 25 | 0.17 | Batch, unstirred | 58 |
| ||||||
| Glucose | Nano ZnO, ZnAl2O4 | 300 | N.R. | N.R. | Batch | 271 |
| ||||||
| Glucose | Raney Ni | 500 | 30 | N.R. | Autoclave, tumbling | 232 |
| ||||||
| Cellulose and sawdust | Ru/C, Pd/C, nano (CeZr)xO2, nano CeO2, CeO2 powder | 500 | 27 | N.R. | Autoclave, unstirred | 196 |
United States. Modell, Reid and Amin82,170 were the first to report, in 1978, that wood could be gasified in supercritical water without the formation of tars and char, but the conversion to gaseous products was low. The MIT group also studied the effect of adding different catalysts (five different Ni/Al2O3 catalysts, one Co/Mo catalyst, and one Pt/Al2O3 catalyst) on the gasification of glucose, cellulose, hexanoic acid, and polyethylene. According to Modell,82 the key for avoiding the formation of tars and char was the rapid introduction of the reactants into the hot pressurized water.
Pioneering work in the field of catalytic hydrothermal biomass gasification has been carried out by Elliott and co-workers starting in the 1980s at the Pacific Northwest National Laboratory and resulted in the TEES process (Thermochemical Environmental Energy System).236–244,272–275 Typical TEES conditions are in the subcritical region (350 °C, 20 MPa), although the early publications list results at supercritical conditions as well. Several catalysts were examined and tested for long-term activity. Ruthenium, rhodium, and nickel proved to be active metal catalysts. Stable supports for these metals included ZrO2 (monoclinic), α-Al2O3, TiO2 (rutile), and carbon. For most feedstocks, the product gas consisted of >50 vol.% CH4, 40–50 vol.% CO2, <10 vol.% H2 and traces of higher hydrocarbons. For wood as feedstock, Sealock et al.273 reported a maximum methane yield of 0.22 (g of CH4)/(g of wood) with 33 vol.% CH4 in the product gas using a stirred batch autoclave with a stainless steel liner operated at 450 °C and 34 MPa for 150 min with Harshaw Ni as the catalyst. The TEES process has been tested with a number of actual biomass feedstocks including distillers' dried grains and solubles (DDG&S), dairy manure, nylon wastewater, olive wash water, delactosed cheese whey, brewer's spent grain and spent grain liquor. Nickel sintered rapidly but could be stabilized by doping with another metal.276,244 Catalyst deactivation was observed when inorganic salts precipitated on the catalyst's surface or when N- or S-compounds remained associated with the metal.243
Japan. Yoshida and co-workers195 gasified lignin, cellulose, xylan, rice straw, and wood of unspecified origin in an unstirred stainless steel batch reactor at supercritical conditions (400 °C, 25 MPa, residence time 25 min) using 60%Ni/SiO2–Al2O3 as catalyst. They attained a methane yield of 0.112 (g of CH4)/(g of wood), with a methane volume fraction of 0.28 in the product gas. They also studied mixtures of cellulose and lignin at the same conditions. In another study performed at 400 °C, 26–29 MPa, and using the same Nickel catalyst, they showed that mixtures of lignin with cellulose or xylan resulted in lower gas and hydrogen yields than without lignin.111 Yoshida and Oshima262 proposed a sequential reaction system, consisting of a pyrolysis reactor, a partial oxidation reactor and a catalytic reactor (63%Ni/SiO2–MgO). When the residence times were optimized for each reactor, up to 96% of carbon gasification was attained at 400 °C and 25.7 MPa with glucose-lignin mixtures.
Arai's group at Tohoku University conducted detailed studies with supported noble metal catalysts. Osada et al.116 gasified organosolv lignin and cellulose at 400 °C using Ru/TiO2 and Ni/Al2O3 as catalysts. After 15 min with the Ru/TiO2 catalyst only 31% of the carbon in the lignin was gasified, whereas for cellulose this value was 74%. Furthermore, with Ru/TiO2 no char was formed. The nickel catalyst was much less active. In a follow-up study, they investigated several supported noble metal catalysts for the gasification of lignin and propyl phenols.113,115,245–247,277 Their findings suggest a decomposition of the lignin to lower molecular weight products, such as alkylated phenols, and a catalytic gasification of these phenolics over the noble metal catalyst. Interestingly, only the first decomposition step was apparently affected by the water density. Higher water densities enhanced the decomposition of the lignin but did not influence the gasification of 4-propyl phenol. Turnover numbers (i.e., moles converted per mole of surface sites) were determined from the moles of gasified carbon after 15 min of reaction time at 400 °C for all the catalysts tested. The highest value was obtained for the 2%Ru/TiO2 catalyst, the lowest was for 17%Ni/Al2O3. Repeated experiments with the same used catalysts revealed that only Ru/TiO2 was stable. Ru/C and Ru/γ-Al2O3 lost activity upon repeated use which was accompanied by a loss of specific surface area. The deactivating effect of different sulfur compounds (elemental sulfur, sulfuric acid, thiophene, 4-hydroxythiophenol, 4-methylthiophenol, 2-methyl-1-propanethiol) was investigated at 400 °C for different supported noble metal catalysts. Turnover frequencies (i.e., moles converted per mole of surface site per time) based on carbon gasification rates were reduced to about 7–16% of the ones obtained without added sulfur compounds. Surprisingly, the rate of deactivation did not depend strongly on the type of the sulfur compound. A mechanistic study indicated that sulfur most likely blocks the sites necessary for C–C bond scission and for methanation but not for the water–gas shift reaction nor for the decomposition of C1 compounds such as formaldehyde. Regeneration of a sulfur-poisoned Ru/TiO2 catalyst by washing with sub- or supercritical water for several hours was successfully demonstrated.
Sato and co-workers tested 10% and 20%Ni/MgO catalysts for the gasification of organosolv lignin at 400 °C.114,245 Upon reuse the catalyst proved not to be stable, documented by a decrease in methane concentration and total gas yield. The MgO was found to react to Mg(OH)2 under these conditions.248
Minowa and co-workers252 conducted extensive studies on cellulose gasification at 200–400 °C using nickel catalysts, later also using supported noble metals in a stirred autoclave. Sodium carbonate was found to increase the yield of gases in the presence of catalysts. The gas yield was also a strong function of the amount of Ni catalyst added. A simplified mechanism involving water-soluble intermediates that can either polymerize to oil and further to char or react to gases was consistent with the measured product distribution.226–229,249–251 More recent work focused on the visualization of cellulose and glucose dissolution and gasification using a diamond anvil cell (DAC).258,259
Minowa and Sawayama257 have proposed a cyclic biomass gasification process based on cultivating microalgae that are further gasified hydrothermally. The effluent from the gasification containing the nutrients could be recycled to the algae. This concept was taken one step further in the self-sustaining biofuel vision SunCHem.278 In this process, the nutrients are separated as a concentrated brine and recycled to the algae, together with the CO2 separated from the product gas. Before gasifying the algae, valuable chemicals may be extracted.
Miura's group at Kyoto University prepared a catalyst with a high nickel content on a pyrolytic carbon support by impregnating an ion exchange resin with a nickel salt and treating the dried solid in a nitrogen atmosphere at 500 °C. This catalyst was used at 350 °C and 20 MPa for gasifying organics leached from coal as well as for gasifying model compounds.253 No sintering was observed after 100 h on stream for the catalyst prepared at 500 °C, but sintering occurred before 100 h for carbonization temperatures in the range of 600 to 800 °C.254–256
Park and Tomiyasu260 have used unsupported RuO2 as catalyst at 450 °C and 44 MPa. They were able to gasify cellulose, several polymers and model compounds. Experiments carried out with D2O enabled them to devise a reaction mechanism involving a redox cycle between Ru(IV) and Ru(II). With (–CH2O–) as proxy for biomass, their mechanism for the gasification step can be written as follows:
| RuO2 + (–CH2O–) → RuO + CO + H2O |
| RuO + H2O → RuO2 + H2 |
They postulated that CO and H2 would then further react to form methane and CO2 according to:
| 2 CO + 2 H2 → CH4 + CO2 |
The net reaction would result in:
| 2 (–CH2O–) → CH4 + CO2 |
Later, the same group reported using RuO2 to gasify pulp, lignin, coal, waste paper, and paper sludge.261
Watanabe and co-workers at Tohoku University266,269,267,268,58 studied the effect of metal oxides such as zirconia, ceria, titania, and molybdenum oxide on the decomposition of acetic acid, formaldehyde, glucose, cellulose, and lignin at 400–440 °C in a batch reactor. In some experiments KOH or NaOH was added. Besides CO2, acetone was found to be formed from acetic acid in the presence of zirconia. Methane was not formed when zirconia was present.266 Zirconia also doubled the gasification efficiency for glucose and cellulose.269 In the decomposition of formaldehyde, CeO2 and ZrO2 produced more methanol than TiO2 and MoO3, which could be correlated to the basicity of the metal oxide.267,268 The partial oxidative gasification of n-hexadecane and lignin was studied at 400 °C using zirconia as catalyst.270 The decarboxylation of stearic acid (C17H35COOH) was enhanced by ZrO2 in supercritical water at 400 °C and 25 MPa.58 The same group also studied ZnO and ZnAl2O4 nanoparticles as gasification catalysts for glucose at 300 °C with limited success.271
Hao et al.196 studied the gasification of cellulose and sawdust in supercritical water at 500 °C and 27 MPa using Ru and Pd supported on carbon as well as cerium oxides prepared by different methods. The Ru/C catalyst exhibited a superior activity compared to Pd/C and ceria.
Europe. Sinag et al. at FZK (Forschungszentrum Karlsruhe, Germany)232 investigated the influence of Raney Nickel on the degradation chemistry of glucose in supercritical water at 500 °C and 30 MPa in a tumbling autoclave. The yield of both intermediates, phenols and furfurals, was decreased, and the gas yield increased by the presence of the catalyst.
In work at the Paul Scherrer Institut in Switzerland, Vogel and co-workers have demonstrated that complete conversion of spruce sawdust can be achieved without forming tars or char if a sufficiently active catalyst is used. Waldner and Vogel225 gasified spruce sawdust slurries with feed concentrations up to 30 wt% around 400 °C in a batch reactor, reaching a methane yield corresponding to the chemical equilibrium. Using fused quartz capillaries, Vogel et al.263 visualized the onset of gas formation from a spruce slurry using Raney nickel as catalyst. The temperature at which gasification starts was determined by Waldner265 to be around 250 °C independent of the heating rate, using a pressure differential approach from two batch experiments, one being a blank run. Several catalysts were screened for their activity and selectivity in batch experiments with spruce sawdust. From the most promising ones, Raney nickel, 1%Ru/TiO2, and 2%Ru/C were further tested for their long-term stability in a continuous catalyst test rig. A mixture of five organic compounds, representing hydrolyzed wood, was used as feed solution. Raney nickel sintered after a short time, even as a Ru-doped variant, whereas 1%Ru/TiO2 was not active enough. 2%Ru/C was hydrothermally stable for more than 200 h on stream at 400 °C and 30 MPa with space velocities of 1.6 up to 33 gorganics/gcat/h. The addition of small amounts of sodium sulfate (corresponding to 8 ppm of sulfate at the entrance to the reactor) were found to deactivate the catalyst gradually. This deactivation could be explained by an irreversible bonding of the sulfate anion to surface ruthenium, probably Ru(II) or Ru(III), considering the mechanism proposed by Park and Tomiyasu.260 However, sulfate might not be the actual poison under reaction conditions as it may be reduced to sulfide at these conditions.234,264
For batch reactor experiments with the catalyst premixed with the feedstock, Waldner265 has shown that the catalyst must be active as low as about 250 °C to avoid secondary reactions of the organic intermediates to form tars and coke. In batch experiments starting with the feed mixture including the catalyst, tar and coke formation is only observed for catalysts of insufficient activity. In a continuous process design with a preheater and a catalytic gasification reactor connected in series, tar and coke formation may be observed even if a very active gasification catalyst is used because, once formed in the preheater, the tars and char exhibit very low reactivities at temperatures <500 °C. For such a continuous process design, the reaction severity (a function of temperature and residence time) in the absence of a gasification catalyst must thus be minimized in order to avoid tar and coke formation. For this reason, batch experiments with the catalyst premixed with the feedstock are only of limited use for assessing the coke formation potential of a certain feedstock. One possibility for overcoming this experimental limitation is to heat up the feed mixture without the catalyst, preferably applying the same temperature-time trajectory as in the preheater of the continuous process, and rapidly introducing the catalyst into the batch reactor after the heat up time. Vogel et al.263 have shown, using a variant of this procedure, that spruce sawdust can also be gasified completely in a sequential non-catalytic batch heat up and catalytic gasification experiment. In this sense, detailed knowledge of the liquefaction chemistry, as reviewed in Sections 2 and 3, is critical for properly designing a continuous catalytic gasification process that avoids tar and char formation.
• Solid lignocellulosic biomass (e.g., wood sawdust) can be completely gasified to a methane-rich gas around 400 °C and 30 MPa in a hydrothermal environment if a suitable catalyst is used. This temperature is much lower than conventional atmospheric gasifiers which are operated at 800 to 900 °C.
• Active heterogeneous catalysts include supported noble metals such as Ru, Rh, Pt (but low loadings are needed to keep costs affordable), skeletal Ni, supported Ni (high loadings > ∼45 wt% are needed), and unsupported noble metal oxides (e.g., RuO2). The choice of the support is crucial as only few materials are stable at hydrothermal conditions.
• Unpromoted Ni will sinter rapidly and deactivate. An exception seems to be the 47% Ni on pyrolytic carbon used by Miura's group. Useful—meaning active, selective, and stable—catalysts that have been tested for several days at T ≤ 500 °C with clean (salt-free) feedstocks include 2% and 8%Ru/C, promoted BASF G1-80 (supported Ni), 3%Ru/TiO2 (rutile), and 47%Ni/C.
• Some inorganic salts, present in the biomass or formed from organically bound N, S, and P during hydrolysis, will form scale in heat exchangers and reactors and lead to corrosion, as well as poison catalysts. Studies on catalyst stability using model compounds should therefore also include runs with solutions of model compounds and inorganic salts.
• Sulfur poisoning is a major concern in SCWG. In contrast to gas-phase steam reforming conditions, the exact sulfur species and deactivation mechanism under hydrothermal conditions has not yet been elucidated.
• For the gasification of low molecular-weight organic compounds, as produced during hydrolysis, a surface redox mechanism involving two oxidations states of the metal has been suggested and is consistent with experimental findings.
In subsequent work, Huber et al.280 was able to achieve similar gasification with only a Raney nickel/tin catalyst, which is much less expensive than platinum-based catalysts. However, Huber and co-workers were only successful in gasifying relatively reduced simple organic compounds, such as ethylene glycol, glycerol, and sorbitol, and did not report being able to gasify glucose.
This work provided a significant breakthrough in hydrothermally producing hydrogen at much lower temperatures than in previous studies. However, the researchers only report successful studies with pure species (not mixed biomass streams), had greater success with more reduced compounds such as methanol than with glucose, and had greater success at dilute feed concentrations (∼1 wt%) than at more concentrated (∼10 wt%) conditions.281
5. Recovery of inorganic components
Biomass consists of a mixture of organic and inorganic species: elementally, biomass is composed of carbon, hydrogen, oxygen, nitrogen, phosphorus, sulfur, potassium, sodium and a number of other elements, most of which exist as either heteroatoms with the carbon or as ions. Only the carbon and hydrogen are of use as fuels. However, many of the other elements (particularly nitrogen, phosphorus and potassium) have a high commercial and environmental value if they can be recovered in biologically available forms for use as fertilizer.The major components of fertilizer are chemical compounds of nitrogen, phosphorus, and potassium (the so-called N-P-K fertilizers). Nitrogen is biologically available in the form of ammonia (NH4+) and to a lesser extent nitrate (NO3−). Phosphorus is biologically available in the form of phosphate (PO43–). Potassium is biologically available in its ionic form, K+ (associated with an anion such as chloride, sulfate, or nitrate).282
The fertilizer industry is very energy and natural resource intensive. Phosphorus itself is mined, and is a finite resource. Although most nitrogen-based fertilizers are manufactured from nitrogen gas in the air, the overall industry is extremely natural gas intensive. Most nitrogen fertilizer is derived from, or applied directly as, anhydrous ammonia (NH3) which is made by the well-known Haber–Bosch process. This process reacts atmospheric N2 with H2 to form NH3; the H2 in turn is typically produced from natural gas (CH4) via steam reforming and the water–gas shift reaction. When running at stoichiometric efficiency, 3/8 of a mole of CH4 is consumed to produce each mole of ammonia, and the overall methane-to-ammonia reaction is endothermic (ΔHrxn = 16 kJ mol−1 NH3 at standard conditions, not counting the heat of vaporization of water), which generally requires the consumption of more fossil fuels for heating needs. A recent study1 found that on average, in the US, 51 MJ of energy is required per kilogram of NH3 produced.
Many biomass feedstocks contain large amounts of potential fertilizers. For example, Table 8 shows the inorganic species present in a manure considered for gasification at the Paul Scherrer Institut. Other ions can be formed from hydrothermal reactions of heteroatomic species in the biomass. If the inorganic species of biomass can be recovered as fertilizers, potential environmental and economic gains can be realized from these processes. Many of these species occur as ions (NH4+, NO3−, K+, PO43−, etc.), which can lose their solubility in supercritical water as discussed in Section 1.2. If these ions can be precipitated out and recovered in hydrothermal processes,283 then fertilizers can be recovered in addition to the biofuels.
| Cation | mg kg−1 | Anion | mg kg−1 |
|---|---|---|---|
| NH4+ | 47000 | PO43– | 67000 |
| K+ | 9100 | NO3− | 21000 |
| Na+ | 6700 | SO42– | 11000 |
| Mg2+ | 3800 | Cl− | 5500 |
| Ca2+ | 2700 | S2O32– | 1600 |
| (COO)22– | 1200 | ||
| F− | 38 | ||
| C2H5COO− | 30 | ||
| CH3COO− | ND |
6. Critical issues and research needs
While hydrothermal technologies have many potential benefits over conventional methods of processing biomass to useful fuels, the fact remains that these technologies are not being widely commercialized today. Part of this is due to the high pressures needed for processing which requires special reactor and separator designs and the capital investments needed for full-scale plants. There are still a number of other critical issues hindering commercialization that need to be resolved so that the technologies can be piloted and ultimately scaled up. These include:1. Solids loading
The “rule of thumb” employed by most knowledgeable workers acknowledges the need for solids loading in excess of 15–20 wt% in order to achieve practical economies. At lower concentrations, the associated capital costs of the heat exchangers, the heat losses, and the pumping expenses for moving all of that water through the plant can create economic barriers. Sometimes, spectacular findings can be announced involving high conversions at low feed concentrations; if these results are not scaleable to higher concentrations, they are of little commercial value.2. The feedstock and impurities
Many hydrothermal processes work well on “clean” lignocellulosic feedstocks, and are proven for substances such as ground wood, which is a significant advantage over conventional biofuels processes. However, the truly low-cost feedstocks are mixed waste streams, which can include manures, sewage sludges, and other feedstocks which will often contain high levels of impurities, including inorganics. Under these conditions, the handling of the impurities becomes crucial: the ionic species can create massive problems by precipitating out, clogging reactors and plugging catalyst pores.34,35 However, the inorganics provide the opportunity to produce a valuable fertilizer by-product of the process if managed properly.3. Heat transfer and recovery
Hydrothermal technologies operate at high temperatures, and have severe heating requirements to reach these temperatures, although these are lower than the heating requirements if the system were unpressurized (which would result in water vaporization). This emphasizes the importance of heat integration; that is, recovering the heat from the hot effluent stream to heat the incoming cold stream. Although Elliott et al.,241 Boukis et al.,284 and Nakamura et al.285 have independently demonstrated and measured high heat exchanger efficiencies in their pilot plants, it will be important to continue to emphasize this factor in the large-scale design in order to achieve high efficiencies at commercial scales, particularly if fouling becomes pronounced.4. The feeder
Feeding a mixture of 15 wt% wood sawdust, food wastes, sewage sludge or algae into a reactor operating above 22 MPa is challenging. These problems are particularly vexing at the laboratory scale, as it is difficult to find small pumps capable of high pressures (which will have small orifices) that can effectively pump high solids concentrations. Groups have solved this problem by a number of means, including using starch gels with cement pumps, pre-hydrolyzed feeds, solids-free feeds, or by pumping water against a piston containing the biomass slurry. Feeding pressurized slurries becomes less of a problem at full scale, however, as high-pressure slurry pumps start to become available for flow rate capacities of around 100 kg h−1.5. Coking and deactivation of heterogeneous catalysts
Heterogeneous catalysts, those that are solids that remain in the reactor as the reacting solution flows past them, are prone to fouling and subsequent inactivation. Many researchers have demonstrated high yields of their desired products in batch or short-time continuous reactions. However, continuous or semi-continuous studies with long periods online often show significant declines in catalyst effectiveness. Coking is a serious issue with biomass streams, as is precipitation of inorganics, and fixing of sulfate onto certain catalysts. Additionally, some catalyst supports will degrade or oxidize under hydrothermal conditions. Researchers are addressing these three issues, but they must be overcome to ensure continuous, long-term operation of a full-scale plant.6. Recovery of homogeneous catalysts
Homogeneous catalysts, meaning those that are dissolved and fed into the reactor with the reactants such as KOH or H2SO4, offer the advantage of not suffering from coking and inactivation problems, as heterogeneous catalysts are prone to do. However, these catalysts must be recovered and reused at the end of the process in order to achieve an economic process.7. Wall effects
Much research is conducted within Inconel and Hastelloy vessels, which are constructed of alloys with a high content of nickel. This nickel on the wall surface can act as an important catalyst on its own, and it is difficult to separate the wall effects of catalysis from the effects of the intended catalyst. This may ultimately lead to scale-up issues if not properly understood. This was shown to be an issue in supercritical-water oxidation (SCWO),286 and has been reported by Boukis and co-workers224 to occur in supercritical-water gasification (SCWG). Van Swaaij's group,191 by using fused quartz capillaries, has reported that the water–gas shift reaction appears to be drastically enhanced in the presence of nickel-containing metal surfaces.Acknowledgements
We would like to thank Bill Peters, Greg Stephanopoulos, Bill Green, Curt Fischer, Daniel Klein-Marcuschamer, Rory Monaghan and members of the Tester group from MIT; Larry Walker from Cornell; Robert Shaw from the Army Research Office; Brian Appel and Terry Adams from Changing World Technologies; Glenn Hong of General Atomics; Doug Elliott and Don Stevens from the Pacific Northwest National Laboratory; Phil Marrone from Science Applications International Corporation; Jeff Resch of General Mills; Peter Girguis of Harvard University; and Samuel Stucki from the Paul Scherrer Institut for discussions and insights into hydrothermal processing, fuels, and the chemistry and biology in the vicinity of oceanic hydrothermal vents. We acknowledge and appreciate partial funding support from the Society for Energy and Environmental Research (through the U.S. Department of Energy award DE-FG36-04GO14268; support by the DOE does not constitute endorsement by the DOE of the views expressed in this article), Shell Oil Company, the Paul Scherrer Institut, the Martin Foundation, the Knut and Alice Wallenberg Foundation, and the Coral Industries Endowment of the University of Hawaii.References
- J. C. Johnson, Technology assessment of biomass ethanol: A multi-objective, life cycle approach under uncertainty, PhD thesis, Massachusetts Institute of Technology, 2006. http://hdl.handle.net/1721.1/35132 Search PubMed.
- M. Wang, Effects of fuel ethanol use on fuel-cycle energy and greenhouse gas emissions, Technical report ANL/ESD-38, Center for Transportation Research, Argonne National Laboratory, Argonne, IL, USA, 1999 Search PubMed.
- H. Shapouri and A. McAloon, The 2001 net energy balance of corn ethanol, Technical report, Office of the Chief Economist, Office of Energy Policy and New Uses, US Department of Agriculture, 2004 Search PubMed.
- G. Marland and A. Turhollow, CO2 emissions from the production and combustion of fuel ethanol from corn, Energy, 1991, 16(11–12), 1307–1316 CrossRef CAS.
- A. Farrell, R. Plevin, B. Turner, A. Jones, M. O'Hare and D. Kammen, Ethanol can contribute to energy and environmental goals, Science, 2006, 311(5760), 506–508 CrossRef CAS.
- S. Ho and T. Renner, Global warming impact of gasoline versus alternative transportation fuels, Technical report, SAE Technical Paper 901489, 1989 Search PubMed.
- D. Keeney and T. Deluca, Biomass as an energy source for the midwestern US, Am. J. Altern. Agric., 1992, 7(3), 137–144 Search PubMed.
- D. Pimentel and T. Patzek, Ethanol production using corn, switchgrass, and wood; biodiesel production using soybean and sunflower, Nat. Resour. Res., 2005, 14(1), 65–76 Search PubMed.
- A. J. Ragauskas, C. K. Williams, B. H. Davison, G. Britovsek, J. Cairney, C. A. Eckert, W. J. Frederick Jr, J. P. Hallett, D. J. Leak, C. L. Liotta, J. R. Mielenz, R. Murphy, R. Templer and T. Tschaplinski, The path forward for biofuels and biomaterials, Science, 2006, 311(5760), 484–489 CrossRef.
- A. Casolari, Heat resistance of prions and food processing, Food Microbiol., 1998, 15(1), 59–63 CrossRef.
- V. Cunningham, P. Burk, J. Johnston and R. Hannah, The MODAR Process: An effective oxidation process for destruction of biopharmaceutical by-products, in AIChE Summer National Meeting, Boston, MA, Paper 45c, 1986 Search PubMed.
- W. Wagner and A. Pruss, The IAPWS Formulation 1995 for the thermodynamic properties of ordinary water substance for general and scientific use, J. Phys. Chem. Ref. Data, 2002, 31(2), 387–535 CrossRef CAS.
- D. Archer and P. Wang, The dielectric constant of water and Debye–Hückel limiting law slopes, J. Phys. Chem. Ref. Data, 1990, 19(2), 371–411 CAS.
- A. Bandura and S. Lvov, The ionization constant of water over wide ranges of temperature and density, J. Phys. Chem. Ref. Data, 2006, 35(1), 15–30 CrossRef CAS.
- M. Japas and E. Franck, High pressure phase equilibria and PVT-data of the water-nitrogen system to 673 K and 250 MPa, Ber. Bunsen-Ges. Phys. Chem., 1985, 89, 793–800 CAS.
- M. Japas and E. Franck, High-pressure phase equilibria and PVT-data of the water-oxygen system including water-air to 673 K and 250 MPa, Ber. Bunsen-Ges. Phys. Chem., 1985, 89, 1268–1275 CAS.
- K. Tödheide and E. Franck, Das Zweiphasengebiet und die Kritische Kurve im System Kohlendioxid-Wasser bis zu Drucken von 3500 bar, Z. Phys. Chem. N.F., 1963, 37, 387–401.
- T. Seward and E. Franck, The system hydrogen-water up to 440 °C and 2500 bar pressure, Ber. Bunsen-Ges. Phys. Chem., 1981, 85, 2–7 CAS.
- T. Krader and E. Franck, The ternary systems H2O–CH4–NaCl and H2O–CH4–CaCl2 to 800 K and 250 MPa, Ber. Bunsen-Ges. Phys. Chem., 1987, 91, 627–634 CAS.
- F. J. Armellini, Phase Equilibria and Precipitation Phenomena of Sodium Chloride and Sodium Sulfate in Sub- and Supercritical Water, PhD thesis, Massachusetts Institute of Technology, 1993. http://hdl.handle.net/1721.1/12552 Search PubMed.
- J. F. Connolly, Solubility of hydrocarbons in water near the critical solution temperatures, J. Chem. Eng. Data, 1966, 11(1), 13–16 CrossRef.
- M. Modell, Processing methods for the oxidation of organics in supercritical water, US Pat., 4338199, 1982 Search PubMed.
- M. Modell, Processing methods for the oxidation of organics in supercritical water, US Pat., 4543190, 1985 Search PubMed.
- T. B. Thomason and M. Modell, Supercritical water destruction of aqueous wastes, Hazard. Waste Hazard. Mater., 1984, 1(4), 453–467 Search PubMed.
- M. Modell, Supercritical water oxidation, in Standard Handbook of Hazardous Waste Treatment and Disposal, ed. H. Freeman, McGraw-Hill, New York, 1989, pp. 8.153–8.168 Search PubMed.
- R. Shaw, T. Brill, A. Clifford, C. Eckert and E. Franck, Supercritical water: A medium for chemistry, Chem. Eng. News, 1991, 69(51), 26–39 CAS.
- J. W. Tester, H. R. Holgate, F. J. Armellini, P. A. Webley, W. R. Killilea, G. T. Hong and H. E. Barner, Supercritical water oxidation technology: A review of process development and fundamental research, in Emerging Technologies for Hazardous Waste Management III (ACS Symposium Series 518), ed. D. Tedder and F. Pohland, American Chemical Society, 1993, pp. 35–76 Search PubMed.
- J. W. Tester and J. A. Cline, Hydrolysis and oxidation in subcritical and supercritical water: Connecting process engineering science to molecular interactions, Corrosion, 1999, 55(11), 1088–1100 Search PubMed.
- E. Gloyna and L. Li, Supercritical water oxidation for remediation of wastewaters and sludges, in Encyclopedia of Environmental Analysis and Remediation, ed. R. Meyers, Wiley, New York, 1998 Search PubMed.
- P. Marrone and G. Hong, Supercritical water oxidation, in Environmentally Conscious Materials and Chemicals Processing, ed. M. Kutz, J. Wiley & Sons, Hoboken, NJ, 2007, pp. 385–453 Search PubMed.
- P. Marrone, G. T. Hong and M. Spritzer, Developments in supercritical water as a medium for oxidation, reforming, and synthesis, J. Adv. Oxid. Technol., 2007, 10(1), 157–168 Search PubMed.
- P. Savage, S. Gopalan, T. Mizan, C. Martino and E. Brock, Reactions at supercritical conditions: Applications and fundamentals, AIChE J., 1995, 41(7), 1723–1778 CrossRef CAS.
- N. Akiya and P. Savage, Roles of water for chemical reactions in high-temperature water, Chem. Rev., 2002, 102(8), 2725–2750 CrossRef CAS.
- M. Hodes, P. Marrone, G. Hong, K. Smith and J. Tester, Salt precipitation and scale control in supercritical water oxidation–Part A: Fundamentals and research, J. Supercrit. Fluids, 2004, 29(3), 265–288 CrossRef CAS.
- P. Marrone, M. Hodes, K. Smith and J. Tester, Salt precipitation and scale control in supercritical water oxidation–Part B: Commercial/full-scale applications, J. Supercrit. Fluids, 2004, 29(3), 289–312 CrossRef CAS.
- R. Lachance, unpublished data, 2007.
- J. Beér, High efficiency electric power generation: The environmental role, Prog. Energy Combust. Sci., 2007, 33(2), 107–134 CrossRef.
- J. Longwell, E. Rubin and J. Wilson, Coal: Energy for the future, Prog. Energy Combust. Sci., 1995, 21(4), 269–360 CrossRef CAS.
- O. Bobleter, Hydrothermal degradation of polymers derived from plants, Prog. Polym. Sci., 1994, 19, 797–841 CrossRef CAS.
- R. Venderbosch, C. Sander and B. Tjeerdsma, Hydrothermal conversion of wet biomass, Technical Report GAVE-9919, Netherlands Agency for Energy and the Environment, 2000 Search PubMed.
- Y. Matsumura, M. Sasaki, K. Okuda, S. Takami, S. Ohara, M. Umetsu and T. Adschiri, Supercritical water treatment of biomass for energy and material recovery, Combust. Sci. Technol., 2006, 178(1–3), 509–536 CrossRef CAS.
- Fundamentals of Thermochemical Biomass Conversion, ed. R. P. Overend, T. A. Milne and L. K. Mudge, Elsevier Applied Science Publishers, 1985 Search PubMed.
- Research in Thermochemical Biomass Conversion, ed. A. Bridgwater and J. Kuester, Elsevier Applied Science, 1988 Search PubMed.
- Advances in Thermochemical Biomass Conversion, ed. A. Bridgwater, Blackie Academic & Professional, 1994 Search PubMed.
- Developments in thermochemical biomass conversion, ed. A. Bridgwater and D. Boocock, Blackie Academic & Professional, 1997 Search PubMed.
- Progress in thermochemical biomass conversion, ed. A. Bridgwater, Blackwell Science, 2001 Search PubMed.
- B. R. T. Simoneit, Aqueous high-temperature and high-pressure organic geochemistry of hydrothermal vent systems, Geochim. Cosmochim. Acta, 1993, 57(14), 3231–3243 CrossRef CAS.
- A. C. Hack, J. Hermann and J. A. Mavrogenes, Mineral solubility and hydrous melting relations in the deep earth: Analysis of some binary A H2O system pressure-temperature-composition topologies, Am. J. Sci., 2007, 307(5), 833–855 Search PubMed.
- R. Narayan and M. J. Antal Jr, Influence of pressure on the acid-catalyzed rate constant for 1-propanol dehydration in supercritical water, J. Am. Chem. Soc., 1990, 112(5), 1927–1931 CrossRef CAS.
- M. J. Antal Jr, A. Brittain, C. DeAlmeida, S. Ramayya and J. C. Roy, Heterolysis and homolysis in supercritical water, in Supercritical Fluids: Chemical and Engineering Principles and Applications (ACS Symposium Series 329), 1987, pp. 77–86 Search PubMed.
- S. Ramayya, A. Brittain, C. DeAlmeida, W. Mok and M. J. Antal Jr, Acid-catalysed dehydration of alcohols in supercritical water, Fuel, 1987, 66(10), 1364–1371 CrossRef CAS.
- X. Xu, C. P. De Almeida and M. J. Antal Jr, Mechanism and kinetics of the acid-catalyzed formation of ethene and diethyl ether from ethanol in supercritical water, Ind. Eng. Chem. Res., 1991, 30(7), 1478–1485 CrossRef CAS.
- X. Xu, M. Antal Jr and D. Anderson, Mechanism and temperature-dependent kinetics of the dehydration of tert-butyl alcohol in hot compressed liquid water, Ind. Eng. Chem. Res., 1997, 36(1), 23–41 CrossRef CAS.
- X. Xu and M. J. Antal Jr, Kinetics and mechanism of isobutene formation from t-butanol in hot liquid water, AIChE J., 1994, 40(9), 1524–1534 CAS.
- M. Antal Jr, M. Carlsson, X. Xu and D. Anderson, Mechanism and kinetics of the acid-catalyzed dehydration of 1- and 2-propanol in hot compressed liquid water, Ind. Eng. Chem. Res., 1998, 37(10), 3820–3829 CrossRef CAS.
- J. M. L. Penninger, Reactions of di-n-butylphthalate in water at near-critical temperature and pressure, Fuel, 1988, 67(4), 490–496 CAS.
- F. Goudriaan and D. G. R. Peferoen, Liquid fuels from biomass via a hydrothermal process, Chem. Eng. Sci., 1990, 45(8), 2729–2734 CrossRef CAS.
- M. Watanabe, T. Iida and H. Inomata, Decomposition of a long chain saturated fatty acid with some additives in hot compressed water, Energy Convers. Manage., 2006, 47(18–19), 3344–3350 CrossRef CAS.
- D. Boocock and K. Sherman, Further aspects of powdered poplar wood liquefaction by aqueous pyrolysis, Can. J. Chem. Eng., 1985, 63, 627–633 CrossRef CAS.
- G. C. A. Luijkx, F. van Rantwijk, H. van Bekkum and M. J. Antal Jr, The role of deoxyhexonic acids in the hydrothermal decarboxylation of carbohydrates, Carbohydr. Res., 1995, 272(2), 191–202 CrossRef CAS.
- W. S. L. Mok, M. J. Antal Jr and M. Jones, Formation of acrylic acid from lactic acid in supercritical water, J. Org. Chem., 1989, 54(19), 4596–4602 CrossRef CAS.
- M. Carlsson, C. Habenicht, L. C. Kam, M. J. Antal Jr, N. Bian, R. J. Cunningham and M. Jones, Study of the sequential conversion of citric to itaconic to methacrylic acid in near-critical and supercritical water, Ind. Eng. Chem. Res., 1994, 33(8), 1989–1996 CrossRef CAS.
- G. Bonn, M. Rinderer and O. Bobleter, Hydrothermal degradation and kinetic studies of 1,3-dihydroxy-2-propanone and 2,3-dihydroxypropanal, J. Carbohydr. Chem., 1985, 4(1), 67–77 CrossRef CAS.
- R. Krishna, M. Kallury, C. Ambidge, T. T. Tidwell, D. G. B. Boocock, F. A. Agblevor and D. J. Stewart, Rapid hydrothermolysis of cellulose and related carbohydrates, Carbohydr. Res., 1986, 158, 253–261 CrossRef.
- M. J. Antal Jr, W. S. L. Mok and G. N. Richards, Mechanism of formation of 5-(hydroxymethyl)-2-furaldehyde from D-fructose and sucrose, Carbohydr. Res., 1990, 199(1), 91–109 CrossRef CAS.
- M. J. Antal Jr, W. S. L. Mok and G. N. Richards, Four-carbon model compounds for the reactions of sugars in water at high temperature, Carbohydr. Res., 1990, 199(1), 111–115 CrossRef.
- G. C. A. Luijkx, F. van Rantwijk and H. van Bekkum, Hydrothermal formation of 1,2,4-benzenetriol from 5-hydroxymethyl-2-furaldehyde and D-fructose, Carbohydr. Res., 1993, 242, 131–139 CrossRef CAS.
- B. Kabyemela, T. Adschiri, R. Malaluan and K. Arai, Glucose and fructose decomposition in subcritical and supercritical water: Detailed reaction pathway, mechanisms, and kinetics, Ind. Eng. Chem. Res., 1999, 38(8), 2888–2895 CrossRef CAS.
- F. Jin, Z. Zhou, H. Enomoto, T. Moriya and H. Higashijima, Conversion mechanism of cellulosic biomass to lactic acid in subcritical water and acid–base catalytic effect of subcritical water, Chem. Lett., 2004, 33(2), 126–127 CrossRef CAS.
- B. M. Kabyemela, T. Adschiri, R. M. Malaluan and K. Arai, Kinetics of glucose epimerization and decomposition in subcritical and supercritical water, Ind. Eng. Chem. Res., 1997, 36(5), 1552–1558 CrossRef CAS.
- F. Salak Asghari and H. Yoshida, Acid-catalyzed production of 5-hydroxymethyl furfural from D-fructose in subcritical water, Ind. Eng. Chem. Res., 2006, 45(7), 2163–2173 CrossRef CAS.
- Y. Matsumura, S. Yanachi and T. Yoshida, Glucose decomposition kinetics in water at 25 MPa in the temperature range of 448–673 K, Ind. Eng. Chem. Res., 2006, 45(6), 1875–1879 CrossRef CAS.
- O. Bobleter and G. Pape, Der hydrothermale Abbau von Glucose, Monatsh. Chem., 1968, 99, 1560–1567 CrossRef CAS.
- S. Amin, R. C. Reid and M. Modell, Reforming and decomposition of glucose in an aqueous phase, in Intersociety Conference on Environmental Systems, San Francisco, ASME Paper 75-ENAS-21, 1975 Search PubMed.
- Z. Srokol, A. G. Bouche, A. van Estrik, R. C. J. Strik, T. Maschmeyer and J. A. Peters, Hydrothermal upgrading of biomass to biofuel; studies on some monosaccharide model compounds, Carbohydr. Res., 2004, 339(10), 1717–1726 CrossRef CAS.
- H. R. Holgate, J. C. Meyer and J. W. Tester, Glucose hydrolysis and oxidation in supercritical water, AIChE J., 1995, 41(3), 637–648 CrossRef CAS.
- Q. Xiang, Y. Lee and R. Torget, Kinetics of glucose decomposition during dilute-acid hydrolysis of lignocellulosic biomass, Appl. Biochem. Biotechnol., 2004, 115(1), 1127–1138 CrossRef.
- G. Bonn and O. Bobleter, Determination of the hydrothermal degradation products of D-(U-14C) glucose and D-(U-14C) fructose by TLC, J. Radioanal. Nucl. Chem., 1983, 79(2), 171–177 Search PubMed.
- M. Kunz, Hydroxymethylfurfural—a possible basic chemical for industrial intermediates, in Stud. Plant. Sci. Vol. 3 Inulin and inulin-containing crops, ed. A. Fuchs, Elsevier, Amsterdam, New York, 1993, pp. 149–160 Search PubMed.
- Y. Roman-Leshkov, C. J. Barrett, Z. Y. Liu and J. A. Dumesic, Production of dimethylfuran for liquid fuels from biomass-derived carbohydrates, Nature, 2007, 447(7147), 982–985 CrossRef CAS.
- D. A. Nelson, P. M. Molton, J. A. Russell and R. T. Hallen, Application of direct thermal liquefaction for the conversion of cellulosic biomass, Ind. Eng. Chem. Prod. Res. Dev., 1984, 23(3), 471–475 CrossRef CAS.
- M. Modell, Gasification and liquefaction of forest products in supercritical water, in Fundamentals of Thermochemical Biomass Conversion, ed. R. P. Overend, T. A. Milne and L. K. Mudge, Elsevier Applied Science, New York, 1985, pp. 95–119 Search PubMed.
- G. A. Woerner, Thermal decomposition and reforming of glucose and wood at the critical conditions of water, Master's thesis, Massachusetts Institute of Technology, Cambridge, Massachusetts, 1976 Search PubMed.
- M. J. Antal Jr, T. Leesomboon, W. S. Mok and G. N. Richards, Mechanism of formation of 2-furaldehyde from D-xylose, Carbohydr. Res., 1991, 217, 71–85 CrossRef.
- X. Qian, M. Nimlos, D. Johnson and M. Himmel, Acidic sugar degradation pathways, Appl. Biochem. Biotechnol., 2005, 124(1), 989–997 CrossRef.
- Q. Jing and X. Y. Lu, Kinetics of non-catalyzed decomposition of D-xylose in high temperature liquid water, Chin. J. Chem. Eng., 2007, 15(5), 666–669 Search PubMed.
- M. Sasaki, T. Hayakawa, K. Arai and T. Adschiri, Measurement of the rate of retro-aldol condensation of D-xylose in subcritical and supercritical water, in Hydrothermal Reactions and Techniques: The Proceedings of the Seventh International Symposium on Hydrothermal Reactions, ed. S. Feng, J. Chen and Z. Shi, World Scientific Publishing Co., Singapore, 2003, pp. 169–176 Search PubMed.
- D. Nelson; R. Hallen and O. Theander, Formation of aromatic compounds from carbohydrates: Reaction of xylose, glucose, and glucuronic acid in acidic solution at 300 °C, in Pyrolysis oils from biomass (ACS Symposium Series 376), chapter 11, ed. E. Soltes and T. Milne, American Chemical Society, 1988, pp. 113–118 Search PubMed.
- M. Nagamori and T. Funazukuri, Glucose production by hydrolysis of starch under hydrothermal conditions, J. Chem. Technol. Biotechnol., 2004, 79(3), 229–233 CrossRef CAS.
- T. Miyazawa and T. Funazukuri, Polysaccharide hydrolysis accelerated by adding carbon dioxide under hydrothermal conditions, Biotechnol. Prog., 2005, 21(6), 1782–1785 CrossRef CAS.
- G. Garrote, H. Domnguez and J. C. Paraj, Hydrothermal processing of lignocellulosic materials, Holz Roh- Werkst., 1999, 57(3), 191–202 CrossRef CAS.
- W. S. L. Mok and M. J. Antal Jr, Uncatalyzed solvolysis of whole biomass hemicellulose by hot compressed liquid water, Ind. Eng. Chem. Res., 1992, 31(4), 1157–1161 CrossRef CAS.
- N. Mosier, C. Wyman, B. Dale, R. Elander, Y. Lee, M. Holtzapple and M. Ladisch, Features of promising technologies for pretreatment of lignocellulosic biomass, Bioresour. Technol., 2005, 96(6), 673–686 CrossRef CAS.
- Y. Yu, X. Lou and H. W. Wu, Some recent advances in hydrolysis of biomass in hot-compressed water and its comparisons with other hydrolysis methods, Energy Fuels, 2008, 22(1), 46–60 CrossRef CAS.
- W. S. Mok, M. Antal Jr and G. Varhegyi, Productive and prarasitic pathways in dilute acid catalysed hydrolysis of cellulose, Ind. Eng. Chem. Res., 1992, 31, 94–100 CrossRef CAS.
- W. Schwald and O. Bobleter, Hydrothermolysis of cellulose under static and dynamic conditions at high temperatures, J. Carbohydr. Chem., 1989, 8(4), 565–578 CrossRef CAS.
- T. Adschiri, S. Hirose, R. Malaluan and K. Arai, Noncatalytic conversion of cellulose in supercritical and subcritical water, J. Chem. Eng. Jpn., 1993, 26(6), 676–680 CrossRef CAS.
- K. Mochidzuki, A. Sakoda and M. Suzuki, Measurement of the hydrothermal reaction rate of cellulose using novel liquid-phase thermogravimetry, Thermochim. Acta, 2000, 348(1–2), 69–76 CrossRef CAS.
- M. Sasaki, Z. Fang, Y. Fukushima, T. Adschiri and K. Arai, Dissolution and hydrolysis of cellulose in subcritical and supercritical water, Ind. Eng. Chem. Res., 2000, 39(8), 2883–2890 CrossRef CAS.
- M. Sasaki, T. Adschiri and K. Arai, Kinetics of cellulose conversion at 25 MPa in sub- and supercritical water, AIChE J., 2004, 50(1), 192–202 CrossRef CAS.
- M. Antal Jr, G. Varhegyi and E. Jakab, Cellulose pyrolysis kinetics: Revisited, Ind. Eng. Chem. Res., 1998, 37(4), 1267–1275 CrossRef.
- S. Deguchi, K. Tsujii and K. Horikoshi, Cooking cellulose in hot and compressed water, Chem. Commun., 2006, 3293–3295 RSC.
- G. Wu, M. Heitz and E. Chornet, Improved alkaline oxidation process for the production of aldehydes (vanillin and syringaldehyde) from steam-explosion hardwood lignin, Ind. Eng. Chem. Res., 1994, 33(3), 718–723 CrossRef CAS.
- Q. Xiang and Y. Lee, Production of oxychemicals from precipitated hardwood lignin, Appl. Biochem. Biotechnol., 2001, 91–93(1), 71–80 CrossRef CAS.
- A. Quitain, N. Sato, H. Daimon and K. Fujie, Qualitative investigation on hydrothermal treatment of hinoki (Chamaecyparis obtusa) bark for production of useful chemicals, J. Agric. Food Chem., 2003, 51(27), 7926–7929 CrossRef CAS.
- K. Okuda, X. Man, M. Umetsu, S. Takami and T. Adschiri, Efficient conversion of lignin into single chemical species by solvothermal reaction in water-p-cresol solvent, J. Phys.: Condensed Matter, 2004, 16(14), S1325–S1330 CrossRef CAS.
- T. Funazukuri, N. Wakao and J. M. Smith, Liquefaction of lignin sulfonate with subcritical and supercritical water, Fuel, 1990, 69(3), 349–353 CrossRef CAS.
- M. Saisu, T. Sato, M. Watanabe, T. Adschiri and K. Arai, Conversion of lignin with supercritical water-phenol mixtures, Energy Fuels, 2003, 17(4), 922–928 CrossRef CAS.
- S. Karagöz, T. Bhaskar, A. Muto and Y. Sakata, Comparative studies of oil compositions produced from sawdust, rice husk, lignin and cellulose by hydrothermal treatment, Fuel, 2005, 84(7–8), 875–884 CrossRef.
- S. Karagöz, T. Bhaskar, A. Muto and Y. Sakata, Hydrothermal upgrading of biomass: Effect of K2CO3 concentration and biomass/water ratio on products distribution, Bioresour. Technol., 2006, 97(1), 90–98 CrossRef.
- T. Yoshida and Y. Matsumura, Gasification of cellulose, xylan, and lignin mixtures in supercritical water, Ind. Eng. Chem. Res., 2001, 40(23), 5469–5474 CrossRef CAS.
- T. Sato, T. Furusawa, Y. Ishiyama, H. Sugito, Y. Miura, M. Sato, N. Suzuki and N. Itoh, Effect of water density on the gasification of lignin with magnesium oxide supported nickel catalysts in supercritical water, Ind. Eng. Chem. Res., 2006, 45(2), 615–622 CrossRef CAS.
- M. Osada, N. Hiyoshi, O. Sato, K. Arai and M. Shirai, Reaction pathway for catalytic gasification of lignin in presence of sulfur in supercritical water, Energy Fuels, 2007, 21(4), 1854–1858 CrossRef CAS.
- T. Furusawa, T. Sato, H. Sugito, Y. Miura, Y. Ishiyama, M. Sato, N. Itoh and N. Suzuki, Hydrogen production from the gasification of lignin with nickel catalysts in supercritical water, Int. J. Hydrogen Energy, 2007, 32(6), 699–704 CrossRef CAS.
- M. Osada, O. Sato, M. Watanabe, K. Arai and M. Shirai, Water density effect on lignin gasification over supported noble metal catalysts in supercritical water, Energy Fuels, 2006, 20(3), 930–935 CrossRef CAS.
- M. Osada, T. Sato, M. Watanabe, T. Adschiri and K. Arai, Low-temperature catalytic gasification of lignin and cellulose with a ruthenium catalyst in supercritical water, Energy Fuels, 2004, 18(2), 327–333 CrossRef CAS.
- P. Khuwijitjaru, S. Adachi and R. Matsuno, Solubility of saturated fatty acids in water at elevated temperatures, Biosci. Biotechnol. Biochem., 2002, 66(8), 1723–1726 CrossRef CAS.
- V. Mills and H. McClain, Fat hydrolysis, Ind. Eng. Chem., 1949, 41(9), 1982–1985 CrossRef CAS.
- J. King, R. Holliday and G. List, Hydrolysis of soybean oil in a subcritical water flow reactor, Green Chem., 1999, 1(6), 261–264 RSC.
- L. Lascaray, Industrial fat splitting, J. Am. Oil Chem. Soc., 1952, 29(9), 362–366 CrossRef CAS.
- R. A. Tilghman, Improvement in process for purifying fatty bodies, US Pat., 11766, 1854 Search PubMed.
- H. Barnebey and A. Brown, Continuous fat splitting plants using the Colgate-Emery process, J. Am. Oil Chem. Soc., 1948, 25, 95–99.
- P. H. Moquin and F. Temelli, Kinetic modeling of hydrolysis of canola oil in supercritical media, J. Supercrit. Fluids, 2008, 45(1), 94–101 CrossRef CAS.
- T. Fujii, P. Khuwijitjaru, Y. Kimura and S. Adachi, Decomposition kinetics of monoacyl glycerol and fatty acid in subcritical water under temperature-programmed heating conditions, Food Chem., 2006, 94(3), 341–347 CrossRef CAS.
- P. Maiella and T. Brill, Spectroscopy of hydrothermal reactions. 10. Evidence of wall effects in decarboxylation kinetics of 1.00 m HCO2X (X = H, Na) at 280–330 °C and 275 bar, J. Phys. Chem. A, 1998, 102(29), 5886–5891 CrossRef CAS.
- J. L. S. Bell, D. A. Palmer, H. L. Barnes and S. E. Drummond, Thermal decomposition of acetate: III. Catalysis by mineral surfaces, Geochim. Cosmochim. Acta, 1994, 58(19), 4155–4177 CrossRef CAS.
- J. C. Meyer, P. A. Marrone and J. W. Tester, Acetic acid oxidation and hydrolysis in supercritical water, AIChE J., 1995, 41(9), 2108–2121 CrossRef CAS.
- H. Yoshida, M. Terashima and Y. Takahashi, Production of organic acids and amino acids from fish meat by sub-critical water hydrolysis, Biotechnol. Prog., 1999, 15(6), 1090–1094 CrossRef CAS.
- T. Rogalinski, S. Herrmann and G. Brunner, Production of amino acids from bovine serum albumin by continuous sub-critical water hydrolysis, J. Supercrit. Fluids, 2005, 36(1), 49–58 CrossRef CAS.
- A. T. Quitain, H. Daimon, K. Fujie, S. Katoh and T. Moriyoshi, Microwave-assisted hydrothermal degradation of silk protein to amino acids, Ind. Eng. Chem. Res., 2006, 45(13), 4471–4474 CrossRef CAS.
- A. Quitain, N. Sato, H. Daimon and K. Fujie, Production of valuable materials by hydrothermal treatment of shrimp shells, Ind. Eng. Chem. Res., 2001, 40(25), 5885–5888 CrossRef CAS.
- J. Corliss, J. Baross and S. Hoffman, An hypothesis concerning the relationship between submarine hot springs and the origin of life on earth, Oceanol. Acta, 1981,(Supplement), 59–69.
- D. Klingler, J. Berg and H. Vogel, Hydrothermal reactions of alanine and glycine in sub- and supercritical water, J. Supercrit. Fluids, 2007, 43(1), 112–119 CrossRef CAS.
- N. Sato, A. T. Quitain, K. Kang, H. Daimon and K. Fujie, Reaction kinetics of amino acid decomposition in high-temperature and high-pressure water, Ind. Eng. Chem. Res., 2004, 43(13), 3217–3222 CrossRef CAS.
- J. Li and T. B. Brill, Spectroscopy of hydrothermal reactions, Part 26: Kinetics of decarboxylation of aliphatic amino acids and comparison with the rates of racemization, Int. J. Chem. Kinet., 2003, 35(11), 602–610 CrossRef CAS.
- T. M. McCollom, G. Ritter and B. R. T. Simoneit, Lipid synthesis under hydrothermal conditions by Fischer-Tropsch-type reactions, Origins Life Evol. Biosphere, 1999, 29(2), 153–166 CrossRef CAS.
- A. I. Rushdi and B. R. T. Simoneit, Lipid formation by aqueous Fischer-Tropsch-type synthesis over a temperature range of 100 to 400 °C, Origins Life Evol. Biosphere, 2001, 31(1–2), 103–118 CrossRef CAS.
- M. E. Berndt, D. E. Allen and W. E. Seyfried, Reduction of CO2 during serpentinization of olivine at 300 °C and 500 bar, Geology, 1996, 24(4), 351–354 CrossRef CAS.
- N. G. Holm and J. L. Charlou, Initial indications of abiotic formation of hydrocarbons in the Rainbow ultramafic hydrothermal system, Mid-Atlantic Ridge, Earth Planet. Sci. Lett., 2001, 191(1–2), 1–8 CrossRef CAS.
- E. Berl, Production of oil from plant material, Science, 1944, 99(2573), 309–312 CrossRef CAS.
- E. Berl, Origin of asphalts, oil, natural gas and bituminous coal, Science, 1934, 80(2071), 227–228 CrossRef CAS.
- A. M. Aitani, Oil refining and products, in Encyclopedia of Energy, ed. C. J. Cleveland, Elsevier, New York, 2004, vol. 4, pp. 715–729 Search PubMed.
- P. Grange, E. Laurent, R. Maggi, A. Centeno and B. Delmon, Hydrotreatment of pyrolysis oils from biomass: Reactivity of the various categories of oxygenated compounds and preliminary techno-economical study, Catal. Today, 1996, 29(1–4), 297–301 CrossRef CAS.
- E. Furimsky, Catalytic hydrodeoxygenation, Appl. Catal. A: General, 2000, 199(2), 147–190 CrossRef CAS.
- D. C. Elliott, D. Beckman, A. V. Bridgwater, J. P. Diebold, S. B. Gevert and Y. Solantausta, Developments in direct thermochemical liquefaction of biomass: 1983–1990, Energy Fuels, 1991, 5(3), 399–410 CrossRef CAS.
- A. Demirbas, Mechanisms of liquefaction and pyrolysis reactions of biomass, Energy Convers. Manage., 2000, 41(6), 633–646 CrossRef CAS.
- A. V. Bridgwater, D. Meier and D. Radlein, An overview of fast pyrolysis of biomass, Org. Geochem., 1999, 30(12), 1479–1493 CrossRef.
- D. Elliott and G. Schiefelbein, Liquid hydrocarbon fuels from biomass, in American Chemical Society, Division of Fuel Chemistry Annual Meeting Preprints, 1989, vol. 34, pp. 1160–1166 Search PubMed.
- F. Goudriaan, B. van de Beld, F. Boerefijn, G. Bos, J. Naber, S. van der Wal and J. Zeevalkink, Thermal efficiency of the HTU® process for biomass liquefaction, in Progress in Thermochemical Biomass Conversion, Tyrol, Austria, ed. A. Bridgwater, Blackwell Science, 2001, 1312–1325 Search PubMed.
- M. Dietenberger and M. Anderson, Vision of the U.S. biofuel future: A case for hydrogen-enriched biomass gasification, Ind. Eng. Chem. Res., 2007, 46(26), 8863–8874 CrossRef CAS.
- H. Davis, C. Figueroa and L. Schaleger, Hydrogen or carbon monoxide in the liquefaction of biomass, in World Hydrogen Energy Conference IV, 1982 Search PubMed.
- B. J. He, Y. Zhang, Y. Yin, T. L. Funk and G. L. Riskowski, Effects of alternative process gases on the thermochemical conversion process of swine manure, Trans. ASAE, 2001, 44(6), 1873–1880 Search PubMed.
- P. Thigpen and W. Berry Jr, Liquid fuels from wood by continuous operation of the Albany, Oregon biomass liquefaction facility, in Energy from Biomass and Wastes VI, ed. D. L. Klass, Institute of Gas Technology, 1982, pp. 1057–1095 Search PubMed.
- D. J. Stevens, Review and analysis of the 1980–1989 biomass thermochemical conversion program, Technical report, U.S. Department of Energy, NREL/TP-421-7501, 1994 Search PubMed.
- B. J. He, Y. Zhang, Y. Yin, T. L. Funk and G. L. Riskowski, Operating temperature and retention time effects on the thermochemical conversion process of swine manure, Trans. ASAE, 2000, 43(6), 1821–1825 Search PubMed.
- B. J. He, Y. Zhang, Y. Yin, T. L. Funk and G. L. Riskowski, Preliminary characterization of raw oil products from the thermochemical conversion of swine manure, Trans. ASAE, 2001, 44(6), 1865–1871 Search PubMed.
- S. Karagöz, T. Bhaskar, A. Muto, Y. Sakata and M. Uddin, Low-temperature hydrothermal treatment of biomass: Effect of reaction parameters on products and boiling point distributions, Energy Fuels, 2004, 18(1), 234–241 CrossRef.
- D. White and D. Wolf, Direct biomass liquefaction by an extruder-feeder system, Chem. Eng. Commun., 1995, 135, 1–19 CrossRef CAS.
- T. Minowa, M. Murakami, Y. Dote, T. Ogi and S. Yokoyama, Oil production from garbage by thermochemical liquefaction, Biomass Bioenergy, 1995, 8(2), 117–120 CrossRef CAS.
- T. Minowa, S. Yokoyama, M. Kishimoto and T. Okakura, Oil production from algal cells of dunaliella tertiolecta by direct thermochemical liquefaction, Fuel, 1995, 74(12), 1735–1738 CrossRef CAS.
- Y. Dote, S. Sawayama, S. Inoue, T. Minowa and S. Yokoyama, Recovery of liquid fuel from hydrocarbon-rich microalgae by thermochemical liquefaction, Fuel, 1994, 73(12), 1855–1857 CrossRef CAS.
- D. Elliott, Historical developments in hydroprocessing bio-oils, Energy Fuels, 2007, 21(3), 1792–1815 CrossRef CAS.
- P. Grange and X. Vanhaeren, Hydrotreating catalysts, an old story with new challenges, Catal. Today, 1997, 36(4), 375–391 CrossRef CAS.
- M. Roberts; J. Williams; P. Halberstadt; D. Sanders; and T. Adams, Animal waste to marketable products, in Natural Gas Technologies Conference. Phoenix, Arizona, USA, 2004 Search PubMed.
- T. N. Adams and B. S. Appel, Converting turkey offal into bio-derived hydrocarbon oil with the CWT thermal process, in Power-Gen Renewable Energy Conference, Las Vegas, Nevada, 2004 Search PubMed.
- M. Fröling, A. Peterson and J. Tester, Hydrothermal processing in biorefineries—a case study of the environmental performance, in 7th World Congress of Chemical Engineers, Glasgow, Scotland, 2005 Search PubMed.
- M. Svanström, T. N. Patrick, M. Fröling, A. A. Peterson and J. W. Tester, Choosing between green innovative technologies: Hydrothermal processing of biowastes, J. Adv. Oxid. Technol., 2007, 10(1), 177–185 Search PubMed.
- M. Modell, Reforming of glucose and wood at critical conditions of water, Mech. Eng., 1977, 99(10), 108 Search PubMed.
- M. Modell, Reforming of glucose and wood at the critical conditions of water, in Intersociety Conference on Environmental Systems, 7th, ASME, SAE, AIAA, ASMA, AIChE, San Francisco, 1977 Search PubMed.
- M. Modell, R. Reid and S. Amin, Gasification process, US Pat., 4113446, 1978 Search PubMed.
- M. Modell, Reforming of organic-substances in supercritical water, J. Electrochem. Soc., 1980, 127(3), C139–C139.
- Y. Matsumura, T. Minowa, B. Potic, S. Kersten, W. Prins, W. Van Swaaij, B. Van De Beld, D. Elliott, G. Neuenschwander, A. Kruse and M. Antal Jr, Biomass gasification in near- and super-critical water: Status and prospects, Biomass Bioenergy, 2005, 29(4), 269–292 CrossRef CAS.
- Y. Calzavara, C. Joussot-Dubien, G. Boissonnet and S. Sarrade, Evaluation of biomass gasification in supercritical water process for hydrogen production, Energy Convers. Manage., 2005, 46(4), 615–631 CrossRef CAS.
- S. Manarungson, W. S. Mok and M. J. Antal Jr, Gasification of glucose and wet biomass in supercritical water, Abstr. Pap. Am. Chem. Soc., 1990, 199 Search PubMed , Paper CELL-107.
- M. Antal Jr, S. Allen, D. Schulman, X. Xu and R. Divilio, Biomass gasification in supercritical water, Ind. Eng. Chem. Res., 2000, 39(11), 4040–4053 CrossRef.
- X. Xu and M. Antal Jr, Gasification of sewage sludge and other biomass for hydrogen production in supercritical water, Environ. Prog., 1998, 17(4), 215–220 CrossRef CAS.
- Y. Matsumura, X. Xu and M. Antal Jr, Gasification characteristics of an activated carbon in supercritical water, Carbon, 1997, 35(6), 819–824 CrossRef CAS.
- X. Xu, Y. Matsumura, J. Stenberg and M. Antal Jr, Carbon-catalyzed gasification of organic feedstocks in supercritical water, Ind. Eng. Chem. Res., 1996, 35(8), 2522–2530 CrossRef CAS.
- D. Yu, M. Aihara and M. Antal Jr, Hydrogen production by steam reforming glucose in supercritical water, Energy Fuels, 1993, 7(5), 574–577 CrossRef CAS.
- Y. Matsumura, T. Minowa, X. Xu, F. Nuessle, T. Adschiri and M. Antal Jr, High-pressure carbon dioxide removal in supercritical water gasification of biomass, in Developments in Thermochemical Biomass Conversion, ed. A. Bridgwater and D. Boocock, Blackie Academic & Professional, 1997, pp. 864–877 Search PubMed.
- H. Schmieder, J. Abeln, N. Boukis, E. Dinjus, A. Kruse, M. Kluth, G. Petrich, E. Sadri and M. Schacht, Hydrothermal gasification of biomass and organic wastes, J. Supercrit. Fluids, 2000, 17(2), 145–153 CrossRef CAS.
- A. Kruse, A. Krupka, V. Schwarzkopf, C. Gamard and T. Henningsen, Influence of proteins on the hydrothermal gasification and liquefaction of biomass. 1. Comparison of different feedstocks, Ind. Eng. Chem. Res., 2005, 44(9), 3013–3020 CrossRef CAS.
- A. Kruse and E. Dinjus, Influence of salts during hydrothermal biomass gasification: The role of the catalysed water-gas shift reaction, Z. Phys. Chem., 2005, 219(3), 341–366 CrossRef CAS.
- N. Boukis, U. Galla, P. D’Jesus, H. Müller and E. Dinjus, Gasification of wet biomass in supercritical water: Results of pilot plant experiments, in 14th European Biomass Conference, Paris, France, 2005 Search PubMed.
- A. Kruse, P. Maniam and F. Spieler, Influence of proteins on the hydrothermal gasification and liquefaction of biomass. 2. Model compounds, Ind. Eng. Chem. Res., 2007, 46(1), 87–96 CrossRef CAS.
- A. Kruse and M. Faquir, Hydrothermal biomass gasification - effects of salts, backmixing, and their interaction, Chem. Eng. Technol., 2007, 30(6), 749–754 CrossRef CAS.
- P. D'Jesús, N. Boukis, B. Kraushaar-Czarnetzki and E. Dinjus, Influence of process variables on gasification of corn silage in supercritical water, Ind. Eng. Chem. Res., 2006, 45(5), 1622–1630 CrossRef CAS.
- B. Potic, L. de Beld, D. Assink, W. Prins and W. van Swaaij, Gasification of biomass in supercritical water, in Proceedings of the 12th European Conference and Exhibition on Biomass for Energy, Industry, and Climate Protection, ETA Florence, WIP Munich: Amsterdam, 2002, p. 777 Search PubMed.
- B. Potic, S. Kersten, M. Ye, M. van der Hoef, J. Kuipers and W. van Swaaij, Fluidization with hot compressed water in micro-reactors, Chem. Eng. Sci., 2005, 60(22), 5982–5990 CrossRef CAS.
- B. Potic, S. Kersten, W. Prins and W. Van Swaaij, A high-throughput screening technique for conversion in hot compressed water, Ind. Eng. Chem. Res., 2004, 43(16), 4580–4584 CrossRef CAS.
- S. Kersten, B. Potic, W. Prins and W. Van Swaaij, Gasification of model compounds and wood in hot compressed water, Ind. Eng. Chem. Res., 2006, 45(12), 4169–4177 CrossRef CAS.
- A. Kato and Y. Matsumura, Hydrothermal pulping of wet biomass as pretreatment for supercritical water gasification studied using cabbage as a model compound, J. Jpn. Inst. Energy, 2003, 82(2), 97–102 Search PubMed.
- Y. Matsumura, Biomass gasification in supercritical water with partial oxidation, in Proceedings of the 8th Meeting on Supercritical Fluids, Chemical Reactivity and Material Processing in Supercritical Fluids, Bordeaux, 2002, pp. 707–712 Search PubMed.
- Y. Matsumura, M. Harada, D. Li, H. Komiyama, Y. Yoshida, H. Ishitani, H. Fukunaga and K. Yamada, Partial oxidation of biomass in supercritical water for gasification and successive methanol production, in AIChE 2002 Annual Meeting, Indianapolis, November 3–8, 2002 Search PubMed.
- T. Yoshida, Y. Oshima and Y. Matsumura, Gasification of biomass model compounds and real biomass in supercritical water, Biomass Bioenergy, 2004, 26(1), 71–78 CrossRef CAS.
- X. Hao, L. Guo, X. Zhang and Y. Guan, Hydrogen production from catalytic gasification of cellulose in supercritical water, Chem. Eng. J., 2005, 110(1–3), 57–65 CrossRef CAS.
- Y. Lu, L. Guo, C. Ji, X. Zhang, X. Hao and Q. Yan, Hydrogen production by biomass gasification in supercritical water: A parametric study, Int. J. Hydrogen Energy, 2006, 31(7), 822–831 CrossRef CAS.
- L. Guo, Y. Lu, X. Zhang, C. Ji, Y. Guan and A. Pei, Hydrogen production by biomass gasification in supercritical water: A systematic experimental and analytical study, Catal. Today, 2007, 129(3–4), 275–286 CrossRef CAS.
- Y. Lu, L. Guo, X. Zhang and Q. Yan, Thermodynamic modeling and analysis of biomass gasification for hydrogen production in supercritical water, Chem. Eng. J., 2007, 131(1–3), 233–244 CrossRef CAS.
- T. M. McCollom and J. S. Seewald, A reassessment of the potential for reduction of dissolved CO2 to hydrocarbons during serpentinization of olivine, Geochim. Cosmochim. Acta, 2001, 65(21), 3769–3778 CrossRef CAS.
- W. S. L. Mok and M. J. Antal Jr, Effects of pressure on biomass pyrolysis. I. Cellulose pyrolysis products, Thermochim. Acta, 1983, 68(2–3), 155–164 CrossRef CAS.
- W. S. L. Mok and M. J. Antal Jr, Effects of pressure on biomass pyrolysis. II. Heats of reaction of cellulose pyrolysis, Thermochim. Acta, 1983, 68(2–3), 165–186 CrossRef CAS.
- J. C. Roy, W. S. L. Mok and M. J. Antal Jr, Flash pyrolysis studies of glycerol and 1,3-dioxolane in supercritical water, Abstr. Pap. Am. Chem. Soc., 1984, 188(AUG) Search PubMed , Paper 44-CARB.
- M. J. Antal Jr, C. P. DeAlmeida, W. S. Mok, S. V. Ramayya and J. C. Roy, Reaction chemistry of organic (biomass) solutes in supercritical solvents, Abstr. Pap. Am. Chem. Soc., 1985, 190(SEP) Search PubMed , Paper 60-FUEL.
- M. Antal Jr, Biomass programs, Science, 1985, 228(4697), 264 CrossRef.
- M. Antal Jr, Y. Matsumura and X. Xu, Catalytic gasification of wet biomass in supercritical water, Abstr. Pap. Am. Chem. Soc., 1995, 209 Search PubMed , Paper 62-FUEL.
- E. Dinjus and A. Kruse, Hot compressed water - a suitable and sustainable solvent and reaction medium?, J. Phys. Condens. Matter, 2004, 16(14), S1161–S1169 CrossRef CAS.
- A. Kruse and E. Dinjus, Hydrogen from methane and supercritical water, Angew. Chem., Int. Ed., 2003, 42(8), 909–911 CrossRef CAS.
- A. Sinag, A. Kruse and V. Schwarzkopf, Key compounds of the hydropyrolysis of glucose in supercritical water in the presence of K2CO3, Ind. Eng. Chem. Res., 2003, 42(15), 3516–3521 CrossRef CAS.
- A. Kruse, D. Meier, P. Rimbrecht and M. Schacht, Gasification of pyrocatechol in supercritical water in the presence of potassium hydroxide, Ind. Eng. Chem. Res., 2000, 39(12), 4842–4848 CrossRef CAS.
- N. Boukis, U. Galla, H. Müller and E. Dinjus, Biomass gasification in supercritical water. Experimental progress achieved with the VERENA pilot plant, in 15th European Biomass Conference & Exhibition, Berlin, 2007 Search PubMed.
- P. D'Jesús, N. Boukis, B. Kraushaar-Czarnetzki and E. Dinjus, Gasification of corn and clover grass in supercritical water, Fuel, 2006, 85(7–8), 1032–1038 CAS.
- D. C. Elliott and L. J. Sealock Jr, Aqueous catalyst systems for the water-gas shift reaction. 1. Comparative catalyst studies, Ind. Eng. Chem. Prod. Res. Dev., 1983, 22(3), 426–431 CrossRef.
- D. C. Elliott, R. T. Hallen and L. J. Sealock Jr, Aqueous catalyst systems for the water-gas shift reaction. 2. Mechanism of basic catalysis, Ind. Eng. Chem. Prod. Res. Dev., 1983, 22(3), 431–435 CrossRef.
- P. Kritzer, Corrosion in high-temperature and supercritical water and aqueous solutions: A review, J. Supercrit. Fluids, 2004, 29(1–2), 1–29 CrossRef CAS.
- P. Marrone and G. Hong, Corrosion control methods in supercritical water oxidation and gasification processes, in CORROSION/08, 08422, NACE, Houston, TX, 2008 Search PubMed.
- J. Penninger and M. Rep, Reforming of aqueous wood pyrolysis condensate in supercritical water, Int. J. Hydrogen Energy, 2006, 31(11), 1597–1606 CrossRef CAS.
- J. Penninger, G. Maass and M. Rep, Compressed hydrogen-rich fuel gas (CHFG) from wet biomass by reforming in supercritical water, Int. J. Hydrogen Energy, 2007, 32(10–11), 1472–1476 CrossRef CAS.
- P. Williams and J. Onwudili, Subcritical and supercritical water gasification of cellulose, starch, glucose, and biomass waste, Energy Fuels, 2006, 20(3), 1259–1265 CrossRef CAS.
- G. Hong and M. Spritzer, Supercritical water partial oxidation, Proceedings of the 2002 U.S. DOE Hydrogen Program Review, 2002, NREL/CP-610–32405 Search PubMed.
- General Atomics. Supercritical water partial oxidation: Phase I – Pilot-scale testing /feasibility studies final report. GA-C24239, General Atomics, 2005. Prepared for the United States Department of Energy, cooperative agreement DE-FC36-00GO10529 Search PubMed.
- J. Taylor, C. Herdman, B. Wu, K. Wally and S. Rice, Hydrogen production in a compact supercritical water reformer, Int. J. Hydrogen Energy, 2003, 28(11), 1171–1178 CrossRef CAS.
- K. Pinkwart, T. Bayha, W. Lutter and M. Krausa, Gasification of diesel oil in supercritical water for fuel cells, J. Power Sources, 2004, 136(2), 211–214 CrossRef CAS.
- N. Boukis, V. Diem, W. Habicht and E. Dinjus, Methanol reforming in supercritical water, Ind. Eng. Chem. Res., 2003, 42(4), 728–735 CrossRef CAS.
- M. Waldner and F. Vogel, Renewable production of methane from woody biomass by catalytic hydrothermal gasification, Ind. Eng. Chem. Res., 2005, 44(13), 4543–4551 CrossRef CAS.
- T. Minowa, F. Zhen and T. Ogi, Cellulose decomposition in hot-compressed water with alkali or nickel catalyst, J. Supercrit. Fluids, 1998, 13(1–3), 253–259 CrossRef CAS.
- T. Minowa and Z. Fang, Hydrogen production from cellulose in hot compressed water using reduced nickel catalyst: product distribution at different reaction temperatures, J. Chem. Eng. Jpn., 1998, 31(3), 488–491 CrossRef CAS.
- T. Minowa and T. Ogi, Hydrogen production from cellulose using a reduced nickel catalyst, Catal. Today, 1998, 45(1–4), 411–416 CrossRef CAS.
- T. Minowa and S. Inoue, Hydrogen production from biomass by catalytic gasification in hot compressed water, Renewable Energy, 1999, 16(1–4), 1114–1117 CrossRef CAS.
- A. Kruse, T. Henningsen, A. Sinag and J. Pfeiffer, Biomass gasification in supercritical water: Influence of the dry matter content and the formation of phenols, Ind. Eng. Chem. Res., 2003, 42(16), 3711–3717 CrossRef CAS.
- A. Kruse and A. Gawlik, Biomass conversion in water at 330–410 °C and 30–50 MPa. Identification of key compounds for indicating different chemical reaction pathways, Ind. Eng. Chem. Res., 2003, 42(2), 267–279 CrossRef CAS.
- A. Sinag, A. Kruse and J. Rathert, Influence of the heating rate and the type of catalyst on the formation of key intermediates and on the generation of gases during hydropyrolysis of glucose in supercritical water in a batch reactor, Ind. Eng. Chem. Res., 2004, 43(2), 502–508 CrossRef CAS.
- P. Williams and J. Onwudili, Composition of products from the supercritical water gasification of glucose: A model biomass compound, Ind. Eng. Chem. Res., 2005, 44(23), 8739–8749 CrossRef CAS.
- F. Vogel, Catalytic conversion of high-moisture biomass to synthetic natural gas in supercritical water, in Handbook of Green Chemistry, Paul Anastas (Series Editor), Volume 3 Heterogeneous Catalysis, Robert Crabtree (Volume Editor), Wiley-VCH, Weinheim, 2009. ISBN (Volume 3): 978-3-527-32498-9 Search PubMed.
- M. Osada, T. Sato, M. Watanabe, M. Shirai and K. Arai, Catalytic gasification of wood biomass in subcritical and supercritical water, Combust. Sci. Technol., 2006, 178(1–3), 537–552 CrossRef CAS.
- R. Butner, L. Sealock Jr and D. Elliott, Development of water slurry gasification systems for high-moisture biomass, Biotechnol. Bioeng. Symp., 1986, 15(15), 3–16 Search PubMed.
- R. Butner, D. Elliott and L. Sealock Jr, Effect of catalyst type and concentration on thermal gasification of high-moisture biomass feedstocks, in Biotechnol. Bioeng. Symp., 1986, pp. 169–177 Search PubMed.
- R. Butner, D. Elliott, and L. Sealock Jr, Energy recovery from aquatic biomass in a thermochemical reactor, in Aquatic Plants for Water Treatment and Resource Recovery, ed. K. Reddy and W. Smith, Magnolia Publishing, 1987 Search PubMed.
- D. Elliott, L. Sealock Jr and E. Baker, Chemical processing in high-pressure aqueous environments. 2. Development of catalysts for gasification, Ind. Eng. Chem. Res., 1993, 32(8), 1542–1548 CrossRef CAS.
- D. Elliott, L. Sealock Jr and E. Baker, Chemical processing in high-pressure aqueous environments. 3. Batch reactor process development experiments for organics destruction, Ind. Eng. Chem. Res., 1994, 33(3), 558–565 CrossRef CAS.
- D. Elliott, M. Phelps, L. Sealock Jr and E. Baker, Chemical processing in high-pressure aqueous environments. 4. Continuous-flow reactor process development experiments for organics destruction, Ind. Eng. Chem. Res., 1994, 33(3), 566–574 CrossRef CAS.
- D. Elliott and L. Sealock Jr, Chemical processing in high-pressure aqueous environments: Low-temperature catalytic gasification, Chem. Eng. Res. Des., 1996, 74(5), 563–566 CAS.
- D. Elliott, G. Neuenschwander, T. Hart, R. Butner, A. Zacher, M. Engelhard, J. Young and D. McCready, Chemical processing in high-pressure aqueous environments. 7. Process development for catalytic gasification of wet biomass feedstocks, Ind. Eng. Chem. Res., 2004, 43(9), 1999–2004 CrossRef CAS.
- D. Elliott, T. Hart and G. Neuenschwander, Chemical processing in high-pressure aqueous environments. 8. Improved catalysts for hydrothermal gasification, Ind. Eng. Chem. Res., 2006, 45(11), 3776–3781 CrossRef CAS.
- T. Sato, M. Osada, M. Watanabe, M. Shirai and K. Arai, Gasification of alkylphenols with supported noble metal catalysts in supercritical water, Ind. Eng. Chem. Res., 2003, 42(19), 4277–4282 CrossRef CAS.
- M. Osada, O. Sato, K. Arai and M. Shirai, Stability of supported ruthenium catalysts for lignin gasification in supercritical water, Energy Fuels, 2006, 20(6), 2337–2343 CrossRef CAS.
- M. Osada, N. Hiyoshi, O. Sato, K. Arai and M. Shirai, Effect of sulfur on catalytic gasification of lignin in supercritical water, Energy Fuels, 2007, 21(3), 1400–1405 CrossRef CAS.
- T. Furusawa, T. Sato, M. Saito, Y. Ishiyama, M. Sato, N. Itoh and N. Suzuki, The evaluation of the stability of Ni/MgO catalysts for the gasification of lignin in supercritical water, Appl. Catal. A: General, 2007, 327(2), 300–310 CrossRef CAS.
- T. Minowa, T. Ogi, Y. Dote and S. Yokoyama, Methane production from cellulose by catalytic gasification, Renewable Energy, 1994, 5(5–8), 813–815 CrossRef CAS.
- T. Minowa, T. Ogi and S. Yokoyama, Effect of pressure on low temperature gasification of wet cellulose into methane using reduced nickel catalyst and sodium carbonate, Chem. Lett., 1995, 24, 285–286 CrossRef.
- T. Minowa, T. Ogi and S. Yokoyama, Hydrogen production from wet cellulose by low temperature gasification using a reduced nickel catalyst, Chem. Lett., 1995, 24(10), 937–938 CrossRef.
- Y. Usui, T. Minowa, S. Inoue and T. Ogi, Selective hydrogen production from cellulose at low temperature catalyzed by supported group 10 metal, Chem. Lett., 2000, 29(10), 1166–1167 CrossRef.
- H. Nakagawa, A. Namba, M. Böhlmann and K. Miura, Hydrothermal dewatering of brown coal and catalytic hydrothermal gasification of the organic compounds dissolving in the water using a novel Ni/carbon catalyst, Fuel, 2004, 83(6), 719–725 CrossRef CAS.
- A. Sharma, H. Nakagawa and K. Miura, Uniform dispersion of Ni nano particles in a carbon based catalyst for increasing catalytic activity for CH4 and H2 production by hydrothermal gasification, Fuel, 2006, 85(17–18), 2396–2401 CrossRef CAS.
- A. Sharma, H. Nakagawa and K. Miura, A novel nickel/carbon catalyst for CH4 and H2 production from organic compounds dissolved in wastewater by catalytic hydrothermal gasification, Fuel, 2006, 85(2), 179–184 CrossRef CAS.
- A. Sharma, I. Saito, H. Nakagawa and K. Miura, Effect of carbonization temperature on the nickel crystallite size of a Ni/C catalyst for catalytic hydrothermal gasification of organic compounds, Fuel, 2007, 86(7–8), 915–920 CrossRef CAS.
- T. Minowa and S. Sawayama, A novel microalgal system for energy production with nitrogen cycling, Fuel, 1999, 78(10), 1213–1215 CrossRef CAS.
- Z. Fang, T. Minowa, C. Fang, J. Smith, R. L., H. Inomata and J. Kozinski, Catalytic hydrothermal gasification of cellulose and glucose, Int. J. Hydrogen Energy, 2008, 33(3), 981–990 CrossRef CAS.
- Z. Fang, T. Minowa, R. Smith Jr, T. Ogi and J. Kozinski, Liquefaction and gasification of cellulose with Na2CO3 and Ni in subcritical water at 350 °C, Ind. Eng. Chem. Res., 2004, 43(10), 2454–2463 CrossRef CAS.
- K. Park and H. Tomiyasu, Gasification reaction of organic compounds catalyzed by RuO2 in supercritical water, Chem. Commun., 2003, 694–695 RSC.
- Y. Izumizaki, K. Park, Y. Tachibana, H. Tomiyasu and Y. Fujii, Organic decomposition in supercritical water by an aid of ruthenium (IV) oxide as a catalyst–Exploitation of biomass resources for hydrogen production, Prog. Nucl. Energy, 2005, 47(1–4), 544–552 CrossRef CAS.
- T. Yoshida and Y. Oshima, Partial oxidative and catalytic biomass gasification in supercritical water: A promising flow reactor system, Ind. Eng. Chem. Res., 2004, 43(15), 4097–4104 CrossRef CAS.
- F. Vogel, M. Waldner, A. Rouff and S. Rabe, Synthetic natural gas from biomass by catalytic conversion in supercritical water, Green Chem., 2007, 9(6), 616–619 RSC.
- M. H. Waldner, F. Krumeich and F. Vogel, Synthetic natural gas by hydrothermal gasification of biomass: Selection procedure towards a stable catalyst and its sodium sulfate tolerance, J. Supercrit. Fluids, 2007, 43(1), 91–105 CrossRef CAS.
- M. Waldner, Catalytic hydrothermal gasification of biomass for the production of synthetic natural gas, PhD thesis, ETH Zürich, 2007, No. 17100, http://e-collection.ethbib.ethz.ch/view/eth:29520 Search PubMed.
- M. Watanabe, H. Inomata, R. Smith Jr and K. Arai, Catalytic decarboxylation of acetic acid with zirconia catalyst in supercritical water, Appl. Catal. A: General, 2001, 219(1–2), 149–156 CrossRef CAS.
- M. Watanabe, T. Iida, Y. Aizawa, H. Ura, H. Inomata and K. Arai, Conversions of some small organic compounds with metal oxides in supercritical water at 673 K, Green Chem., 2003, 5(5), 539–544 RSC.
- M. Watanabe, M. Osada, H. Inomata, K. Arai and A. Kruse, Acidity and basicity of metal oxide catalysts for formaldehyde reaction in supercritical water at 673 K, Appl. Catal. A: General, 2003, 245(2), 333–341 CAS.
- M. Watanabe, H. Inomata and K. Arai, Catalytic hydrogen generation from biomass (glucose and cellulose) with ZrO2 in supercritical water, Biomass Bioenergy, 2002, 22(5), 405–410 CrossRef CAS.
- M. Watanabe, H. Inomata, M. Osada, T. Sato, T. Adschiri and K. Arai, Catalytic effects of NaOH and ZrO2 for partial oxidative gasification of n-hexadecane and lignin in supercritical water, Fuel, 2003, 82(5), 545–552 CrossRef CAS.
- C. Levy, M. Watanabe, Y. Aizawa, H. Inomata and K. Sue, Synthesis of nanophased metal oxides in supercritical water: Catalysts for biomass conversion, Int. J. Appl. Ceram. Technol., 2006, 3(5), 337–344 CrossRef CAS.
- D. Elliott, R. Butner and L. Sealock Jr, Low-temperature gasification of high-moisture biomass, in Research in thermochemical biomass conversion, ed. A. Bridgwater, Elsevier, 1988 Search PubMed.
- L. Sealock Jr and D. Elliott, Method for the catalytic conversion of lignocellulosic materials, US Pat., 5019135, 1991 Search PubMed.
- D. Elliott, L. Sealock Jr and E. Baker, Method for the catalytic conversion of organic materials into a product gas, US Pat., 5616154, 1997 Search PubMed.
- D. Elliott, T. Werpy, Y. Wang and J. Frye, Ruthenium on rutile catalyst, catalytic system, and method for aqueous phase hydrogenations, US Pat., 6235797, 2001 Search PubMed.
- D. Elliott and T. Hart, Method for aqueous phase reactions, US Pat., 6152975, 2000 Search PubMed.
- M. Osada, N. Hiyoshi, O. Sato, K. Arai and M. Shirai, Subcritical water regeneration of supported ruthenium catalyst poisoned by sulfur, Energy Fuels, 2008, 22(2), 845–849 CrossRef CAS.
- A. Haiduc, M. Brandenberger, S. Suquet, C. Ludwig, F. Vogel, R. Bernier-Latmani and S. Stucki, Hydrothermal methane from biomass, in Proc. R'07 World Congress—Recovery of Materials and Energy for Resource Efficiency, Davos, Switzerland, 2007 Search PubMed.
- R. D. Cortright, R. R. Davda and J. A. Dumesic, Hydrogen from catalytic reforming of biomass-derived hydrocarbons in liquid water, Nature, 2002, 418(6901), 964–967 CrossRef CAS.
- G. W. Huber, J. W. Shabaker and J. A. Dumesic, Raney Ni-Sn catalyst for H2 production from biomass-derived hydrocarbons, Science, 2003, 300(5628), 2075–2077 CrossRef CAS.
- R. Davda, J. Shabaker, G. Huber, R. Cortright and J. Dumesic, A review of catalytic issues and process conditions for renewable hydrogen and alkanes by aqueous-phase reforming of oxygenated hydrocarbons over supported metal catalysts, Appl. Catal. B: Environmental, 2005, 56(1–2), 171–186 CrossRef CAS.
- United Nations Industrial Development Organization. Fertilizer Manual, United Nations, 1980 Search PubMed.
- A. A. Peterson, P. Vontobel, F. Vogel and J. W. Tester, In situ visualization of the performance of a supercritical-water salt separator using neutron radiography, J. Supercrit. Fluids, 2008, 43(3), 490–499 CrossRef CAS.
- N. Boukis, U. Galla, V. Diem and E. Dinjus, Biomass gasification in supercritical water: first results of the pilot plant, in Science in Thermal and Chemical Biomass Conversion STCBC, ed. A. Bridgwater and D. Boocock, CPL Press, 2006, vol. 2, pp. 975–990 Search PubMed.
- A. Nakamura, E. Kiyonaga, Y. Yamamura, Y. Shimizu, T. Minowa, Y. Noda and Y. Matsumura, Detailed analysis of heat and mass balance for supercritical water gasification, J. Chem. Eng. Jpn., 2008 Search PubMed , in press.
- F. Vogel, J. L. DiNaro Blanchard, P. A. Marrone, S. F. Rice, P. A. Webley, W. A. Peters, K. A. Smith and J. W. Tester, Critical review of kinetic data for the oxidation of methanol in supercritical water, J. Supercrit. Fluids, 2005, 34(3), 249–286 CrossRef CAS.
- A. R. Katritzky, D. A. Nichols, M. Siskin, R. Murugan and M. Balasubramanian, Reactions in high-temperature aqueous media, Chem. Rev., 2001, 101(4), 837–892 CrossRef CAS.
- D. C. Elliott, Catalytic hydrothermal gasification of biomass, Biofuels Bioprod. Biorefin., 2008, 2(3), 254–265 Search PubMed.
- Y. Yu and P. E. Savage, Decomposition of formic acid under hydrothermal conditions, Ind. Eng. Chem. Res., 1998, 37(1), 2–10 CrossRef CAS.
Footnotes |
| † For pure water, if we are below its critical temperature at 374 °C, a liquid phase will exist when pressures are held above the vapor pressure; if we are above the critical temperature and above its critical pressure of 22.1 MPa, a supercritical fluid phase will exist. For aqueous mixtures, the pressure and temperature conditions of the critical point will vary with composition. |
| ‡ FTT reactions derive their name from the Fischer–Tropsch reaction, which is the industrial catalytic synthesis of hydrocarbons from syngas (a mixture of CO and H2) that is traditionally used in gas- or coal-to-liquids processes. |
| § Carbon in all gaseous products (CO2, CH4, CO) to total carbon in the feed. |
| This journal is © The Royal Society of Chemistry 2008 |